

Key Insights
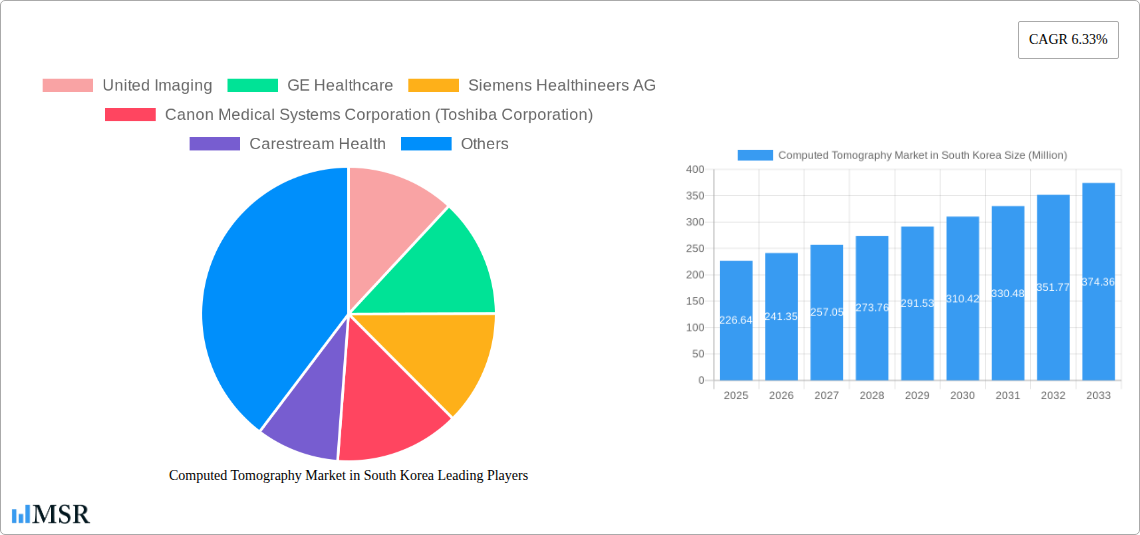
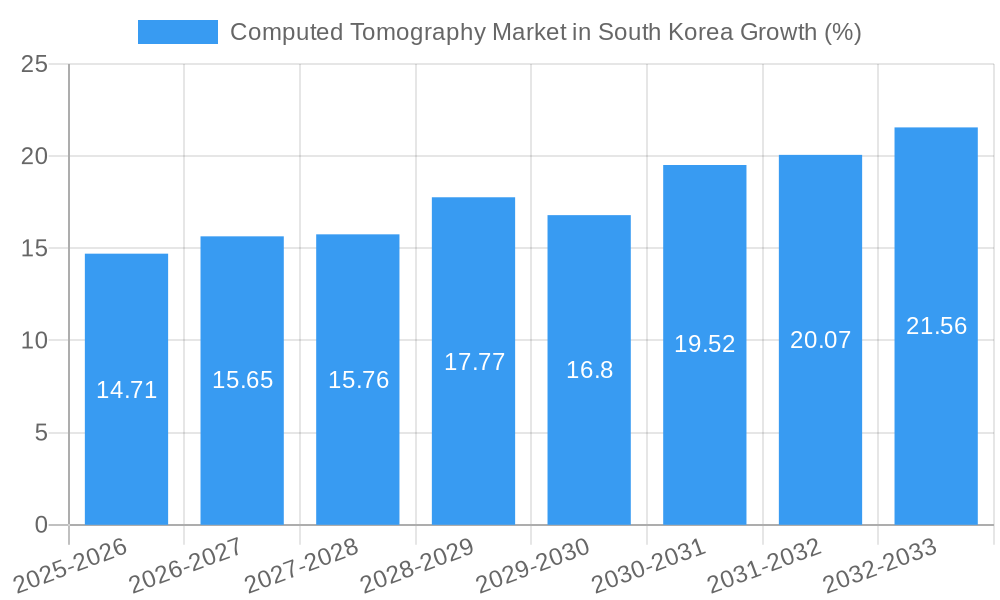
The South Korean computed tomography (CT) market, valued at $226.64 million in 2025, is projected to experience robust growth, driven by a Compound Annual Growth Rate (CAGR) of 6.33% from 2025 to 2033. This expansion is fueled by several key factors. Increasing prevalence of chronic diseases like cancer and cardiovascular ailments necessitates advanced diagnostic imaging technologies, boosting demand for CT scans. Technological advancements, such as multi-slice CT scanners offering faster scan times and improved image quality, are further driving market growth. The rising geriatric population in South Korea also contributes significantly, as older adults often require more frequent CT scans for disease monitoring and diagnosis. Furthermore, increasing government initiatives to improve healthcare infrastructure and accessibility are expected to positively influence market expansion. The market is segmented by type (low, medium, and high slice CT scanners), application (oncology, neurology, cardiovascular, musculoskeletal, and other applications), and end-user (hospitals and diagnostic centers). While hospitals currently hold a larger market share, the growth of specialized diagnostic centers is anticipated to contribute to market diversification. Competitive dynamics are shaped by key players including United Imaging, GE Healthcare, Siemens Healthineers, Canon Medical Systems, Carestream Health, Philips, and Planmeca, all vying for market share through technological innovation and strategic partnerships.
Despite the positive growth trajectory, the market faces certain challenges. High equipment costs and maintenance expenses can hinder wider adoption, particularly in smaller clinics or rural areas. Furthermore, the increasing adoption of alternative imaging techniques like MRI and ultrasound may somewhat restrain the growth of the CT market. However, the advantages of CT scans in terms of speed, affordability in certain cases, and wide availability are likely to outweigh these restraints, ensuring continued market expansion throughout the forecast period. The high-slice CT segment is expected to show particularly strong growth due to its superior imaging capabilities. The oncology application segment will likely remain dominant given the increasing incidence of cancer in South Korea.
Computed Tomography (CT) Market in South Korea: A Comprehensive Report (2019-2033)
This in-depth report provides a comprehensive analysis of the Computed Tomography (CT) market in South Korea, covering the period 2019-2033. It delves into market dynamics, industry trends, key segments, leading players, and future growth prospects, offering actionable insights for industry stakeholders. The report utilizes data from the historical period (2019-2024), base year (2025), and estimated year (2025) to forecast market trends until 2033. The market size is projected in Millions.
Computed Tomography Market in South Korea Market Concentration & Dynamics
The South Korean CT market exhibits a moderately concentrated landscape, with a few major players commanding significant market share. The market share held by the top five companies is estimated at xx% in 2025. This concentration is influenced by factors like stringent regulatory approvals, high capital expenditure for advanced systems, and strong brand loyalty among healthcare providers. Innovation in the sector is driven by a robust ecosystem involving research institutions, medical device manufacturers, and government initiatives fostering technological advancements. South Korea’s well-established regulatory framework, emphasizing safety and efficacy, guides market activities, impacting product approvals and market access. While substitute imaging technologies exist (e.g., MRI), CT remains dominant due to its speed, cost-effectiveness, and wide range of applications. End-user trends indicate a growing preference for advanced CT scanners with high slice counts and enhanced imaging capabilities. The number of M&A deals within the South Korean CT market during 2019-2024 was xx, reflecting strategic alliances and expansion activities.
- Market Concentration: Top 5 players hold xx% market share (2025).
- Innovation Ecosystem: Strong collaboration between research institutions, manufacturers, and government.
- Regulatory Framework: Stringent approvals ensuring safety and efficacy.
- Substitute Products: MRI and Ultrasound, but CT maintains dominance.
- End-User Trends: Increasing demand for high-slice CT scanners.
- M&A Activity: xx deals during 2019-2024.
Computed Tomography Market in South Korea Industry Insights & Trends
The South Korean CT market is projected to witness robust growth during the forecast period (2025-2033), with a CAGR of xx%. This growth is driven by several factors, including the rising prevalence of chronic diseases (e.g., cardiovascular diseases, cancer), an aging population demanding advanced diagnostic procedures, increasing healthcare expenditure, and government initiatives to improve healthcare infrastructure. Technological advancements, such as AI-powered image analysis and multi-slice CT technology, are transforming the diagnostic landscape, improving diagnostic accuracy and efficiency. Changing consumer behaviors are also influencing the market; patients are increasingly aware of advanced diagnostic options and demanding higher quality imaging services. Furthermore, the increasing adoption of minimally invasive procedures necessitates the use of CT for pre- and post-operative guidance. The market size is estimated at xx Million in 2025, projected to reach xx Million by 2033.
Key Markets & Segments Leading Computed Tomography Market in South Korea
Dominant Segments:
- Type: High-slice CT scanners are dominating the market due to their superior image quality and diagnostic capabilities. Medium-slice systems maintain a significant share, driven by cost-effectiveness. Low-slice systems constitute a smaller segment.
- Application: Oncology applications, driven by the increasing prevalence of cancer, represent the largest segment. Neurology and cardiovascular applications also show significant growth potential.
- End User: Hospitals are the major end-users, followed by diagnostic centers.
Drivers for Dominant Segments:
- Oncology: Rising cancer incidence, demand for precise diagnoses, and advanced treatment planning.
- High-Slice CT: Superior image quality, faster scan times, and improved diagnostic accuracy.
- Hospitals: Large patient volumes, comprehensive diagnostic facilities, and investment capacity.
Dominance Analysis: The high-slice CT segment is experiencing the highest growth rate, driven by demand for superior image quality and improved diagnostic capabilities. Oncology applications are the most dominant, given the rising incidence of cancer and the importance of accurate diagnosis and treatment planning. Hospitals remain the key end-users due to their scale and investment capability.
Computed Tomography Market in South Korea Product Developments
Recent product innovations focus on enhancing image quality, reducing radiation dose, and improving workflow efficiency. Advancements include AI-powered image reconstruction and analysis, enabling faster and more accurate diagnoses. The development of dual-energy CT and spectral CT offers improved tissue characterization and enhanced diagnostic capabilities. These technological advancements provide competitive edges, attracting hospitals and diagnostic centers seeking improved patient care and operational efficiency.
Challenges in the Computed Tomography Market in South Korea Market
The South Korean CT market faces several challenges, including stringent regulatory approvals, which can delay product launches and increase costs. Supply chain disruptions can impact the availability of components, potentially leading to production delays. Furthermore, intense competition from established international players and the high cost of advanced systems pose challenges for smaller players. These factors can result in a xx% reduction in market growth in certain years.
Forces Driving Computed Tomography Market in South Korea Growth
Key growth drivers include rising prevalence of chronic diseases, increasing healthcare expenditure, government initiatives to modernize healthcare infrastructure, and a growing aging population demanding advanced diagnostic tools. The adoption of advanced imaging technologies with enhanced diagnostic capabilities further fuels market growth. The government’s focus on improving healthcare infrastructure plays a significant role.
Long-Term Growth Catalysts in Computed Tomography Market in South Korea
Long-term growth is expected to be fueled by ongoing technological advancements, such as AI integration and improved radiation dose reduction techniques. Strategic partnerships between manufacturers and healthcare providers will enhance market penetration. Expansion into underserved rural areas presents significant opportunities.
Emerging Opportunities in Computed Tomography Market in South Korea
Emerging opportunities include the integration of AI for improved image analysis and automated report generation. The development of mobile CT scanners for remote or point-of-care settings offers new market avenues. Expanding applications into new areas like cardiac imaging and functional imaging will contribute to market growth.
Leading Players in the Computed Tomography Market in South Korea Sector
- United Imaging
- GE Healthcare
- Siemens Healthineers AG
- Canon Medical Systems Corporation (Toshiba Corporation)
- Carestream Health
- Koninklijke Philips NV
- Planmeca Group (Planmed OY)
Key Milestones in Computed Tomography Market in South Korea Industry
- March 2022: Philips Korea unveiled Greeting CT Premium at KIMES2022, showcasing advancements in CT technology.
- January 2022: Bayer AG's MEDRAD Centargo CT device received approval from South Korea's Ministry of Food and Drug Safety, expanding market options.
Strategic Outlook for Computed Tomography Market in South Korea Market
The South Korean CT market presents significant growth opportunities. Companies can leverage technological advancements, strategic partnerships, and expansion into new segments to capitalize on market potential. Focusing on innovations that improve image quality, reduce radiation exposure, and enhance workflow efficiency will be crucial for maintaining a competitive edge. The market’s future is bright, driven by technological progress and increasing healthcare investment.
Computed Tomography Market in South Korea Segmentation
-
1. Type
- 1.1. Low Slice
- 1.2. Medium Slice
- 1.3. High Slice
-
2. Application
- 2.1. Oncology
- 2.2. Neurology
- 2.3. Cardiovascular
- 2.4. Musculoskeletal
- 2.5. Other Applications
-
3. End User
- 3.1. Hospitals
- 3.2. Diagnostic Centers
- 3.3. Other End Users
Computed Tomography Market in South Korea Segmentation By Geography
-
1. North America
- 1.1. United States
- 1.2. Canada
- 1.3. Mexico
-
2. South America
- 2.1. Brazil
- 2.2. Argentina
- 2.3. Rest of South America
-
3. Europe
- 3.1. United Kingdom
- 3.2. Germany
- 3.3. France
- 3.4. Italy
- 3.5. Spain
- 3.6. Russia
- 3.7. Benelux
- 3.8. Nordics
- 3.9. Rest of Europe
-
4. Middle East & Africa
- 4.1. Turkey
- 4.2. Israel
- 4.3. GCC
- 4.4. North Africa
- 4.5. South Africa
- 4.6. Rest of Middle East & Africa
-
5. Asia Pacific
- 5.1. China
- 5.2. India
- 5.3. Japan
- 5.4. South Korea
- 5.5. ASEAN
- 5.6. Oceania
- 5.7. Rest of Asia Pacific
Computed Tomography Market in South Korea REPORT HIGHLIGHTS
| Aspects | Details |
|---|---|
| Study Period | 2019-2033 |
| Base Year | 2024 |
| Estimated Year | 2025 |
| Forecast Period | 2025-2033 |
| Historical Period | 2019-2024 |
| Growth Rate | CAGR of 6.33% from 2019-2033 |
| Segmentation |
|
Table of Contents
- 1. Introduction
- 1.1. Research Scope
- 1.2. Market Segmentation
- 1.3. Research Methodology
- 1.4. Definitions and Assumptions
- 2. Executive Summary
- 2.1. Introduction
- 3. Market Dynamics
- 3.1. Introduction
- 3.2. Market Drivers
- 3.2.1. Increasing Prevalence of Chronic Diseases; Rising Geriatric Population; Increasing Technological Advancements
- 3.3. Market Restrains
- 3.3.1. Lack Of Proper Reimbursement And Stringent Regulatory Approval Procedures; High Cost of Equipment
- 3.4. Market Trends
- 3.4.1. Oncology Segment is Expected to Hold a Significant Market Share Over the Forecast Period
- 4. Market Factor Analysis
- 4.1. Porters Five Forces
- 4.2. Supply/Value Chain
- 4.3. PESTEL analysis
- 4.4. Market Entropy
- 4.5. Patent/Trademark Analysis
- 5. Global Computed Tomography Market in South Korea Analysis, Insights and Forecast, 2019-2031
- 5.1. Market Analysis, Insights and Forecast - by Type
- 5.1.1. Low Slice
- 5.1.2. Medium Slice
- 5.1.3. High Slice
- 5.2. Market Analysis, Insights and Forecast - by Application
- 5.2.1. Oncology
- 5.2.2. Neurology
- 5.2.3. Cardiovascular
- 5.2.4. Musculoskeletal
- 5.2.5. Other Applications
- 5.3. Market Analysis, Insights and Forecast - by End User
- 5.3.1. Hospitals
- 5.3.2. Diagnostic Centers
- 5.3.3. Other End Users
- 5.4. Market Analysis, Insights and Forecast - by Region
- 5.4.1. North America
- 5.4.2. South America
- 5.4.3. Europe
- 5.4.4. Middle East & Africa
- 5.4.5. Asia Pacific
- 5.1. Market Analysis, Insights and Forecast - by Type
- 6. North America Computed Tomography Market in South Korea Analysis, Insights and Forecast, 2019-2031
- 6.1. Market Analysis, Insights and Forecast - by Type
- 6.1.1. Low Slice
- 6.1.2. Medium Slice
- 6.1.3. High Slice
- 6.2. Market Analysis, Insights and Forecast - by Application
- 6.2.1. Oncology
- 6.2.2. Neurology
- 6.2.3. Cardiovascular
- 6.2.4. Musculoskeletal
- 6.2.5. Other Applications
- 6.3. Market Analysis, Insights and Forecast - by End User
- 6.3.1. Hospitals
- 6.3.2. Diagnostic Centers
- 6.3.3. Other End Users
- 6.1. Market Analysis, Insights and Forecast - by Type
- 7. South America Computed Tomography Market in South Korea Analysis, Insights and Forecast, 2019-2031
- 7.1. Market Analysis, Insights and Forecast - by Type
- 7.1.1. Low Slice
- 7.1.2. Medium Slice
- 7.1.3. High Slice
- 7.2. Market Analysis, Insights and Forecast - by Application
- 7.2.1. Oncology
- 7.2.2. Neurology
- 7.2.3. Cardiovascular
- 7.2.4. Musculoskeletal
- 7.2.5. Other Applications
- 7.3. Market Analysis, Insights and Forecast - by End User
- 7.3.1. Hospitals
- 7.3.2. Diagnostic Centers
- 7.3.3. Other End Users
- 7.1. Market Analysis, Insights and Forecast - by Type
- 8. Europe Computed Tomography Market in South Korea Analysis, Insights and Forecast, 2019-2031
- 8.1. Market Analysis, Insights and Forecast - by Type
- 8.1.1. Low Slice
- 8.1.2. Medium Slice
- 8.1.3. High Slice
- 8.2. Market Analysis, Insights and Forecast - by Application
- 8.2.1. Oncology
- 8.2.2. Neurology
- 8.2.3. Cardiovascular
- 8.2.4. Musculoskeletal
- 8.2.5. Other Applications
- 8.3. Market Analysis, Insights and Forecast - by End User
- 8.3.1. Hospitals
- 8.3.2. Diagnostic Centers
- 8.3.3. Other End Users
- 8.1. Market Analysis, Insights and Forecast - by Type
- 9. Middle East & Africa Computed Tomography Market in South Korea Analysis, Insights and Forecast, 2019-2031
- 9.1. Market Analysis, Insights and Forecast - by Type
- 9.1.1. Low Slice
- 9.1.2. Medium Slice
- 9.1.3. High Slice
- 9.2. Market Analysis, Insights and Forecast - by Application
- 9.2.1. Oncology
- 9.2.2. Neurology
- 9.2.3. Cardiovascular
- 9.2.4. Musculoskeletal
- 9.2.5. Other Applications
- 9.3. Market Analysis, Insights and Forecast - by End User
- 9.3.1. Hospitals
- 9.3.2. Diagnostic Centers
- 9.3.3. Other End Users
- 9.1. Market Analysis, Insights and Forecast - by Type
- 10. Asia Pacific Computed Tomography Market in South Korea Analysis, Insights and Forecast, 2019-2031
- 10.1. Market Analysis, Insights and Forecast - by Type
- 10.1.1. Low Slice
- 10.1.2. Medium Slice
- 10.1.3. High Slice
- 10.2. Market Analysis, Insights and Forecast - by Application
- 10.2.1. Oncology
- 10.2.2. Neurology
- 10.2.3. Cardiovascular
- 10.2.4. Musculoskeletal
- 10.2.5. Other Applications
- 10.3. Market Analysis, Insights and Forecast - by End User
- 10.3.1. Hospitals
- 10.3.2. Diagnostic Centers
- 10.3.3. Other End Users
- 10.1. Market Analysis, Insights and Forecast - by Type
- 11. Competitive Analysis
- 11.1. Global Market Share Analysis 2024
- 11.2. Company Profiles
- 11.2.1 United Imaging
- 11.2.1.1. Overview
- 11.2.1.2. Products
- 11.2.1.3. SWOT Analysis
- 11.2.1.4. Recent Developments
- 11.2.1.5. Financials (Based on Availability)
- 11.2.2 GE Healthcare
- 11.2.2.1. Overview
- 11.2.2.2. Products
- 11.2.2.3. SWOT Analysis
- 11.2.2.4. Recent Developments
- 11.2.2.5. Financials (Based on Availability)
- 11.2.3 Siemens Healthineers AG
- 11.2.3.1. Overview
- 11.2.3.2. Products
- 11.2.3.3. SWOT Analysis
- 11.2.3.4. Recent Developments
- 11.2.3.5. Financials (Based on Availability)
- 11.2.4 Canon Medical Systems Corporation (Toshiba Corporation)
- 11.2.4.1. Overview
- 11.2.4.2. Products
- 11.2.4.3. SWOT Analysis
- 11.2.4.4. Recent Developments
- 11.2.4.5. Financials (Based on Availability)
- 11.2.5 Carestream Health
- 11.2.5.1. Overview
- 11.2.5.2. Products
- 11.2.5.3. SWOT Analysis
- 11.2.5.4. Recent Developments
- 11.2.5.5. Financials (Based on Availability)
- 11.2.6 Koninklijke Philips NV
- 11.2.6.1. Overview
- 11.2.6.2. Products
- 11.2.6.3. SWOT Analysis
- 11.2.6.4. Recent Developments
- 11.2.6.5. Financials (Based on Availability)
- 11.2.7 Planmeca Group (Planmed OY)
- 11.2.7.1. Overview
- 11.2.7.2. Products
- 11.2.7.3. SWOT Analysis
- 11.2.7.4. Recent Developments
- 11.2.7.5. Financials (Based on Availability)
- 11.2.1 United Imaging
List of Figures
- Figure 1: Global Computed Tomography Market in South Korea Revenue Breakdown (Million, %) by Region 2024 & 2032
- Figure 2: South Korea Computed Tomography Market in South Korea Revenue (Million), by Country 2024 & 2032
- Figure 3: South Korea Computed Tomography Market in South Korea Revenue Share (%), by Country 2024 & 2032
- Figure 4: North America Computed Tomography Market in South Korea Revenue (Million), by Type 2024 & 2032
- Figure 5: North America Computed Tomography Market in South Korea Revenue Share (%), by Type 2024 & 2032
- Figure 6: North America Computed Tomography Market in South Korea Revenue (Million), by Application 2024 & 2032
- Figure 7: North America Computed Tomography Market in South Korea Revenue Share (%), by Application 2024 & 2032
- Figure 8: North America Computed Tomography Market in South Korea Revenue (Million), by End User 2024 & 2032
- Figure 9: North America Computed Tomography Market in South Korea Revenue Share (%), by End User 2024 & 2032
- Figure 10: North America Computed Tomography Market in South Korea Revenue (Million), by Country 2024 & 2032
- Figure 11: North America Computed Tomography Market in South Korea Revenue Share (%), by Country 2024 & 2032
- Figure 12: South America Computed Tomography Market in South Korea Revenue (Million), by Type 2024 & 2032
- Figure 13: South America Computed Tomography Market in South Korea Revenue Share (%), by Type 2024 & 2032
- Figure 14: South America Computed Tomography Market in South Korea Revenue (Million), by Application 2024 & 2032
- Figure 15: South America Computed Tomography Market in South Korea Revenue Share (%), by Application 2024 & 2032
- Figure 16: South America Computed Tomography Market in South Korea Revenue (Million), by End User 2024 & 2032
- Figure 17: South America Computed Tomography Market in South Korea Revenue Share (%), by End User 2024 & 2032
- Figure 18: South America Computed Tomography Market in South Korea Revenue (Million), by Country 2024 & 2032
- Figure 19: South America Computed Tomography Market in South Korea Revenue Share (%), by Country 2024 & 2032
- Figure 20: Europe Computed Tomography Market in South Korea Revenue (Million), by Type 2024 & 2032
- Figure 21: Europe Computed Tomography Market in South Korea Revenue Share (%), by Type 2024 & 2032
- Figure 22: Europe Computed Tomography Market in South Korea Revenue (Million), by Application 2024 & 2032
- Figure 23: Europe Computed Tomography Market in South Korea Revenue Share (%), by Application 2024 & 2032
- Figure 24: Europe Computed Tomography Market in South Korea Revenue (Million), by End User 2024 & 2032
- Figure 25: Europe Computed Tomography Market in South Korea Revenue Share (%), by End User 2024 & 2032
- Figure 26: Europe Computed Tomography Market in South Korea Revenue (Million), by Country 2024 & 2032
- Figure 27: Europe Computed Tomography Market in South Korea Revenue Share (%), by Country 2024 & 2032
- Figure 28: Middle East & Africa Computed Tomography Market in South Korea Revenue (Million), by Type 2024 & 2032
- Figure 29: Middle East & Africa Computed Tomography Market in South Korea Revenue Share (%), by Type 2024 & 2032
- Figure 30: Middle East & Africa Computed Tomography Market in South Korea Revenue (Million), by Application 2024 & 2032
- Figure 31: Middle East & Africa Computed Tomography Market in South Korea Revenue Share (%), by Application 2024 & 2032
- Figure 32: Middle East & Africa Computed Tomography Market in South Korea Revenue (Million), by End User 2024 & 2032
- Figure 33: Middle East & Africa Computed Tomography Market in South Korea Revenue Share (%), by End User 2024 & 2032
- Figure 34: Middle East & Africa Computed Tomography Market in South Korea Revenue (Million), by Country 2024 & 2032
- Figure 35: Middle East & Africa Computed Tomography Market in South Korea Revenue Share (%), by Country 2024 & 2032
- Figure 36: Asia Pacific Computed Tomography Market in South Korea Revenue (Million), by Type 2024 & 2032
- Figure 37: Asia Pacific Computed Tomography Market in South Korea Revenue Share (%), by Type 2024 & 2032
- Figure 38: Asia Pacific Computed Tomography Market in South Korea Revenue (Million), by Application 2024 & 2032
- Figure 39: Asia Pacific Computed Tomography Market in South Korea Revenue Share (%), by Application 2024 & 2032
- Figure 40: Asia Pacific Computed Tomography Market in South Korea Revenue (Million), by End User 2024 & 2032
- Figure 41: Asia Pacific Computed Tomography Market in South Korea Revenue Share (%), by End User 2024 & 2032
- Figure 42: Asia Pacific Computed Tomography Market in South Korea Revenue (Million), by Country 2024 & 2032
- Figure 43: Asia Pacific Computed Tomography Market in South Korea Revenue Share (%), by Country 2024 & 2032
List of Tables
- Table 1: Global Computed Tomography Market in South Korea Revenue Million Forecast, by Region 2019 & 2032
- Table 2: Global Computed Tomography Market in South Korea Revenue Million Forecast, by Type 2019 & 2032
- Table 3: Global Computed Tomography Market in South Korea Revenue Million Forecast, by Application 2019 & 2032
- Table 4: Global Computed Tomography Market in South Korea Revenue Million Forecast, by End User 2019 & 2032
- Table 5: Global Computed Tomography Market in South Korea Revenue Million Forecast, by Region 2019 & 2032
- Table 6: Global Computed Tomography Market in South Korea Revenue Million Forecast, by Country 2019 & 2032
- Table 7: Global Computed Tomography Market in South Korea Revenue Million Forecast, by Type 2019 & 2032
- Table 8: Global Computed Tomography Market in South Korea Revenue Million Forecast, by Application 2019 & 2032
- Table 9: Global Computed Tomography Market in South Korea Revenue Million Forecast, by End User 2019 & 2032
- Table 10: Global Computed Tomography Market in South Korea Revenue Million Forecast, by Country 2019 & 2032
- Table 11: United States Computed Tomography Market in South Korea Revenue (Million) Forecast, by Application 2019 & 2032
- Table 12: Canada Computed Tomography Market in South Korea Revenue (Million) Forecast, by Application 2019 & 2032
- Table 13: Mexico Computed Tomography Market in South Korea Revenue (Million) Forecast, by Application 2019 & 2032
- Table 14: Global Computed Tomography Market in South Korea Revenue Million Forecast, by Type 2019 & 2032
- Table 15: Global Computed Tomography Market in South Korea Revenue Million Forecast, by Application 2019 & 2032
- Table 16: Global Computed Tomography Market in South Korea Revenue Million Forecast, by End User 2019 & 2032
- Table 17: Global Computed Tomography Market in South Korea Revenue Million Forecast, by Country 2019 & 2032
- Table 18: Brazil Computed Tomography Market in South Korea Revenue (Million) Forecast, by Application 2019 & 2032
- Table 19: Argentina Computed Tomography Market in South Korea Revenue (Million) Forecast, by Application 2019 & 2032
- Table 20: Rest of South America Computed Tomography Market in South Korea Revenue (Million) Forecast, by Application 2019 & 2032
- Table 21: Global Computed Tomography Market in South Korea Revenue Million Forecast, by Type 2019 & 2032
- Table 22: Global Computed Tomography Market in South Korea Revenue Million Forecast, by Application 2019 & 2032
- Table 23: Global Computed Tomography Market in South Korea Revenue Million Forecast, by End User 2019 & 2032
- Table 24: Global Computed Tomography Market in South Korea Revenue Million Forecast, by Country 2019 & 2032
- Table 25: United Kingdom Computed Tomography Market in South Korea Revenue (Million) Forecast, by Application 2019 & 2032
- Table 26: Germany Computed Tomography Market in South Korea Revenue (Million) Forecast, by Application 2019 & 2032
- Table 27: France Computed Tomography Market in South Korea Revenue (Million) Forecast, by Application 2019 & 2032
- Table 28: Italy Computed Tomography Market in South Korea Revenue (Million) Forecast, by Application 2019 & 2032
- Table 29: Spain Computed Tomography Market in South Korea Revenue (Million) Forecast, by Application 2019 & 2032
- Table 30: Russia Computed Tomography Market in South Korea Revenue (Million) Forecast, by Application 2019 & 2032
- Table 31: Benelux Computed Tomography Market in South Korea Revenue (Million) Forecast, by Application 2019 & 2032
- Table 32: Nordics Computed Tomography Market in South Korea Revenue (Million) Forecast, by Application 2019 & 2032
- Table 33: Rest of Europe Computed Tomography Market in South Korea Revenue (Million) Forecast, by Application 2019 & 2032
- Table 34: Global Computed Tomography Market in South Korea Revenue Million Forecast, by Type 2019 & 2032
- Table 35: Global Computed Tomography Market in South Korea Revenue Million Forecast, by Application 2019 & 2032
- Table 36: Global Computed Tomography Market in South Korea Revenue Million Forecast, by End User 2019 & 2032
- Table 37: Global Computed Tomography Market in South Korea Revenue Million Forecast, by Country 2019 & 2032
- Table 38: Turkey Computed Tomography Market in South Korea Revenue (Million) Forecast, by Application 2019 & 2032
- Table 39: Israel Computed Tomography Market in South Korea Revenue (Million) Forecast, by Application 2019 & 2032
- Table 40: GCC Computed Tomography Market in South Korea Revenue (Million) Forecast, by Application 2019 & 2032
- Table 41: North Africa Computed Tomography Market in South Korea Revenue (Million) Forecast, by Application 2019 & 2032
- Table 42: South Africa Computed Tomography Market in South Korea Revenue (Million) Forecast, by Application 2019 & 2032
- Table 43: Rest of Middle East & Africa Computed Tomography Market in South Korea Revenue (Million) Forecast, by Application 2019 & 2032
- Table 44: Global Computed Tomography Market in South Korea Revenue Million Forecast, by Type 2019 & 2032
- Table 45: Global Computed Tomography Market in South Korea Revenue Million Forecast, by Application 2019 & 2032
- Table 46: Global Computed Tomography Market in South Korea Revenue Million Forecast, by End User 2019 & 2032
- Table 47: Global Computed Tomography Market in South Korea Revenue Million Forecast, by Country 2019 & 2032
- Table 48: China Computed Tomography Market in South Korea Revenue (Million) Forecast, by Application 2019 & 2032
- Table 49: India Computed Tomography Market in South Korea Revenue (Million) Forecast, by Application 2019 & 2032
- Table 50: Japan Computed Tomography Market in South Korea Revenue (Million) Forecast, by Application 2019 & 2032
- Table 51: South Korea Computed Tomography Market in South Korea Revenue (Million) Forecast, by Application 2019 & 2032
- Table 52: ASEAN Computed Tomography Market in South Korea Revenue (Million) Forecast, by Application 2019 & 2032
- Table 53: Oceania Computed Tomography Market in South Korea Revenue (Million) Forecast, by Application 2019 & 2032
- Table 54: Rest of Asia Pacific Computed Tomography Market in South Korea Revenue (Million) Forecast, by Application 2019 & 2032
Frequently Asked Questions
1. What is the projected Compound Annual Growth Rate (CAGR) of the Computed Tomography Market in South Korea?
The projected CAGR is approximately 6.33%.
2. Which companies are prominent players in the Computed Tomography Market in South Korea?
Key companies in the market include United Imaging, GE Healthcare, Siemens Healthineers AG, Canon Medical Systems Corporation (Toshiba Corporation), Carestream Health, Koninklijke Philips NV, Planmeca Group (Planmed OY).
3. What are the main segments of the Computed Tomography Market in South Korea?
The market segments include Type, Application, End User.
4. Can you provide details about the market size?
The market size is estimated to be USD 226.64 Million as of 2022.
5. What are some drivers contributing to market growth?
Increasing Prevalence of Chronic Diseases; Rising Geriatric Population; Increasing Technological Advancements.
6. What are the notable trends driving market growth?
Oncology Segment is Expected to Hold a Significant Market Share Over the Forecast Period.
7. Are there any restraints impacting market growth?
Lack Of Proper Reimbursement And Stringent Regulatory Approval Procedures; High Cost of Equipment.
8. Can you provide examples of recent developments in the market?
In March 2022, Philips Korea unveiled Greeting CT Premium at 37th Korea International Medical & Hospital Equipment Show (KIMES2022) held at Samsung-dong COEX in Seoul.
9. What pricing options are available for accessing the report?
Pricing options include single-user, multi-user, and enterprise licenses priced at USD 3800, USD 4500, and USD 5800 respectively.
10. Is the market size provided in terms of value or volume?
The market size is provided in terms of value, measured in Million.
11. Are there any specific market keywords associated with the report?
Yes, the market keyword associated with the report is "Computed Tomography Market in South Korea," which aids in identifying and referencing the specific market segment covered.
12. How do I determine which pricing option suits my needs best?
The pricing options vary based on user requirements and access needs. Individual users may opt for single-user licenses, while businesses requiring broader access may choose multi-user or enterprise licenses for cost-effective access to the report.
13. Are there any additional resources or data provided in the Computed Tomography Market in South Korea report?
While the report offers comprehensive insights, it's advisable to review the specific contents or supplementary materials provided to ascertain if additional resources or data are available.
14. How can I stay updated on further developments or reports in the Computed Tomography Market in South Korea?
To stay informed about further developments, trends, and reports in the Computed Tomography Market in South Korea, consider subscribing to industry newsletters, following relevant companies and organizations, or regularly checking reputable industry news sources and publications.
Methodology
Step 1 - Identification of Relevant Samples Size from Population Database


Step 2 - Approaches for Defining Global Market Size (Value, Volume* & Price*)

Note*: In applicable scenarios
Step 3 - Data Sources
Primary Research
- Web Analytics
- Survey Reports
- Research Institute
- Latest Research Reports
- Opinion Leaders
Secondary Research
- Annual Reports
- White Paper
- Latest Press Release
- Industry Association
- Paid Database
- Investor Presentations

Step 4 - Data Triangulation
Involves using different sources of information in order to increase the validity of a study
These sources are likely to be stakeholders in a program - participants, other researchers, program staff, other community members, and so on.
Then we put all data in single framework & apply various statistical tools to find out the dynamic on the market.
During the analysis stage, feedback from the stakeholder groups would be compared to determine areas of agreement as well as areas of divergence
