

Key Insights
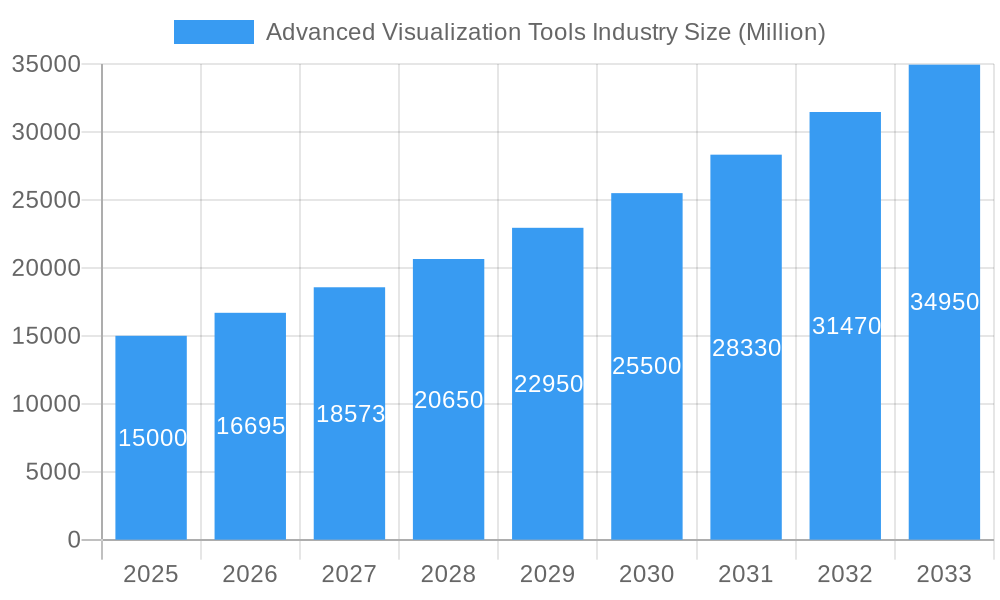
The Advanced Visualization Tools market is poised for significant expansion, with a projected market size of $4.14 billion by 2033, driven by a robust compound annual growth rate (CAGR) of 13.8% from a base year of 2025. This growth is underpinned by several critical factors. The increasing incidence of chronic diseases necessitates advanced diagnostic capabilities, driving demand for sophisticated visualization tools in key clinical areas like oncology, cardiology, and neurology. Technological innovation, including AI-powered image analysis and enhanced software for faster processing and superior image quality, is a primary growth catalyst. The trend towards minimally invasive procedures and the broader adoption of advanced imaging modalities such as MRI and CT scans further contribute to market expansion. Additionally, a heightened emphasis on preventative healthcare and early disease detection fuels the need for more precise and efficient diagnostic solutions. The market is segmented by imaging modality (MRI, CT, Ultrasound, Nuclear Medicine), clinical application, product and service type (hardware, software, services), and solution type (enterprise, standalone), reflecting diverse healthcare needs. While the hardware segment currently dominates due to initial investment requirements, the software and services segments are experiencing the most rapid growth, highlighting the increasing importance of data analytics and remote access.
Advanced Visualization Tools Industry Market Size (In Billion)
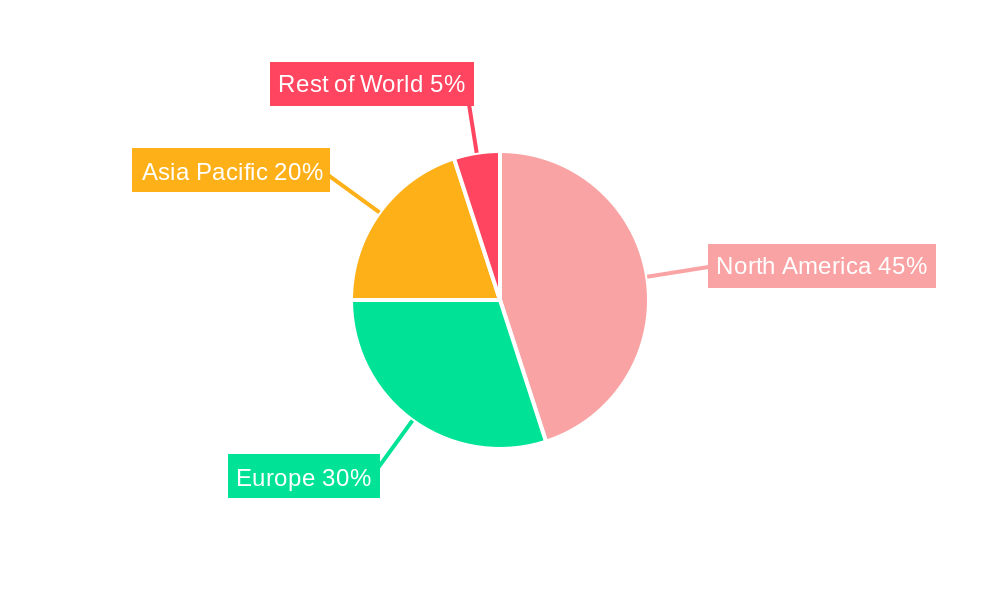
Geographically, North America, Europe, and the Asia-Pacific region are expected to exhibit strong growth. North America leads in market share due to its advanced healthcare infrastructure and high adoption of innovative technologies. However, the Asia-Pacific region is anticipated to witness substantial growth, propelled by increasing healthcare expenditure, rising awareness of advanced diagnostics, and developing healthcare infrastructure in emerging economies. The competitive landscape features major players like Siemens Healthcare, GE Healthcare, and Philips, who are actively pursuing product innovation, mergers, acquisitions, and strategic partnerships to strengthen their global presence. Potential market restraints include high initial investment costs for advanced visualization tools, particularly for smaller healthcare providers, and the demand for skilled professionals. However, these challenges are expected to be mitigated by ongoing technological advancements, decreasing equipment costs, and expanding training initiatives.
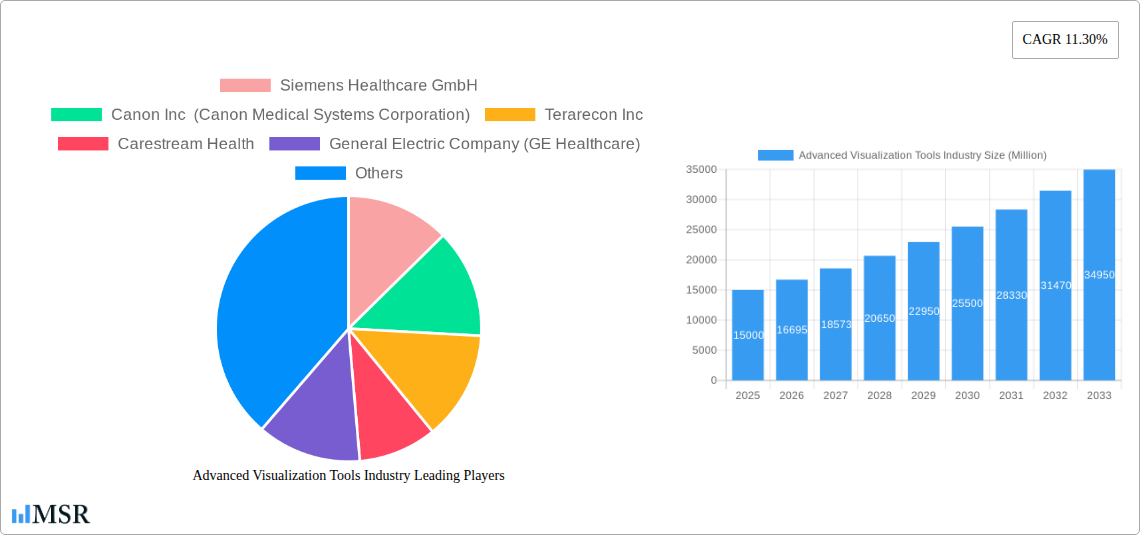
Advanced Visualization Tools Industry Company Market Share
Advanced Visualization Tools Industry Report: 2019-2033
This comprehensive report provides an in-depth analysis of the Advanced Visualization Tools industry, covering market dynamics, key segments, leading players, and future growth opportunities. With a study period spanning 2019-2033, a base year of 2025, and a forecast period of 2025-2033, this report offers invaluable insights for stakeholders seeking to navigate this rapidly evolving market. The global market size is estimated at $XX Million in 2025 and is projected to reach $XX Million by 2033, exhibiting a CAGR of XX%.
Advanced Visualization Tools Industry Market Concentration & Dynamics
The Advanced Visualization Tools market exhibits a moderately concentrated landscape, with a handful of major players holding significant market share. Siemens Healthcare GmbH, General Electric Company (GE Healthcare), and Koninklijke Philips NV are among the leading companies, each commanding a substantial portion of the market. However, smaller, specialized firms are also contributing significantly through innovation and niche applications. The industry's dynamics are shaped by several factors:
- Market Share: The top three players collectively hold approximately XX% of the global market share in 2025, while smaller players contribute the remaining XX%. This distribution is expected to evolve with increased competition and consolidation.
- Innovation Ecosystems: The market is characterized by a vibrant innovation ecosystem driven by both established players and emerging startups. Continuous advancements in imaging technologies, AI integration, and cloud computing are shaping product development.
- Regulatory Frameworks: Stringent regulatory approvals and compliance requirements, particularly in medical imaging, influence market entry and product development strategies. Changes in regulatory landscapes across different regions impact market growth.
- Substitute Products: While advanced visualization tools are largely irreplaceable in many clinical applications, alternative diagnostic methods and techniques represent potential competitive pressures. The industry is adapting by integrating these technologies into its offerings.
- End-User Trends: The increasing demand for precise diagnosis, minimally invasive procedures, and personalized medicine fuels growth in the advanced visualization tools market. The focus is shifting towards improved image quality, faster processing, and user-friendly interfaces.
- M&A Activities: The industry has witnessed a moderate level of mergers and acquisitions (M&A) activity in recent years. Around XX M&A deals were recorded in the historical period (2019-2024), primarily focused on expanding product portfolios, enhancing technological capabilities, and entering new markets.
Advanced Visualization Tools Industry Industry Insights & Trends
The Advanced Visualization Tools industry is experiencing robust growth driven by several factors. The increasing prevalence of chronic diseases, the growing demand for minimally invasive procedures, and advancements in imaging technologies are key growth catalysts. The market's expansion is further fueled by rising healthcare expenditure, technological disruptions, and evolving consumer behaviors.
The integration of artificial intelligence (AI) and machine learning (ML) into medical imaging analysis is transforming diagnostic accuracy and efficiency. Cloud-based solutions are gaining traction, enabling improved collaboration, data storage, and remote access to images. This shift towards digitalization is improving operational efficiency and workflow optimization within healthcare facilities. Consumer preferences are increasingly focused on personalized and targeted treatments, requiring sophisticated imaging tools to provide precise diagnosis and guide therapy.
Key Markets & Segments Leading Advanced Visualization Tools Industry
The global advanced visualization tools market is segmented by imaging modality, clinical application, product and service, and type of solution. Significant regional variations exist in market growth and adoption rates.
Dominant Segments:
- Imaging Modality: Computed Tomography (CT) and Magnetic Resonance Imaging (MRI) currently dominate the market due to their wide applicability across various clinical areas. However, Ultrasound and Nuclear Medicine segments are showing strong growth potential.
- Clinical Application: Oncology, Cardiovascular, and Orthopedics are the leading clinical applications driving market expansion. The high prevalence of these conditions and the need for precise diagnosis contribute to segment dominance.
Drivers:
- Economic Growth: Increased healthcare spending in developed and emerging economies is fueling market expansion.
- Technological Advancements: Continuous innovation in imaging technology and software enhances image quality, accuracy, and processing speed.
- Favorable Government Initiatives: Government programs promoting healthcare infrastructure development and disease prevention drive adoption.
- Improved Healthcare Infrastructure: The development and expansion of healthcare facilities in regions with high disease burden increase the demand for advanced visualization tools.
Detailed analysis reveals that North America holds the largest market share, followed by Europe and Asia Pacific. The dominance of North America is attributed to the presence of advanced healthcare infrastructure, high healthcare expenditure, and early adoption of new technologies. However, rapidly developing healthcare systems in Asia-Pacific indicate significant growth potential in this region in the coming years.
Advanced Visualization Tools Industry Product Developments
Recent product developments focus on enhancing image quality, speed, and user-friendliness. Integration of AI and ML algorithms for automated image analysis and disease detection is a key trend. Cloud-based solutions are gaining prominence, offering improved accessibility, collaboration, and data management capabilities. Miniaturization of devices and development of portable systems are expanding the reach of advanced visualization tools to underserved areas. Competition is fierce, pushing manufacturers to continuously innovate and improve their offerings to gain a competitive edge in the market.
Challenges in the Advanced Visualization Tools Industry Market
The Advanced Visualization Tools industry faces several challenges:
- High Cost of Equipment and Maintenance: The initial investment required for advanced imaging systems can be substantial, posing a barrier to entry for smaller healthcare providers.
- Regulatory Hurdles: Strict regulatory requirements and lengthy approval processes can delay product launches and limit market penetration.
- Complex Data Management: Managing large volumes of medical images and data requires robust infrastructure and sophisticated software, posing a challenge for smaller players.
- Intense Competition: The market is highly competitive, with established players and emerging companies vying for market share. This pressure is likely to continue and might lead to price wars. This leads to price wars reducing the profitability of the industry.
Forces Driving Advanced Visualization Tools Industry Growth
Several factors are driving the growth of the Advanced Visualization Tools industry:
- Technological Advancements: Continuous improvements in imaging technology, including AI integration and cloud computing, are leading to better image quality, faster processing, and enhanced diagnostic capabilities.
- Rising Healthcare Expenditure: Increased healthcare spending globally is fueling investment in advanced medical equipment, including visualization tools.
- Growing Prevalence of Chronic Diseases: The increasing incidence of chronic diseases such as cancer and cardiovascular disease is creating higher demand for accurate diagnostic tools.
- Government Initiatives: Government programs promoting healthcare infrastructure development and disease prevention create a supportive environment for market growth.
Long-Term Growth Catalysts in the Advanced Visualization Tools Industry
Long-term growth in the Advanced Visualization Tools industry will be driven by continued technological innovation, strategic partnerships, and market expansion. The development of new imaging modalities, AI-powered diagnostic tools, and personalized medicine applications will open up new opportunities for growth. Collaboration between technology providers and healthcare institutions will accelerate the adoption of new technologies and improve patient care. Expansion into emerging markets with growing healthcare infrastructure will contribute to substantial market growth.
Emerging Opportunities in Advanced Visualization Tools Industry
Emerging opportunities include:
- Artificial Intelligence (AI) and Machine Learning (ML): AI-powered diagnostic tools are enhancing image analysis, improving diagnostic accuracy, and accelerating workflow.
- Cloud-Based Solutions: Cloud-based platforms are enabling remote access, data sharing, and improved collaboration among healthcare professionals.
- Personalized Medicine: Advanced visualization tools play a vital role in tailoring treatments to individual patient needs, driving personalized care and precision medicine.
- Expansion into Emerging Markets: Rapidly developing healthcare systems in emerging economies present lucrative growth opportunities.
Leading Players in the Advanced Visualization Tools Industry Sector
- Siemens Healthcare GmbH
- Canon Inc (Canon Medical Systems Corporation)
- Terarecon Inc
- Carestream Health
- General Electric Company (GE Healthcare)
- Koninklijke Philips NV
- Pro Medicus Ltd
- Agfa-Gevaert Group
- Fujifilm Holdings Corporation
Key Milestones in Advanced Visualization Tools Industry Industry
- August 2022: Kitware launched MIQA, a cloud-based application for medical image quality assurance, improving collaboration and longitudinal studies.
- February 2022: Siemens Healthineers and Universal Medical Imaging partnered to enhance primary healthcare image screening and diagnosis in China, leveraging advanced equipment and remote assistant tools.
Strategic Outlook for Advanced Visualization Tools Industry Market
The Advanced Visualization Tools market is poised for significant growth over the forecast period. Continued technological innovation, expansion into new markets, and strategic partnerships will drive market expansion. Companies focusing on AI integration, cloud-based solutions, and personalized medicine applications are expected to gain a competitive edge. The long-term outlook remains positive, driven by growing healthcare expenditure, rising prevalence of chronic diseases, and the increasing demand for accurate and efficient diagnostic tools.
Advanced Visualization Tools Industry Segmentation
-
1. Product and Service
- 1.1. Hardware
- 1.2. Software
- 1.3. Services
-
2. Type of Solution
- 2.1. Enterprise
- 2.2. Standalone
-
3. Imaging Modality
- 3.1. Magnetic Resonance Imaging (MRI)
- 3.2. Computed Tomography (CT)
- 3.3. Ultrasound
- 3.4. Nuclear Medicine
- 3.5. Other Imaging Modalities
-
4. Clinical Application
- 4.1. Oncology
- 4.2. Orthopedics
- 4.3. Cardiovascular
- 4.4. Neurology
- 4.5. Other Clinical Applications
Advanced Visualization Tools Industry Segmentation By Geography
-
1. North America
- 1.1. United States
- 1.2. Canada
- 1.3. Mexico
-
2. Europe
- 2.1. Germany
- 2.2. United Kingdom
- 2.3. France
- 2.4. Italy
- 2.5. Spain
- 2.6. Rest of Europe
-
3. Asia Pacific
- 3.1. China
- 3.2. Japan
- 3.3. India
- 3.4. Australia
- 3.5. South Korea
- 3.6. Rest of Asia Pacific
-
4. Middle East and Africa
- 4.1. GCC
- 4.2. South Africa
- 4.3. Rest of Middle East and Africa
-
5. South America
- 5.1. Brazil
- 5.2. Argentina
- 5.3. Rest of South America
Advanced Visualization Tools Industry Regional Market Share
Geographic Coverage of Advanced Visualization Tools Industry
Advanced Visualization Tools Industry REPORT HIGHLIGHTS
| Aspects | Details |
|---|---|
| Study Period | 2020-2034 |
| Base Year | 2025 |
| Estimated Year | 2026 |
| Forecast Period | 2026-2034 |
| Historical Period | 2020-2025 |
| Growth Rate | CAGR of 13.8% from 2020-2034 |
| Segmentation |
|
Table of Contents
- 1. Introduction
- 1.1. Research Scope
- 1.2. Market Segmentation
- 1.3. Research Objective
- 1.4. Definitions and Assumptions
- 2. Executive Summary
- 2.1. Market Snapshot
- 3. Market Dynamics
- 3.1. Market Drivers
- 3.2. Market Restrains
- 3.3. Market Trends
- 3.4. Market Opportunities
- 4. Market Factor Analysis
- 4.1. Porters Five Forces
- 4.1.1. Bargaining Power of Suppliers
- 4.1.2. Bargaining Power of Buyers
- 4.1.3. Threat of New Entrants
- 4.1.4. Threat of Substitutes
- 4.1.5. Competitive Rivalry
- 4.2. PESTEL analysis
- 4.3. BCG Analysis
- 4.3.1. Stars (High Growth, High Market Share)
- 4.3.2. Cash Cows (Low Growth, High Market Share)
- 4.3.3. Question Mark (High Growth, Low Market Share)
- 4.3.4. Dogs (Low Growth, Low Market Share)
- 4.4. Ansoff Matrix Analysis
- 4.5. Supply Chain Analysis
- 4.6. Regulatory Landscape
- 4.7. Current Market Potential and Opportunity Assessment (TAM–SAM–SOM Framework)
- 4.8. MSR Analyst Note
- 4.1. Porters Five Forces
- 5. Market Analysis, Insights and Forecast 2021-2033
- 5.1. Market Analysis, Insights and Forecast - by Product and Service
- 5.1.1. Hardware
- 5.1.2. Software
- 5.1.3. Services
- 5.2. Market Analysis, Insights and Forecast - by Type of Solution
- 5.2.1. Enterprise
- 5.2.2. Standalone
- 5.3. Market Analysis, Insights and Forecast - by Imaging Modality
- 5.3.1. Magnetic Resonance Imaging (MRI)
- 5.3.2. Computed Tomography (CT)
- 5.3.3. Ultrasound
- 5.3.4. Nuclear Medicine
- 5.3.5. Other Imaging Modalities
- 5.4. Market Analysis, Insights and Forecast - by Clinical Application
- 5.4.1. Oncology
- 5.4.2. Orthopedics
- 5.4.3. Cardiovascular
- 5.4.4. Neurology
- 5.4.5. Other Clinical Applications
- 5.5. Market Analysis, Insights and Forecast - by Region
- 5.5.1. North America
- 5.5.2. Europe
- 5.5.3. Asia Pacific
- 5.5.4. Middle East and Africa
- 5.5.5. South America
- 5.1. Market Analysis, Insights and Forecast - by Product and Service
- 6. Global Advanced Visualization Tools Industry Analysis, Insights and Forecast, 2021-2033
- 6.1. Market Analysis, Insights and Forecast - by Product and Service
- 6.1.1. Hardware
- 6.1.2. Software
- 6.1.3. Services
- 6.2. Market Analysis, Insights and Forecast - by Type of Solution
- 6.2.1. Enterprise
- 6.2.2. Standalone
- 6.3. Market Analysis, Insights and Forecast - by Imaging Modality
- 6.3.1. Magnetic Resonance Imaging (MRI)
- 6.3.2. Computed Tomography (CT)
- 6.3.3. Ultrasound
- 6.3.4. Nuclear Medicine
- 6.3.5. Other Imaging Modalities
- 6.4. Market Analysis, Insights and Forecast - by Clinical Application
- 6.4.1. Oncology
- 6.4.2. Orthopedics
- 6.4.3. Cardiovascular
- 6.4.4. Neurology
- 6.4.5. Other Clinical Applications
- 6.1. Market Analysis, Insights and Forecast - by Product and Service
- 7. North America Advanced Visualization Tools Industry Analysis, Insights and Forecast, 2020-2032
- 7.1. Market Analysis, Insights and Forecast - by Product and Service
- 7.1.1. Hardware
- 7.1.2. Software
- 7.1.3. Services
- 7.2. Market Analysis, Insights and Forecast - by Type of Solution
- 7.2.1. Enterprise
- 7.2.2. Standalone
- 7.3. Market Analysis, Insights and Forecast - by Imaging Modality
- 7.3.1. Magnetic Resonance Imaging (MRI)
- 7.3.2. Computed Tomography (CT)
- 7.3.3. Ultrasound
- 7.3.4. Nuclear Medicine
- 7.3.5. Other Imaging Modalities
- 7.4. Market Analysis, Insights and Forecast - by Clinical Application
- 7.4.1. Oncology
- 7.4.2. Orthopedics
- 7.4.3. Cardiovascular
- 7.4.4. Neurology
- 7.4.5. Other Clinical Applications
- 7.1. Market Analysis, Insights and Forecast - by Product and Service
- 8. Europe Advanced Visualization Tools Industry Analysis, Insights and Forecast, 2020-2032
- 8.1. Market Analysis, Insights and Forecast - by Product and Service
- 8.1.1. Hardware
- 8.1.2. Software
- 8.1.3. Services
- 8.2. Market Analysis, Insights and Forecast - by Type of Solution
- 8.2.1. Enterprise
- 8.2.2. Standalone
- 8.3. Market Analysis, Insights and Forecast - by Imaging Modality
- 8.3.1. Magnetic Resonance Imaging (MRI)
- 8.3.2. Computed Tomography (CT)
- 8.3.3. Ultrasound
- 8.3.4. Nuclear Medicine
- 8.3.5. Other Imaging Modalities
- 8.4. Market Analysis, Insights and Forecast - by Clinical Application
- 8.4.1. Oncology
- 8.4.2. Orthopedics
- 8.4.3. Cardiovascular
- 8.4.4. Neurology
- 8.4.5. Other Clinical Applications
- 8.1. Market Analysis, Insights and Forecast - by Product and Service
- 9. Asia Pacific Advanced Visualization Tools Industry Analysis, Insights and Forecast, 2020-2032
- 9.1. Market Analysis, Insights and Forecast - by Product and Service
- 9.1.1. Hardware
- 9.1.2. Software
- 9.1.3. Services
- 9.2. Market Analysis, Insights and Forecast - by Type of Solution
- 9.2.1. Enterprise
- 9.2.2. Standalone
- 9.3. Market Analysis, Insights and Forecast - by Imaging Modality
- 9.3.1. Magnetic Resonance Imaging (MRI)
- 9.3.2. Computed Tomography (CT)
- 9.3.3. Ultrasound
- 9.3.4. Nuclear Medicine
- 9.3.5. Other Imaging Modalities
- 9.4. Market Analysis, Insights and Forecast - by Clinical Application
- 9.4.1. Oncology
- 9.4.2. Orthopedics
- 9.4.3. Cardiovascular
- 9.4.4. Neurology
- 9.4.5. Other Clinical Applications
- 9.1. Market Analysis, Insights and Forecast - by Product and Service
- 10. Middle East and Africa Advanced Visualization Tools Industry Analysis, Insights and Forecast, 2020-2032
- 10.1. Market Analysis, Insights and Forecast - by Product and Service
- 10.1.1. Hardware
- 10.1.2. Software
- 10.1.3. Services
- 10.2. Market Analysis, Insights and Forecast - by Type of Solution
- 10.2.1. Enterprise
- 10.2.2. Standalone
- 10.3. Market Analysis, Insights and Forecast - by Imaging Modality
- 10.3.1. Magnetic Resonance Imaging (MRI)
- 10.3.2. Computed Tomography (CT)
- 10.3.3. Ultrasound
- 10.3.4. Nuclear Medicine
- 10.3.5. Other Imaging Modalities
- 10.4. Market Analysis, Insights and Forecast - by Clinical Application
- 10.4.1. Oncology
- 10.4.2. Orthopedics
- 10.4.3. Cardiovascular
- 10.4.4. Neurology
- 10.4.5. Other Clinical Applications
- 10.1. Market Analysis, Insights and Forecast - by Product and Service
- 11. South America Advanced Visualization Tools Industry Analysis, Insights and Forecast, 2020-2032
- 11.1. Market Analysis, Insights and Forecast - by Product and Service
- 11.1.1. Hardware
- 11.1.2. Software
- 11.1.3. Services
- 11.2. Market Analysis, Insights and Forecast - by Type of Solution
- 11.2.1. Enterprise
- 11.2.2. Standalone
- 11.3. Market Analysis, Insights and Forecast - by Imaging Modality
- 11.3.1. Magnetic Resonance Imaging (MRI)
- 11.3.2. Computed Tomography (CT)
- 11.3.3. Ultrasound
- 11.3.4. Nuclear Medicine
- 11.3.5. Other Imaging Modalities
- 11.4. Market Analysis, Insights and Forecast - by Clinical Application
- 11.4.1. Oncology
- 11.4.2. Orthopedics
- 11.4.3. Cardiovascular
- 11.4.4. Neurology
- 11.4.5. Other Clinical Applications
- 11.1. Market Analysis, Insights and Forecast - by Product and Service
- 12. Competitive Analysis
- 12.1. Company Profiles
- 12.1.1 Siemens Healthcare GmbH
- 12.1.1.1. Company Overview
- 12.1.1.2. Products
- 12.1.1.3. Company Financials
- 12.1.1.4. SWOT Analysis
- 12.1.2 Canon Inc (Canon Medical Systems Corporation)
- 12.1.2.1. Company Overview
- 12.1.2.2. Products
- 12.1.2.3. Company Financials
- 12.1.2.4. SWOT Analysis
- 12.1.3 Terarecon Inc
- 12.1.3.1. Company Overview
- 12.1.3.2. Products
- 12.1.3.3. Company Financials
- 12.1.3.4. SWOT Analysis
- 12.1.4 Carestream Health
- 12.1.4.1. Company Overview
- 12.1.4.2. Products
- 12.1.4.3. Company Financials
- 12.1.4.4. SWOT Analysis
- 12.1.5 General Electric Company (GE Healthcare)
- 12.1.5.1. Company Overview
- 12.1.5.2. Products
- 12.1.5.3. Company Financials
- 12.1.5.4. SWOT Analysis
- 12.1.6 Koninklijke Philips NV
- 12.1.6.1. Company Overview
- 12.1.6.2. Products
- 12.1.6.3. Company Financials
- 12.1.6.4. SWOT Analysis
- 12.1.7 Pro Medicus Ltd
- 12.1.7.1. Company Overview
- 12.1.7.2. Products
- 12.1.7.3. Company Financials
- 12.1.7.4. SWOT Analysis
- 12.1.8 Agfa-Gevaert Group
- 12.1.8.1. Company Overview
- 12.1.8.2. Products
- 12.1.8.3. Company Financials
- 12.1.8.4. SWOT Analysis
- 12.1.9 Fujifilm Holdings Corporation
- 12.1.9.1. Company Overview
- 12.1.9.2. Products
- 12.1.9.3. Company Financials
- 12.1.9.4. SWOT Analysis
- 12.1.1 Siemens Healthcare GmbH
- 12.2. Market Entropy
- 12.2.1 Company's Key Areas Served
- 12.2.2 Recent Developments
- 12.3. Company Market Share Analysis 2025
- 12.3.1 Top 5 Companies Market Share Analysis
- 12.3.2 Top 3 Companies Market Share Analysis
- 12.4. List of Potential Customers
- 13. Research Methodology
List of Figures
- Figure 1: Global Advanced Visualization Tools Industry Revenue Breakdown (billion, %) by Region 2025 & 2033
- Figure 2: Global Advanced Visualization Tools Industry Volume Breakdown (K Unit, %) by Region 2025 & 2033
- Figure 3: North America Advanced Visualization Tools Industry Revenue (billion), by Product and Service 2025 & 2033
- Figure 4: North America Advanced Visualization Tools Industry Volume (K Unit), by Product and Service 2025 & 2033
- Figure 5: North America Advanced Visualization Tools Industry Revenue Share (%), by Product and Service 2025 & 2033
- Figure 6: North America Advanced Visualization Tools Industry Volume Share (%), by Product and Service 2025 & 2033
- Figure 7: North America Advanced Visualization Tools Industry Revenue (billion), by Type of Solution 2025 & 2033
- Figure 8: North America Advanced Visualization Tools Industry Volume (K Unit), by Type of Solution 2025 & 2033
- Figure 9: North America Advanced Visualization Tools Industry Revenue Share (%), by Type of Solution 2025 & 2033
- Figure 10: North America Advanced Visualization Tools Industry Volume Share (%), by Type of Solution 2025 & 2033
- Figure 11: North America Advanced Visualization Tools Industry Revenue (billion), by Imaging Modality 2025 & 2033
- Figure 12: North America Advanced Visualization Tools Industry Volume (K Unit), by Imaging Modality 2025 & 2033
- Figure 13: North America Advanced Visualization Tools Industry Revenue Share (%), by Imaging Modality 2025 & 2033
- Figure 14: North America Advanced Visualization Tools Industry Volume Share (%), by Imaging Modality 2025 & 2033
- Figure 15: North America Advanced Visualization Tools Industry Revenue (billion), by Clinical Application 2025 & 2033
- Figure 16: North America Advanced Visualization Tools Industry Volume (K Unit), by Clinical Application 2025 & 2033
- Figure 17: North America Advanced Visualization Tools Industry Revenue Share (%), by Clinical Application 2025 & 2033
- Figure 18: North America Advanced Visualization Tools Industry Volume Share (%), by Clinical Application 2025 & 2033
- Figure 19: North America Advanced Visualization Tools Industry Revenue (billion), by Country 2025 & 2033
- Figure 20: North America Advanced Visualization Tools Industry Volume (K Unit), by Country 2025 & 2033
- Figure 21: North America Advanced Visualization Tools Industry Revenue Share (%), by Country 2025 & 2033
- Figure 22: North America Advanced Visualization Tools Industry Volume Share (%), by Country 2025 & 2033
- Figure 23: Europe Advanced Visualization Tools Industry Revenue (billion), by Product and Service 2025 & 2033
- Figure 24: Europe Advanced Visualization Tools Industry Volume (K Unit), by Product and Service 2025 & 2033
- Figure 25: Europe Advanced Visualization Tools Industry Revenue Share (%), by Product and Service 2025 & 2033
- Figure 26: Europe Advanced Visualization Tools Industry Volume Share (%), by Product and Service 2025 & 2033
- Figure 27: Europe Advanced Visualization Tools Industry Revenue (billion), by Type of Solution 2025 & 2033
- Figure 28: Europe Advanced Visualization Tools Industry Volume (K Unit), by Type of Solution 2025 & 2033
- Figure 29: Europe Advanced Visualization Tools Industry Revenue Share (%), by Type of Solution 2025 & 2033
- Figure 30: Europe Advanced Visualization Tools Industry Volume Share (%), by Type of Solution 2025 & 2033
- Figure 31: Europe Advanced Visualization Tools Industry Revenue (billion), by Imaging Modality 2025 & 2033
- Figure 32: Europe Advanced Visualization Tools Industry Volume (K Unit), by Imaging Modality 2025 & 2033
- Figure 33: Europe Advanced Visualization Tools Industry Revenue Share (%), by Imaging Modality 2025 & 2033
- Figure 34: Europe Advanced Visualization Tools Industry Volume Share (%), by Imaging Modality 2025 & 2033
- Figure 35: Europe Advanced Visualization Tools Industry Revenue (billion), by Clinical Application 2025 & 2033
- Figure 36: Europe Advanced Visualization Tools Industry Volume (K Unit), by Clinical Application 2025 & 2033
- Figure 37: Europe Advanced Visualization Tools Industry Revenue Share (%), by Clinical Application 2025 & 2033
- Figure 38: Europe Advanced Visualization Tools Industry Volume Share (%), by Clinical Application 2025 & 2033
- Figure 39: Europe Advanced Visualization Tools Industry Revenue (billion), by Country 2025 & 2033
- Figure 40: Europe Advanced Visualization Tools Industry Volume (K Unit), by Country 2025 & 2033
- Figure 41: Europe Advanced Visualization Tools Industry Revenue Share (%), by Country 2025 & 2033
- Figure 42: Europe Advanced Visualization Tools Industry Volume Share (%), by Country 2025 & 2033
- Figure 43: Asia Pacific Advanced Visualization Tools Industry Revenue (billion), by Product and Service 2025 & 2033
- Figure 44: Asia Pacific Advanced Visualization Tools Industry Volume (K Unit), by Product and Service 2025 & 2033
- Figure 45: Asia Pacific Advanced Visualization Tools Industry Revenue Share (%), by Product and Service 2025 & 2033
- Figure 46: Asia Pacific Advanced Visualization Tools Industry Volume Share (%), by Product and Service 2025 & 2033
- Figure 47: Asia Pacific Advanced Visualization Tools Industry Revenue (billion), by Type of Solution 2025 & 2033
- Figure 48: Asia Pacific Advanced Visualization Tools Industry Volume (K Unit), by Type of Solution 2025 & 2033
- Figure 49: Asia Pacific Advanced Visualization Tools Industry Revenue Share (%), by Type of Solution 2025 & 2033
- Figure 50: Asia Pacific Advanced Visualization Tools Industry Volume Share (%), by Type of Solution 2025 & 2033
- Figure 51: Asia Pacific Advanced Visualization Tools Industry Revenue (billion), by Imaging Modality 2025 & 2033
- Figure 52: Asia Pacific Advanced Visualization Tools Industry Volume (K Unit), by Imaging Modality 2025 & 2033
- Figure 53: Asia Pacific Advanced Visualization Tools Industry Revenue Share (%), by Imaging Modality 2025 & 2033
- Figure 54: Asia Pacific Advanced Visualization Tools Industry Volume Share (%), by Imaging Modality 2025 & 2033
- Figure 55: Asia Pacific Advanced Visualization Tools Industry Revenue (billion), by Clinical Application 2025 & 2033
- Figure 56: Asia Pacific Advanced Visualization Tools Industry Volume (K Unit), by Clinical Application 2025 & 2033
- Figure 57: Asia Pacific Advanced Visualization Tools Industry Revenue Share (%), by Clinical Application 2025 & 2033
- Figure 58: Asia Pacific Advanced Visualization Tools Industry Volume Share (%), by Clinical Application 2025 & 2033
- Figure 59: Asia Pacific Advanced Visualization Tools Industry Revenue (billion), by Country 2025 & 2033
- Figure 60: Asia Pacific Advanced Visualization Tools Industry Volume (K Unit), by Country 2025 & 2033
- Figure 61: Asia Pacific Advanced Visualization Tools Industry Revenue Share (%), by Country 2025 & 2033
- Figure 62: Asia Pacific Advanced Visualization Tools Industry Volume Share (%), by Country 2025 & 2033
- Figure 63: Middle East and Africa Advanced Visualization Tools Industry Revenue (billion), by Product and Service 2025 & 2033
- Figure 64: Middle East and Africa Advanced Visualization Tools Industry Volume (K Unit), by Product and Service 2025 & 2033
- Figure 65: Middle East and Africa Advanced Visualization Tools Industry Revenue Share (%), by Product and Service 2025 & 2033
- Figure 66: Middle East and Africa Advanced Visualization Tools Industry Volume Share (%), by Product and Service 2025 & 2033
- Figure 67: Middle East and Africa Advanced Visualization Tools Industry Revenue (billion), by Type of Solution 2025 & 2033
- Figure 68: Middle East and Africa Advanced Visualization Tools Industry Volume (K Unit), by Type of Solution 2025 & 2033
- Figure 69: Middle East and Africa Advanced Visualization Tools Industry Revenue Share (%), by Type of Solution 2025 & 2033
- Figure 70: Middle East and Africa Advanced Visualization Tools Industry Volume Share (%), by Type of Solution 2025 & 2033
- Figure 71: Middle East and Africa Advanced Visualization Tools Industry Revenue (billion), by Imaging Modality 2025 & 2033
- Figure 72: Middle East and Africa Advanced Visualization Tools Industry Volume (K Unit), by Imaging Modality 2025 & 2033
- Figure 73: Middle East and Africa Advanced Visualization Tools Industry Revenue Share (%), by Imaging Modality 2025 & 2033
- Figure 74: Middle East and Africa Advanced Visualization Tools Industry Volume Share (%), by Imaging Modality 2025 & 2033
- Figure 75: Middle East and Africa Advanced Visualization Tools Industry Revenue (billion), by Clinical Application 2025 & 2033
- Figure 76: Middle East and Africa Advanced Visualization Tools Industry Volume (K Unit), by Clinical Application 2025 & 2033
- Figure 77: Middle East and Africa Advanced Visualization Tools Industry Revenue Share (%), by Clinical Application 2025 & 2033
- Figure 78: Middle East and Africa Advanced Visualization Tools Industry Volume Share (%), by Clinical Application 2025 & 2033
- Figure 79: Middle East and Africa Advanced Visualization Tools Industry Revenue (billion), by Country 2025 & 2033
- Figure 80: Middle East and Africa Advanced Visualization Tools Industry Volume (K Unit), by Country 2025 & 2033
- Figure 81: Middle East and Africa Advanced Visualization Tools Industry Revenue Share (%), by Country 2025 & 2033
- Figure 82: Middle East and Africa Advanced Visualization Tools Industry Volume Share (%), by Country 2025 & 2033
- Figure 83: South America Advanced Visualization Tools Industry Revenue (billion), by Product and Service 2025 & 2033
- Figure 84: South America Advanced Visualization Tools Industry Volume (K Unit), by Product and Service 2025 & 2033
- Figure 85: South America Advanced Visualization Tools Industry Revenue Share (%), by Product and Service 2025 & 2033
- Figure 86: South America Advanced Visualization Tools Industry Volume Share (%), by Product and Service 2025 & 2033
- Figure 87: South America Advanced Visualization Tools Industry Revenue (billion), by Type of Solution 2025 & 2033
- Figure 88: South America Advanced Visualization Tools Industry Volume (K Unit), by Type of Solution 2025 & 2033
- Figure 89: South America Advanced Visualization Tools Industry Revenue Share (%), by Type of Solution 2025 & 2033
- Figure 90: South America Advanced Visualization Tools Industry Volume Share (%), by Type of Solution 2025 & 2033
- Figure 91: South America Advanced Visualization Tools Industry Revenue (billion), by Imaging Modality 2025 & 2033
- Figure 92: South America Advanced Visualization Tools Industry Volume (K Unit), by Imaging Modality 2025 & 2033
- Figure 93: South America Advanced Visualization Tools Industry Revenue Share (%), by Imaging Modality 2025 & 2033
- Figure 94: South America Advanced Visualization Tools Industry Volume Share (%), by Imaging Modality 2025 & 2033
- Figure 95: South America Advanced Visualization Tools Industry Revenue (billion), by Clinical Application 2025 & 2033
- Figure 96: South America Advanced Visualization Tools Industry Volume (K Unit), by Clinical Application 2025 & 2033
- Figure 97: South America Advanced Visualization Tools Industry Revenue Share (%), by Clinical Application 2025 & 2033
- Figure 98: South America Advanced Visualization Tools Industry Volume Share (%), by Clinical Application 2025 & 2033
- Figure 99: South America Advanced Visualization Tools Industry Revenue (billion), by Country 2025 & 2033
- Figure 100: South America Advanced Visualization Tools Industry Volume (K Unit), by Country 2025 & 2033
- Figure 101: South America Advanced Visualization Tools Industry Revenue Share (%), by Country 2025 & 2033
- Figure 102: South America Advanced Visualization Tools Industry Volume Share (%), by Country 2025 & 2033
List of Tables
- Table 1: Global Advanced Visualization Tools Industry Revenue billion Forecast, by Product and Service 2020 & 2033
- Table 2: Global Advanced Visualization Tools Industry Volume K Unit Forecast, by Product and Service 2020 & 2033
- Table 3: Global Advanced Visualization Tools Industry Revenue billion Forecast, by Type of Solution 2020 & 2033
- Table 4: Global Advanced Visualization Tools Industry Volume K Unit Forecast, by Type of Solution 2020 & 2033
- Table 5: Global Advanced Visualization Tools Industry Revenue billion Forecast, by Imaging Modality 2020 & 2033
- Table 6: Global Advanced Visualization Tools Industry Volume K Unit Forecast, by Imaging Modality 2020 & 2033
- Table 7: Global Advanced Visualization Tools Industry Revenue billion Forecast, by Clinical Application 2020 & 2033
- Table 8: Global Advanced Visualization Tools Industry Volume K Unit Forecast, by Clinical Application 2020 & 2033
- Table 9: Global Advanced Visualization Tools Industry Revenue billion Forecast, by Region 2020 & 2033
- Table 10: Global Advanced Visualization Tools Industry Volume K Unit Forecast, by Region 2020 & 2033
- Table 11: Global Advanced Visualization Tools Industry Revenue billion Forecast, by Product and Service 2020 & 2033
- Table 12: Global Advanced Visualization Tools Industry Volume K Unit Forecast, by Product and Service 2020 & 2033
- Table 13: Global Advanced Visualization Tools Industry Revenue billion Forecast, by Type of Solution 2020 & 2033
- Table 14: Global Advanced Visualization Tools Industry Volume K Unit Forecast, by Type of Solution 2020 & 2033
- Table 15: Global Advanced Visualization Tools Industry Revenue billion Forecast, by Imaging Modality 2020 & 2033
- Table 16: Global Advanced Visualization Tools Industry Volume K Unit Forecast, by Imaging Modality 2020 & 2033
- Table 17: Global Advanced Visualization Tools Industry Revenue billion Forecast, by Clinical Application 2020 & 2033
- Table 18: Global Advanced Visualization Tools Industry Volume K Unit Forecast, by Clinical Application 2020 & 2033
- Table 19: Global Advanced Visualization Tools Industry Revenue billion Forecast, by Country 2020 & 2033
- Table 20: Global Advanced Visualization Tools Industry Volume K Unit Forecast, by Country 2020 & 2033
- Table 21: United States Advanced Visualization Tools Industry Revenue (billion) Forecast, by Application 2020 & 2033
- Table 22: United States Advanced Visualization Tools Industry Volume (K Unit) Forecast, by Application 2020 & 2033
- Table 23: Canada Advanced Visualization Tools Industry Revenue (billion) Forecast, by Application 2020 & 2033
- Table 24: Canada Advanced Visualization Tools Industry Volume (K Unit) Forecast, by Application 2020 & 2033
- Table 25: Mexico Advanced Visualization Tools Industry Revenue (billion) Forecast, by Application 2020 & 2033
- Table 26: Mexico Advanced Visualization Tools Industry Volume (K Unit) Forecast, by Application 2020 & 2033
- Table 27: Global Advanced Visualization Tools Industry Revenue billion Forecast, by Product and Service 2020 & 2033
- Table 28: Global Advanced Visualization Tools Industry Volume K Unit Forecast, by Product and Service 2020 & 2033
- Table 29: Global Advanced Visualization Tools Industry Revenue billion Forecast, by Type of Solution 2020 & 2033
- Table 30: Global Advanced Visualization Tools Industry Volume K Unit Forecast, by Type of Solution 2020 & 2033
- Table 31: Global Advanced Visualization Tools Industry Revenue billion Forecast, by Imaging Modality 2020 & 2033
- Table 32: Global Advanced Visualization Tools Industry Volume K Unit Forecast, by Imaging Modality 2020 & 2033
- Table 33: Global Advanced Visualization Tools Industry Revenue billion Forecast, by Clinical Application 2020 & 2033
- Table 34: Global Advanced Visualization Tools Industry Volume K Unit Forecast, by Clinical Application 2020 & 2033
- Table 35: Global Advanced Visualization Tools Industry Revenue billion Forecast, by Country 2020 & 2033
- Table 36: Global Advanced Visualization Tools Industry Volume K Unit Forecast, by Country 2020 & 2033
- Table 37: Germany Advanced Visualization Tools Industry Revenue (billion) Forecast, by Application 2020 & 2033
- Table 38: Germany Advanced Visualization Tools Industry Volume (K Unit) Forecast, by Application 2020 & 2033
- Table 39: United Kingdom Advanced Visualization Tools Industry Revenue (billion) Forecast, by Application 2020 & 2033
- Table 40: United Kingdom Advanced Visualization Tools Industry Volume (K Unit) Forecast, by Application 2020 & 2033
- Table 41: France Advanced Visualization Tools Industry Revenue (billion) Forecast, by Application 2020 & 2033
- Table 42: France Advanced Visualization Tools Industry Volume (K Unit) Forecast, by Application 2020 & 2033
- Table 43: Italy Advanced Visualization Tools Industry Revenue (billion) Forecast, by Application 2020 & 2033
- Table 44: Italy Advanced Visualization Tools Industry Volume (K Unit) Forecast, by Application 2020 & 2033
- Table 45: Spain Advanced Visualization Tools Industry Revenue (billion) Forecast, by Application 2020 & 2033
- Table 46: Spain Advanced Visualization Tools Industry Volume (K Unit) Forecast, by Application 2020 & 2033
- Table 47: Rest of Europe Advanced Visualization Tools Industry Revenue (billion) Forecast, by Application 2020 & 2033
- Table 48: Rest of Europe Advanced Visualization Tools Industry Volume (K Unit) Forecast, by Application 2020 & 2033
- Table 49: Global Advanced Visualization Tools Industry Revenue billion Forecast, by Product and Service 2020 & 2033
- Table 50: Global Advanced Visualization Tools Industry Volume K Unit Forecast, by Product and Service 2020 & 2033
- Table 51: Global Advanced Visualization Tools Industry Revenue billion Forecast, by Type of Solution 2020 & 2033
- Table 52: Global Advanced Visualization Tools Industry Volume K Unit Forecast, by Type of Solution 2020 & 2033
- Table 53: Global Advanced Visualization Tools Industry Revenue billion Forecast, by Imaging Modality 2020 & 2033
- Table 54: Global Advanced Visualization Tools Industry Volume K Unit Forecast, by Imaging Modality 2020 & 2033
- Table 55: Global Advanced Visualization Tools Industry Revenue billion Forecast, by Clinical Application 2020 & 2033
- Table 56: Global Advanced Visualization Tools Industry Volume K Unit Forecast, by Clinical Application 2020 & 2033
- Table 57: Global Advanced Visualization Tools Industry Revenue billion Forecast, by Country 2020 & 2033
- Table 58: Global Advanced Visualization Tools Industry Volume K Unit Forecast, by Country 2020 & 2033
- Table 59: China Advanced Visualization Tools Industry Revenue (billion) Forecast, by Application 2020 & 2033
- Table 60: China Advanced Visualization Tools Industry Volume (K Unit) Forecast, by Application 2020 & 2033
- Table 61: Japan Advanced Visualization Tools Industry Revenue (billion) Forecast, by Application 2020 & 2033
- Table 62: Japan Advanced Visualization Tools Industry Volume (K Unit) Forecast, by Application 2020 & 2033
- Table 63: India Advanced Visualization Tools Industry Revenue (billion) Forecast, by Application 2020 & 2033
- Table 64: India Advanced Visualization Tools Industry Volume (K Unit) Forecast, by Application 2020 & 2033
- Table 65: Australia Advanced Visualization Tools Industry Revenue (billion) Forecast, by Application 2020 & 2033
- Table 66: Australia Advanced Visualization Tools Industry Volume (K Unit) Forecast, by Application 2020 & 2033
- Table 67: South Korea Advanced Visualization Tools Industry Revenue (billion) Forecast, by Application 2020 & 2033
- Table 68: South Korea Advanced Visualization Tools Industry Volume (K Unit) Forecast, by Application 2020 & 2033
- Table 69: Rest of Asia Pacific Advanced Visualization Tools Industry Revenue (billion) Forecast, by Application 2020 & 2033
- Table 70: Rest of Asia Pacific Advanced Visualization Tools Industry Volume (K Unit) Forecast, by Application 2020 & 2033
- Table 71: Global Advanced Visualization Tools Industry Revenue billion Forecast, by Product and Service 2020 & 2033
- Table 72: Global Advanced Visualization Tools Industry Volume K Unit Forecast, by Product and Service 2020 & 2033
- Table 73: Global Advanced Visualization Tools Industry Revenue billion Forecast, by Type of Solution 2020 & 2033
- Table 74: Global Advanced Visualization Tools Industry Volume K Unit Forecast, by Type of Solution 2020 & 2033
- Table 75: Global Advanced Visualization Tools Industry Revenue billion Forecast, by Imaging Modality 2020 & 2033
- Table 76: Global Advanced Visualization Tools Industry Volume K Unit Forecast, by Imaging Modality 2020 & 2033
- Table 77: Global Advanced Visualization Tools Industry Revenue billion Forecast, by Clinical Application 2020 & 2033
- Table 78: Global Advanced Visualization Tools Industry Volume K Unit Forecast, by Clinical Application 2020 & 2033
- Table 79: Global Advanced Visualization Tools Industry Revenue billion Forecast, by Country 2020 & 2033
- Table 80: Global Advanced Visualization Tools Industry Volume K Unit Forecast, by Country 2020 & 2033
- Table 81: GCC Advanced Visualization Tools Industry Revenue (billion) Forecast, by Application 2020 & 2033
- Table 82: GCC Advanced Visualization Tools Industry Volume (K Unit) Forecast, by Application 2020 & 2033
- Table 83: South Africa Advanced Visualization Tools Industry Revenue (billion) Forecast, by Application 2020 & 2033
- Table 84: South Africa Advanced Visualization Tools Industry Volume (K Unit) Forecast, by Application 2020 & 2033
- Table 85: Rest of Middle East and Africa Advanced Visualization Tools Industry Revenue (billion) Forecast, by Application 2020 & 2033
- Table 86: Rest of Middle East and Africa Advanced Visualization Tools Industry Volume (K Unit) Forecast, by Application 2020 & 2033
- Table 87: Global Advanced Visualization Tools Industry Revenue billion Forecast, by Product and Service 2020 & 2033
- Table 88: Global Advanced Visualization Tools Industry Volume K Unit Forecast, by Product and Service 2020 & 2033
- Table 89: Global Advanced Visualization Tools Industry Revenue billion Forecast, by Type of Solution 2020 & 2033
- Table 90: Global Advanced Visualization Tools Industry Volume K Unit Forecast, by Type of Solution 2020 & 2033
- Table 91: Global Advanced Visualization Tools Industry Revenue billion Forecast, by Imaging Modality 2020 & 2033
- Table 92: Global Advanced Visualization Tools Industry Volume K Unit Forecast, by Imaging Modality 2020 & 2033
- Table 93: Global Advanced Visualization Tools Industry Revenue billion Forecast, by Clinical Application 2020 & 2033
- Table 94: Global Advanced Visualization Tools Industry Volume K Unit Forecast, by Clinical Application 2020 & 2033
- Table 95: Global Advanced Visualization Tools Industry Revenue billion Forecast, by Country 2020 & 2033
- Table 96: Global Advanced Visualization Tools Industry Volume K Unit Forecast, by Country 2020 & 2033
- Table 97: Brazil Advanced Visualization Tools Industry Revenue (billion) Forecast, by Application 2020 & 2033
- Table 98: Brazil Advanced Visualization Tools Industry Volume (K Unit) Forecast, by Application 2020 & 2033
- Table 99: Argentina Advanced Visualization Tools Industry Revenue (billion) Forecast, by Application 2020 & 2033
- Table 100: Argentina Advanced Visualization Tools Industry Volume (K Unit) Forecast, by Application 2020 & 2033
- Table 101: Rest of South America Advanced Visualization Tools Industry Revenue (billion) Forecast, by Application 2020 & 2033
- Table 102: Rest of South America Advanced Visualization Tools Industry Volume (K Unit) Forecast, by Application 2020 & 2033
Frequently Asked Questions
1. What is the projected Compound Annual Growth Rate (CAGR) of the Advanced Visualization Tools Industry?
The projected CAGR is approximately 13.8%.
2. Which companies are prominent players in the Advanced Visualization Tools Industry?
Key companies in the market include Siemens Healthcare GmbH, Canon Inc (Canon Medical Systems Corporation), Terarecon Inc , Carestream Health, General Electric Company (GE Healthcare), Koninklijke Philips NV, Pro Medicus Ltd, Agfa-Gevaert Group, Fujifilm Holdings Corporation.
3. What are the main segments of the Advanced Visualization Tools Industry?
The market segments include Product and Service, Type of Solution, Imaging Modality, Clinical Application.
4. Can you provide details about the market size?
The market size is estimated to be USD 4.14 billion as of 2022.
5. What are some drivers contributing to market growth?
Increasing Prevalence of Chronic Diseases Coupled With Growing Geriatric Population; Rising Awareness of Benefits associated with Advanced Visualization Tools in Disease Diagnosis.
6. What are the notable trends driving market growth?
Oncology Under Clinical Application Expected to Grow Over the Forecast Period.
7. Are there any restraints impacting market growth?
Limited Availability of Reimbursements for Radiology-Based Diagnostic Procedures.
8. Can you provide examples of recent developments in the market?
August 2022: Kitware launched MIQA, a cloud-based application for medical image quality assurance. It facilitates collaboration and longitudinal studies by geographically diverse teams.
9. What pricing options are available for accessing the report?
Pricing options include single-user, multi-user, and enterprise licenses priced at USD 4750, USD 5250, and USD 8750 respectively.
10. Is the market size provided in terms of value or volume?
The market size is provided in terms of value, measured in billion and volume, measured in K Unit.
11. Are there any specific market keywords associated with the report?
Yes, the market keyword associated with the report is "Advanced Visualization Tools Industry," which aids in identifying and referencing the specific market segment covered.
12. How do I determine which pricing option suits my needs best?
The pricing options vary based on user requirements and access needs. Individual users may opt for single-user licenses, while businesses requiring broader access may choose multi-user or enterprise licenses for cost-effective access to the report.
13. Are there any additional resources or data provided in the Advanced Visualization Tools Industry report?
While the report offers comprehensive insights, it's advisable to review the specific contents or supplementary materials provided to ascertain if additional resources or data are available.
14. How can I stay updated on further developments or reports in the Advanced Visualization Tools Industry?
To stay informed about further developments, trends, and reports in the Advanced Visualization Tools Industry, consider subscribing to industry newsletters, following relevant companies and organizations, or regularly checking reputable industry news sources and publications.
Methodology
Step 1 - Identification of Relevant Samples Size from Population Database


Step 2 - Approaches for Defining Global Market Size (Value, Volume* & Price*)

Note*: In applicable scenarios
Step 3 - Data Sources
Primary Research
- Web Analytics
- Survey Reports
- Research Institute
- Latest Research Reports
- Opinion Leaders
Secondary Research
- Annual Reports
- White Paper
- Latest Press Release
- Industry Association
- Paid Database
- Investor Presentations

Step 4 - Data Triangulation
Involves using different sources of information in order to increase the validity of a study
These sources are likely to be stakeholders in a program - participants, other researchers, program staff, other community members, and so on.
Then we put all data in single framework & apply various statistical tools to find out the dynamic on the market.
During the analysis stage, feedback from the stakeholder groups would be compared to determine areas of agreement as well as areas of divergence