

Key Insights
The veterinary MRI market is poised for significant expansion, propelled by escalating pet ownership, increased pet healthcare spending, and technological innovations enhancing diagnostic precision and procedural efficiency. Projected to grow at a Compound Annual Growth Rate (CAGR) of 5.2% from a market size of $2.7 billion in the base year 2025, the market's trajectory is particularly strong in North America and Europe, regions characterized by high pet adoption and advanced veterinary infrastructure. Key application segments driving demand include cardiology, oncology, and neurology. The adoption of MRI is also broadening from companion animals to large animals, addressing the need for accurate diagnoses in equine and bovine care. The development of more compact, cost-effective veterinary-specific MRI systems is a key growth enabler. However, substantial upfront investment for equipment acquisition and maintenance, along with a scarcity of trained veterinary radiologists in certain areas, pose adoption challenges. Nevertheless, the ongoing trend of pet humanization and growing awareness among veterinary professionals regarding advanced imaging are expected to sustain market growth through 2033.
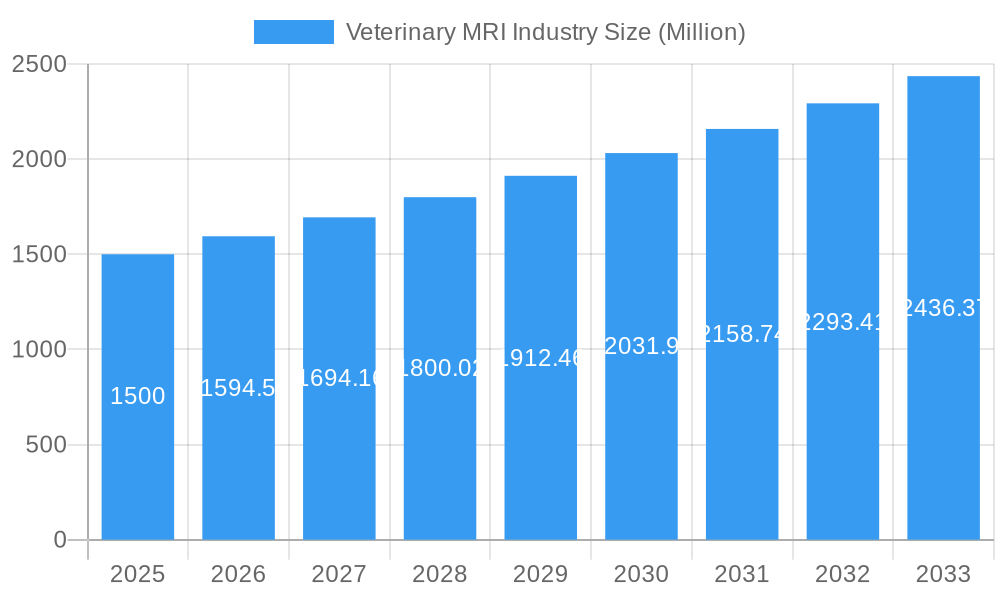
Veterinary MRI Industry Market Size (In Billion)
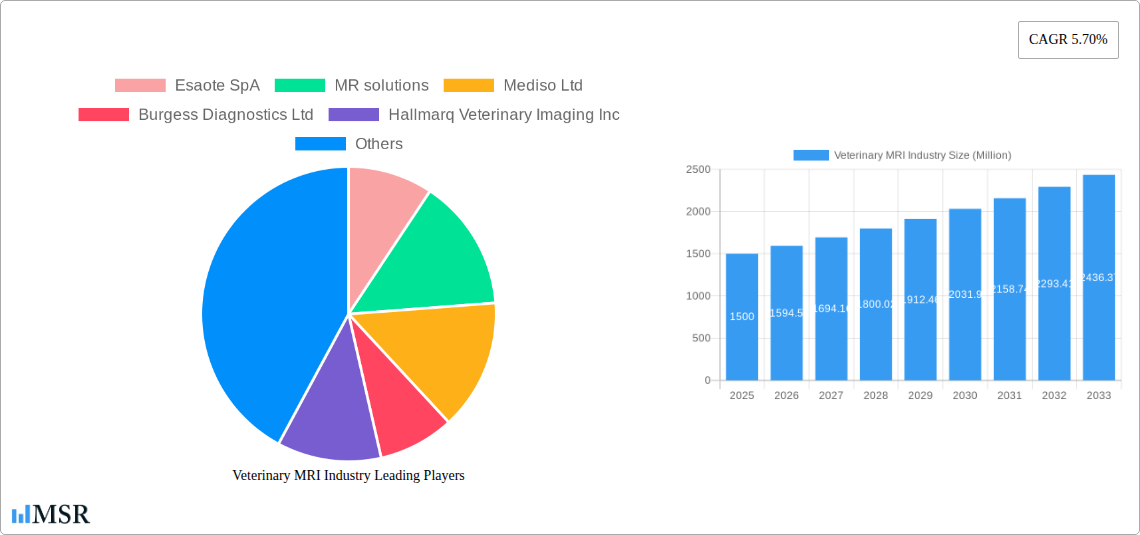
The competitive arena features established providers such as Esaote SpA and Bruker Corporation, alongside dedicated veterinary imaging specialists like Hallmarq Veterinary Imaging Inc. These entities are actively innovating MRI systems and software tailored for veterinary use. Strategic initiatives include forming alliances with veterinary practices and hospitals, and employing targeted marketing to highlight the diagnostic benefits of MRI. Geographically, the Asia Pacific region presents considerable growth opportunities, fueled by rapid economic development and rising pet populations. Consequently, market participants are likely to prioritize expansion in these emerging economies. Future market advancement will also hinge on the integration of AI and machine learning for enhanced image analysis, thereby improving diagnostic accuracy and operational efficiency.
Veterinary MRI Industry Company Market Share
Veterinary MRI Industry Market Report: 2019-2033
This comprehensive report provides a detailed analysis of the Veterinary MRI Industry, encompassing market size, growth drivers, key players, and future trends. With a study period spanning 2019-2033, a base year of 2025, and a forecast period of 2025-2033, this report offers invaluable insights for industry stakeholders, investors, and strategic decision-makers. The global veterinary MRI market is projected to reach $XX Million by 2033, exhibiting a CAGR of XX% during the forecast period.
Veterinary MRI Industry Market Concentration & Dynamics
The veterinary MRI market exhibits a moderately concentrated landscape, with key players such as Esaote SpA, MR solutions, Mediso Ltd, Burgess Diagnostics Ltd, Hallmarq Veterinary Imaging Inc, Shenzhen Mindray Bio-Medical Electronics Co, Universal Medical Systems Inc, Imotek International Ltd, and Bruker Corporation holding significant market share. The exact market share distribution varies across regions and product segments. However, the market is characterized by both organic growth initiatives (new product launches, technological advancements) and inorganic growth through mergers and acquisitions (M&A).
- Market Concentration: The Herfindahl-Hirschman Index (HHI) for the global veterinary MRI market is estimated to be around XX, indicating a moderately concentrated market.
- Innovation Ecosystems: The industry is witnessing significant innovation in MRI system technology, including improved image quality, faster scan times, and more compact systems suitable for various animal sizes. Collaborations between veterinary imaging companies and software developers are also driving innovation.
- Regulatory Frameworks: Regulatory compliance related to medical device approvals and data privacy varies across different geographies, impacting market dynamics. Stringent regulatory environments can create barriers to entry for new players.
- Substitute Products: While MRI remains a gold standard for veterinary diagnostics, alternative imaging techniques such as Ultrasound and X-ray remain competitive substitutes, particularly for less complex cases.
- End-User Trends: Increasing pet ownership, rising pet healthcare expenditure, and growing awareness among veterinarians regarding the benefits of advanced imaging technology are major drivers of market growth.
- M&A Activities: Over the historical period (2019-2024), an estimated XX M&A deals occurred in the veterinary MRI sector, with strategic acquisitions aimed at expanding product portfolios, market reach, and technological capabilities.
Veterinary MRI Industry Insights & Trends
The veterinary MRI market is experiencing robust growth driven by several factors. The increasing prevalence of chronic diseases in animals, the rising demand for advanced diagnostic imaging, and technological advancements in MRI systems are significant contributors. The market size reached approximately $XX Million in 2024 and is expected to reach $XX Million by 2033. This growth is largely fueled by an increase in pet ownership and a willingness of pet owners to invest in advanced healthcare for their companions. Technological disruptions such as the development of more compact and portable MRI systems, coupled with improvements in image processing and analysis software, are further accelerating market expansion. The adoption of artificial intelligence (AI) in veterinary diagnostics is also anticipated to positively impact the demand for veterinary MRI services. Consumer behavior is changing with greater acceptance of preventative healthcare and a willingness to explore advanced diagnostics.
Key Markets & Segments Leading Veterinary MRI Industry
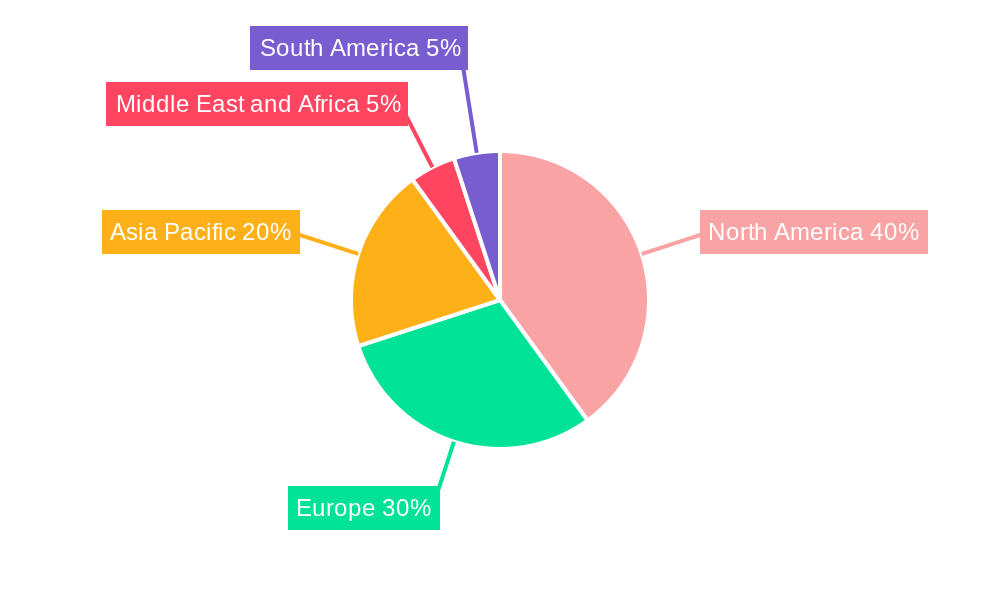
The North American region currently dominates the veterinary MRI market, followed by Europe and Asia Pacific. Within these regions, the United States and Germany are leading markets. Market dominance is attributed to several factors:
Drivers for North America:
- High pet ownership rates
- Advanced healthcare infrastructure
- High disposable income among pet owners
- Increased veterinary specialization
Drivers for Europe:
- Growing pet healthcare spending
- Rising prevalence of pet-related diseases
- Favorable regulatory environment
Drivers for Asia Pacific:
- Rising pet ownership in emerging economies
- Increasing veterinary infrastructure development
- Growing awareness of advanced diagnostics
Segment Analysis:
- Product Type: MRI systems represent the largest segment, followed by imaging software. The "others" category includes specialized accessories and services.
- Application: Oncology, cardiology, and neurology are significant application segments, representing a major share of market revenue due to their diagnostic importance.
- Animal Type: Small animals (dogs and cats) currently dominate the market, although the large animal segment is also showing consistent growth driven by advances in equipment suitable for larger patients and increasing demand for equine and bovine healthcare.
Veterinary MRI Industry Product Developments
Recent product innovations focus on enhancing image quality, reducing scan times, and improving system portability. Manufacturers are incorporating advanced technologies like AI-powered image analysis and cloud-based data management. These advancements offer improved diagnostic accuracy, streamlined workflows, and enhanced operational efficiency, creating a competitive edge in the market. The development of smaller, more affordable MRI systems is also expanding market access to veterinary clinics with limited space or budget.
Challenges in the Veterinary MRI Industry Market
The veterinary MRI market faces challenges including the high initial investment cost of MRI systems, the need for specialized technical expertise for operation and maintenance, and the relatively limited number of veterinary professionals trained in interpreting MRI images. Regulatory hurdles related to medical device approvals also pose a barrier to market entry, while supply chain disruptions can impact the availability of components and equipment. Competitive pressures from alternative imaging modalities also constrain market growth. For example, the availability of high-quality ultrasound systems could reduce demand for MRI in specific cases.
Forces Driving Veterinary MRI Industry Growth
Key growth drivers include the increasing prevalence of complex diseases in animals, technological advancements leading to improved image quality and reduced scan times, and the rising adoption of MRI in veterinary practices. Increased pet ownership and higher disposable incomes among pet owners fuel this growth. Furthermore, favorable government policies and initiatives supporting veterinary healthcare infrastructure development also positively influence market expansion. For instance, increased investment in veterinary research and development further incentivizes innovation.
Long-Term Growth Catalysts in the Veterinary MRI Industry
Long-term growth will be driven by continued technological innovation, such as the integration of AI and machine learning for automated image analysis and diagnosis. Strategic partnerships between MRI manufacturers and veterinary clinics will improve access to technology. Expansion into emerging markets with growing pet populations will also contribute significantly to the sector's growth in the coming decade. The development of more specialized MRI systems for specific animal species or disease conditions is another key growth catalyst.
Emerging Opportunities in Veterinary MRI Industry
Emerging opportunities lie in the development of portable and more affordable MRI systems, thereby increasing accessibility to veterinary clinics with limited resources. The increasing adoption of telehealth and remote diagnostics opens avenues for cloud-based image sharing and analysis. There is also a growing need for specialized MRI services for specific animal types, such as equine or bovine MRI, representing untapped market potential.
Leading Players in the Veterinary MRI Industry Sector
- Esaote SpA
- MR solutions
- Mediso Ltd
- Burgess Diagnostics Ltd
- Hallmarq Veterinary Imaging Inc
- Shenzhen Mindray Bio-Medical Electronics Co
- Universal Medical Systems Inc
- Imotek International Ltd
- Bruker Corporation
Key Milestones in Veterinary MRI Industry Industry
- August 2021: National Veterinary Associates and Ethos Veterinary Health partnered, potentially increasing access to advanced veterinary services, including MRI.
- April 2022: Launch of three new Veterinary Urgent Care Clinics in San Diego, potentially increasing the demand for veterinary diagnostic imaging services, including MRI.
Strategic Outlook for Veterinary MRI Industry Market
The veterinary MRI market is poised for substantial growth over the next decade, driven by technological innovation, expanding veterinary healthcare infrastructure, and a growing awareness of advanced diagnostics among pet owners. Strategic partnerships and acquisitions will shape the market landscape. Focus on developing user-friendly, affordable, and accessible MRI systems will be crucial for capturing larger market share and improving veterinary healthcare access globally.
Veterinary MRI Industry Segmentation
-
1. Product Type
- 1.1. MRI Systems
- 1.2. Imaging Software
- 1.3. Others
-
2. Application
- 2.1. Cardiology
- 2.2. Oncology
- 2.3. Neurology
- 2.4. Orthopedics
- 2.5. Other Applications
-
3. Animal Type
- 3.1. Small Animals
- 3.2. Large Animals
Veterinary MRI Industry Segmentation By Geography
-
1. North America
- 1.1. United States
- 1.2. Canada
- 1.3. Mexico
-
2. Europe
- 2.1. United Kingdom
- 2.2. Germany
- 2.3. France
- 2.4. Italy
- 2.5. Spain
- 2.6. Rest of Europe
-
3. Asia Pacific
- 3.1. China
- 3.2. Japan
- 3.3. India
- 3.4. Australia
- 3.5. South Korea
- 3.6. Rest of Asia Pacific
-
4. Middle East and Africa
- 4.1. GCC
- 4.2. South Africa
- 4.3. Rest of Middle East and Africa
-
5. South America
- 5.1. Brazil
- 5.2. Argentina
- 5.3. Rest of South America
Veterinary MRI Industry Regional Market Share
Geographic Coverage of Veterinary MRI Industry
Veterinary MRI Industry REPORT HIGHLIGHTS
| Aspects | Details |
|---|---|
| Study Period | 2020-2034 |
| Base Year | 2025 |
| Estimated Year | 2026 |
| Forecast Period | 2026-2034 |
| Historical Period | 2020-2025 |
| Growth Rate | CAGR of 5.2% from 2020-2034 |
| Segmentation |
|
Table of Contents
- 1. Introduction
- 1.1. Research Scope
- 1.2. Market Segmentation
- 1.3. Research Objective
- 1.4. Definitions and Assumptions
- 2. Executive Summary
- 2.1. Market Snapshot
- 3. Market Dynamics
- 3.1. Market Drivers
- 3.2. Market Restrains
- 3.3. Market Trends
- 3.4. Market Opportunities
- 4. Market Factor Analysis
- 4.1. Porters Five Forces
- 4.1.1. Bargaining Power of Suppliers
- 4.1.2. Bargaining Power of Buyers
- 4.1.3. Threat of New Entrants
- 4.1.4. Threat of Substitutes
- 4.1.5. Competitive Rivalry
- 4.2. PESTEL analysis
- 4.3. BCG Analysis
- 4.3.1. Stars (High Growth, High Market Share)
- 4.3.2. Cash Cows (Low Growth, High Market Share)
- 4.3.3. Question Mark (High Growth, Low Market Share)
- 4.3.4. Dogs (Low Growth, Low Market Share)
- 4.4. Ansoff Matrix Analysis
- 4.5. Supply Chain Analysis
- 4.6. Regulatory Landscape
- 4.7. Current Market Potential and Opportunity Assessment (TAM–SAM–SOM Framework)
- 4.8. MSR Analyst Note
- 4.1. Porters Five Forces
- 5. Market Analysis, Insights and Forecast 2021-2033
- 5.1. Market Analysis, Insights and Forecast - by Product Type
- 5.1.1. MRI Systems
- 5.1.2. Imaging Software
- 5.1.3. Others
- 5.2. Market Analysis, Insights and Forecast - by Application
- 5.2.1. Cardiology
- 5.2.2. Oncology
- 5.2.3. Neurology
- 5.2.4. Orthopedics
- 5.2.5. Other Applications
- 5.3. Market Analysis, Insights and Forecast - by Animal Type
- 5.3.1. Small Animals
- 5.3.2. Large Animals
- 5.4. Market Analysis, Insights and Forecast - by Region
- 5.4.1. North America
- 5.4.2. Europe
- 5.4.3. Asia Pacific
- 5.4.4. Middle East and Africa
- 5.4.5. South America
- 5.1. Market Analysis, Insights and Forecast - by Product Type
- 6. Global Veterinary MRI Industry Analysis, Insights and Forecast, 2021-2033
- 6.1. Market Analysis, Insights and Forecast - by Product Type
- 6.1.1. MRI Systems
- 6.1.2. Imaging Software
- 6.1.3. Others
- 6.2. Market Analysis, Insights and Forecast - by Application
- 6.2.1. Cardiology
- 6.2.2. Oncology
- 6.2.3. Neurology
- 6.2.4. Orthopedics
- 6.2.5. Other Applications
- 6.3. Market Analysis, Insights and Forecast - by Animal Type
- 6.3.1. Small Animals
- 6.3.2. Large Animals
- 6.1. Market Analysis, Insights and Forecast - by Product Type
- 7. North America Veterinary MRI Industry Analysis, Insights and Forecast, 2020-2032
- 7.1. Market Analysis, Insights and Forecast - by Product Type
- 7.1.1. MRI Systems
- 7.1.2. Imaging Software
- 7.1.3. Others
- 7.2. Market Analysis, Insights and Forecast - by Application
- 7.2.1. Cardiology
- 7.2.2. Oncology
- 7.2.3. Neurology
- 7.2.4. Orthopedics
- 7.2.5. Other Applications
- 7.3. Market Analysis, Insights and Forecast - by Animal Type
- 7.3.1. Small Animals
- 7.3.2. Large Animals
- 7.1. Market Analysis, Insights and Forecast - by Product Type
- 8. Europe Veterinary MRI Industry Analysis, Insights and Forecast, 2020-2032
- 8.1. Market Analysis, Insights and Forecast - by Product Type
- 8.1.1. MRI Systems
- 8.1.2. Imaging Software
- 8.1.3. Others
- 8.2. Market Analysis, Insights and Forecast - by Application
- 8.2.1. Cardiology
- 8.2.2. Oncology
- 8.2.3. Neurology
- 8.2.4. Orthopedics
- 8.2.5. Other Applications
- 8.3. Market Analysis, Insights and Forecast - by Animal Type
- 8.3.1. Small Animals
- 8.3.2. Large Animals
- 8.1. Market Analysis, Insights and Forecast - by Product Type
- 9. Asia Pacific Veterinary MRI Industry Analysis, Insights and Forecast, 2020-2032
- 9.1. Market Analysis, Insights and Forecast - by Product Type
- 9.1.1. MRI Systems
- 9.1.2. Imaging Software
- 9.1.3. Others
- 9.2. Market Analysis, Insights and Forecast - by Application
- 9.2.1. Cardiology
- 9.2.2. Oncology
- 9.2.3. Neurology
- 9.2.4. Orthopedics
- 9.2.5. Other Applications
- 9.3. Market Analysis, Insights and Forecast - by Animal Type
- 9.3.1. Small Animals
- 9.3.2. Large Animals
- 9.1. Market Analysis, Insights and Forecast - by Product Type
- 10. Middle East and Africa Veterinary MRI Industry Analysis, Insights and Forecast, 2020-2032
- 10.1. Market Analysis, Insights and Forecast - by Product Type
- 10.1.1. MRI Systems
- 10.1.2. Imaging Software
- 10.1.3. Others
- 10.2. Market Analysis, Insights and Forecast - by Application
- 10.2.1. Cardiology
- 10.2.2. Oncology
- 10.2.3. Neurology
- 10.2.4. Orthopedics
- 10.2.5. Other Applications
- 10.3. Market Analysis, Insights and Forecast - by Animal Type
- 10.3.1. Small Animals
- 10.3.2. Large Animals
- 10.1. Market Analysis, Insights and Forecast - by Product Type
- 11. South America Veterinary MRI Industry Analysis, Insights and Forecast, 2020-2032
- 11.1. Market Analysis, Insights and Forecast - by Product Type
- 11.1.1. MRI Systems
- 11.1.2. Imaging Software
- 11.1.3. Others
- 11.2. Market Analysis, Insights and Forecast - by Application
- 11.2.1. Cardiology
- 11.2.2. Oncology
- 11.2.3. Neurology
- 11.2.4. Orthopedics
- 11.2.5. Other Applications
- 11.3. Market Analysis, Insights and Forecast - by Animal Type
- 11.3.1. Small Animals
- 11.3.2. Large Animals
- 11.1. Market Analysis, Insights and Forecast - by Product Type
- 12. Competitive Analysis
- 12.1. Company Profiles
- 12.1.1 Esaote SpA
- 12.1.1.1. Company Overview
- 12.1.1.2. Products
- 12.1.1.3. Company Financials
- 12.1.1.4. SWOT Analysis
- 12.1.2 MR solutions
- 12.1.2.1. Company Overview
- 12.1.2.2. Products
- 12.1.2.3. Company Financials
- 12.1.2.4. SWOT Analysis
- 12.1.3 Mediso Ltd
- 12.1.3.1. Company Overview
- 12.1.3.2. Products
- 12.1.3.3. Company Financials
- 12.1.3.4. SWOT Analysis
- 12.1.4 Burgess Diagnostics Ltd
- 12.1.4.1. Company Overview
- 12.1.4.2. Products
- 12.1.4.3. Company Financials
- 12.1.4.4. SWOT Analysis
- 12.1.5 Hallmarq Veterinary Imaging Inc
- 12.1.5.1. Company Overview
- 12.1.5.2. Products
- 12.1.5.3. Company Financials
- 12.1.5.4. SWOT Analysis
- 12.1.6 Shenzhen Mindray Bio-Medical Electronics Co
- 12.1.6.1. Company Overview
- 12.1.6.2. Products
- 12.1.6.3. Company Financials
- 12.1.6.4. SWOT Analysis
- 12.1.7 Universal Medical Systems Inc
- 12.1.7.1. Company Overview
- 12.1.7.2. Products
- 12.1.7.3. Company Financials
- 12.1.7.4. SWOT Analysis
- 12.1.8 Imotek International Ltd
- 12.1.8.1. Company Overview
- 12.1.8.2. Products
- 12.1.8.3. Company Financials
- 12.1.8.4. SWOT Analysis
- 12.1.9 Bruker Corporation
- 12.1.9.1. Company Overview
- 12.1.9.2. Products
- 12.1.9.3. Company Financials
- 12.1.9.4. SWOT Analysis
- 12.1.1 Esaote SpA
- 12.2. Market Entropy
- 12.2.1 Company's Key Areas Served
- 12.2.2 Recent Developments
- 12.3. Company Market Share Analysis 2025
- 12.3.1 Top 5 Companies Market Share Analysis
- 12.3.2 Top 3 Companies Market Share Analysis
- 12.4. List of Potential Customers
- 13. Research Methodology
List of Figures
- Figure 1: Global Veterinary MRI Industry Revenue Breakdown (billion, %) by Region 2025 & 2033
- Figure 2: North America Veterinary MRI Industry Revenue (billion), by Product Type 2025 & 2033
- Figure 3: North America Veterinary MRI Industry Revenue Share (%), by Product Type 2025 & 2033
- Figure 4: North America Veterinary MRI Industry Revenue (billion), by Application 2025 & 2033
- Figure 5: North America Veterinary MRI Industry Revenue Share (%), by Application 2025 & 2033
- Figure 6: North America Veterinary MRI Industry Revenue (billion), by Animal Type 2025 & 2033
- Figure 7: North America Veterinary MRI Industry Revenue Share (%), by Animal Type 2025 & 2033
- Figure 8: North America Veterinary MRI Industry Revenue (billion), by Country 2025 & 2033
- Figure 9: North America Veterinary MRI Industry Revenue Share (%), by Country 2025 & 2033
- Figure 10: Europe Veterinary MRI Industry Revenue (billion), by Product Type 2025 & 2033
- Figure 11: Europe Veterinary MRI Industry Revenue Share (%), by Product Type 2025 & 2033
- Figure 12: Europe Veterinary MRI Industry Revenue (billion), by Application 2025 & 2033
- Figure 13: Europe Veterinary MRI Industry Revenue Share (%), by Application 2025 & 2033
- Figure 14: Europe Veterinary MRI Industry Revenue (billion), by Animal Type 2025 & 2033
- Figure 15: Europe Veterinary MRI Industry Revenue Share (%), by Animal Type 2025 & 2033
- Figure 16: Europe Veterinary MRI Industry Revenue (billion), by Country 2025 & 2033
- Figure 17: Europe Veterinary MRI Industry Revenue Share (%), by Country 2025 & 2033
- Figure 18: Asia Pacific Veterinary MRI Industry Revenue (billion), by Product Type 2025 & 2033
- Figure 19: Asia Pacific Veterinary MRI Industry Revenue Share (%), by Product Type 2025 & 2033
- Figure 20: Asia Pacific Veterinary MRI Industry Revenue (billion), by Application 2025 & 2033
- Figure 21: Asia Pacific Veterinary MRI Industry Revenue Share (%), by Application 2025 & 2033
- Figure 22: Asia Pacific Veterinary MRI Industry Revenue (billion), by Animal Type 2025 & 2033
- Figure 23: Asia Pacific Veterinary MRI Industry Revenue Share (%), by Animal Type 2025 & 2033
- Figure 24: Asia Pacific Veterinary MRI Industry Revenue (billion), by Country 2025 & 2033
- Figure 25: Asia Pacific Veterinary MRI Industry Revenue Share (%), by Country 2025 & 2033
- Figure 26: Middle East and Africa Veterinary MRI Industry Revenue (billion), by Product Type 2025 & 2033
- Figure 27: Middle East and Africa Veterinary MRI Industry Revenue Share (%), by Product Type 2025 & 2033
- Figure 28: Middle East and Africa Veterinary MRI Industry Revenue (billion), by Application 2025 & 2033
- Figure 29: Middle East and Africa Veterinary MRI Industry Revenue Share (%), by Application 2025 & 2033
- Figure 30: Middle East and Africa Veterinary MRI Industry Revenue (billion), by Animal Type 2025 & 2033
- Figure 31: Middle East and Africa Veterinary MRI Industry Revenue Share (%), by Animal Type 2025 & 2033
- Figure 32: Middle East and Africa Veterinary MRI Industry Revenue (billion), by Country 2025 & 2033
- Figure 33: Middle East and Africa Veterinary MRI Industry Revenue Share (%), by Country 2025 & 2033
- Figure 34: South America Veterinary MRI Industry Revenue (billion), by Product Type 2025 & 2033
- Figure 35: South America Veterinary MRI Industry Revenue Share (%), by Product Type 2025 & 2033
- Figure 36: South America Veterinary MRI Industry Revenue (billion), by Application 2025 & 2033
- Figure 37: South America Veterinary MRI Industry Revenue Share (%), by Application 2025 & 2033
- Figure 38: South America Veterinary MRI Industry Revenue (billion), by Animal Type 2025 & 2033
- Figure 39: South America Veterinary MRI Industry Revenue Share (%), by Animal Type 2025 & 2033
- Figure 40: South America Veterinary MRI Industry Revenue (billion), by Country 2025 & 2033
- Figure 41: South America Veterinary MRI Industry Revenue Share (%), by Country 2025 & 2033
List of Tables
- Table 1: Global Veterinary MRI Industry Revenue billion Forecast, by Product Type 2020 & 2033
- Table 2: Global Veterinary MRI Industry Revenue billion Forecast, by Application 2020 & 2033
- Table 3: Global Veterinary MRI Industry Revenue billion Forecast, by Animal Type 2020 & 2033
- Table 4: Global Veterinary MRI Industry Revenue billion Forecast, by Region 2020 & 2033
- Table 5: Global Veterinary MRI Industry Revenue billion Forecast, by Product Type 2020 & 2033
- Table 6: Global Veterinary MRI Industry Revenue billion Forecast, by Application 2020 & 2033
- Table 7: Global Veterinary MRI Industry Revenue billion Forecast, by Animal Type 2020 & 2033
- Table 8: Global Veterinary MRI Industry Revenue billion Forecast, by Country 2020 & 2033
- Table 9: United States Veterinary MRI Industry Revenue (billion) Forecast, by Application 2020 & 2033
- Table 10: Canada Veterinary MRI Industry Revenue (billion) Forecast, by Application 2020 & 2033
- Table 11: Mexico Veterinary MRI Industry Revenue (billion) Forecast, by Application 2020 & 2033
- Table 12: Global Veterinary MRI Industry Revenue billion Forecast, by Product Type 2020 & 2033
- Table 13: Global Veterinary MRI Industry Revenue billion Forecast, by Application 2020 & 2033
- Table 14: Global Veterinary MRI Industry Revenue billion Forecast, by Animal Type 2020 & 2033
- Table 15: Global Veterinary MRI Industry Revenue billion Forecast, by Country 2020 & 2033
- Table 16: United Kingdom Veterinary MRI Industry Revenue (billion) Forecast, by Application 2020 & 2033
- Table 17: Germany Veterinary MRI Industry Revenue (billion) Forecast, by Application 2020 & 2033
- Table 18: France Veterinary MRI Industry Revenue (billion) Forecast, by Application 2020 & 2033
- Table 19: Italy Veterinary MRI Industry Revenue (billion) Forecast, by Application 2020 & 2033
- Table 20: Spain Veterinary MRI Industry Revenue (billion) Forecast, by Application 2020 & 2033
- Table 21: Rest of Europe Veterinary MRI Industry Revenue (billion) Forecast, by Application 2020 & 2033
- Table 22: Global Veterinary MRI Industry Revenue billion Forecast, by Product Type 2020 & 2033
- Table 23: Global Veterinary MRI Industry Revenue billion Forecast, by Application 2020 & 2033
- Table 24: Global Veterinary MRI Industry Revenue billion Forecast, by Animal Type 2020 & 2033
- Table 25: Global Veterinary MRI Industry Revenue billion Forecast, by Country 2020 & 2033
- Table 26: China Veterinary MRI Industry Revenue (billion) Forecast, by Application 2020 & 2033
- Table 27: Japan Veterinary MRI Industry Revenue (billion) Forecast, by Application 2020 & 2033
- Table 28: India Veterinary MRI Industry Revenue (billion) Forecast, by Application 2020 & 2033
- Table 29: Australia Veterinary MRI Industry Revenue (billion) Forecast, by Application 2020 & 2033
- Table 30: South Korea Veterinary MRI Industry Revenue (billion) Forecast, by Application 2020 & 2033
- Table 31: Rest of Asia Pacific Veterinary MRI Industry Revenue (billion) Forecast, by Application 2020 & 2033
- Table 32: Global Veterinary MRI Industry Revenue billion Forecast, by Product Type 2020 & 2033
- Table 33: Global Veterinary MRI Industry Revenue billion Forecast, by Application 2020 & 2033
- Table 34: Global Veterinary MRI Industry Revenue billion Forecast, by Animal Type 2020 & 2033
- Table 35: Global Veterinary MRI Industry Revenue billion Forecast, by Country 2020 & 2033
- Table 36: GCC Veterinary MRI Industry Revenue (billion) Forecast, by Application 2020 & 2033
- Table 37: South Africa Veterinary MRI Industry Revenue (billion) Forecast, by Application 2020 & 2033
- Table 38: Rest of Middle East and Africa Veterinary MRI Industry Revenue (billion) Forecast, by Application 2020 & 2033
- Table 39: Global Veterinary MRI Industry Revenue billion Forecast, by Product Type 2020 & 2033
- Table 40: Global Veterinary MRI Industry Revenue billion Forecast, by Application 2020 & 2033
- Table 41: Global Veterinary MRI Industry Revenue billion Forecast, by Animal Type 2020 & 2033
- Table 42: Global Veterinary MRI Industry Revenue billion Forecast, by Country 2020 & 2033
- Table 43: Brazil Veterinary MRI Industry Revenue (billion) Forecast, by Application 2020 & 2033
- Table 44: Argentina Veterinary MRI Industry Revenue (billion) Forecast, by Application 2020 & 2033
- Table 45: Rest of South America Veterinary MRI Industry Revenue (billion) Forecast, by Application 2020 & 2033
Frequently Asked Questions
1. What is the projected Compound Annual Growth Rate (CAGR) of the Veterinary MRI Industry?
The projected CAGR is approximately 5.2%.
2. Which companies are prominent players in the Veterinary MRI Industry?
Key companies in the market include Esaote SpA, MR solutions, Mediso Ltd, Burgess Diagnostics Ltd, Hallmarq Veterinary Imaging Inc, Shenzhen Mindray Bio-Medical Electronics Co, Universal Medical Systems Inc, Imotek International Ltd, Bruker Corporation.
3. What are the main segments of the Veterinary MRI Industry?
The market segments include Product Type, Application, Animal Type.
4. Can you provide details about the market size?
The market size is estimated to be USD 2.7 billion as of 2022.
5. What are some drivers contributing to market growth?
Increased Pet Ownership and Initiatives for Animal Health; Technological Advancements in Veterinary Imaging.
6. What are the notable trends driving market growth?
Cardiology is Expected to Witness Healthy Growth in the Application Segment.
7. Are there any restraints impacting market growth?
High Cost of MRI Systems; Lack of Skilled Veterinarians.
8. Can you provide examples of recent developments in the market?
In April 2022, three new purpose-built clinics Veterinary Urgent Care Clinics launched in San Diego in Rancho Peñasquitos, Oceanside, and Irvine in Orange County.
9. What pricing options are available for accessing the report?
Pricing options include single-user, multi-user, and enterprise licenses priced at USD 4750, USD 5250, and USD 8750 respectively.
10. Is the market size provided in terms of value or volume?
The market size is provided in terms of value, measured in billion.
11. Are there any specific market keywords associated with the report?
Yes, the market keyword associated with the report is "Veterinary MRI Industry," which aids in identifying and referencing the specific market segment covered.
12. How do I determine which pricing option suits my needs best?
The pricing options vary based on user requirements and access needs. Individual users may opt for single-user licenses, while businesses requiring broader access may choose multi-user or enterprise licenses for cost-effective access to the report.
13. Are there any additional resources or data provided in the Veterinary MRI Industry report?
While the report offers comprehensive insights, it's advisable to review the specific contents or supplementary materials provided to ascertain if additional resources or data are available.
14. How can I stay updated on further developments or reports in the Veterinary MRI Industry?
To stay informed about further developments, trends, and reports in the Veterinary MRI Industry, consider subscribing to industry newsletters, following relevant companies and organizations, or regularly checking reputable industry news sources and publications.
Methodology
Step 1 - Identification of Relevant Samples Size from Population Database


Step 2 - Approaches for Defining Global Market Size (Value, Volume* & Price*)

Note*: In applicable scenarios
Step 3 - Data Sources
Primary Research
- Web Analytics
- Survey Reports
- Research Institute
- Latest Research Reports
- Opinion Leaders
Secondary Research
- Annual Reports
- White Paper
- Latest Press Release
- Industry Association
- Paid Database
- Investor Presentations

Step 4 - Data Triangulation
Involves using different sources of information in order to increase the validity of a study
These sources are likely to be stakeholders in a program - participants, other researchers, program staff, other community members, and so on.
Then we put all data in single framework & apply various statistical tools to find out the dynamic on the market.
During the analysis stage, feedback from the stakeholder groups would be compared to determine areas of agreement as well as areas of divergence