

Key Insights
The global Food Grade USP L-Glutamine market is projected to reach a substantial $93 million in 2025, demonstrating a robust Compound Annual Growth Rate (CAGR) of 4.5% through 2033. This upward trajectory is primarily fueled by the increasing demand for L-Glutamine as a crucial amino acid in the food industry, particularly for its role in enhancing flavor, nutritional value, and digestive health. Key applications in factories and laboratories, alongside the growing use of both powdered and granulated forms, underscore the market's diverse adoption. Leading companies like MeiHua Holdings Group, Ajinomoto, and Fufeng Group are at the forefront of this expansion, investing in research and development to meet the evolving needs of consumers and food manufacturers. The market's growth is further propelled by rising consumer awareness regarding the health benefits associated with L-Glutamine, including its positive impact on gut health and immune function, which are increasingly being incorporated into functional foods and dietary supplements.
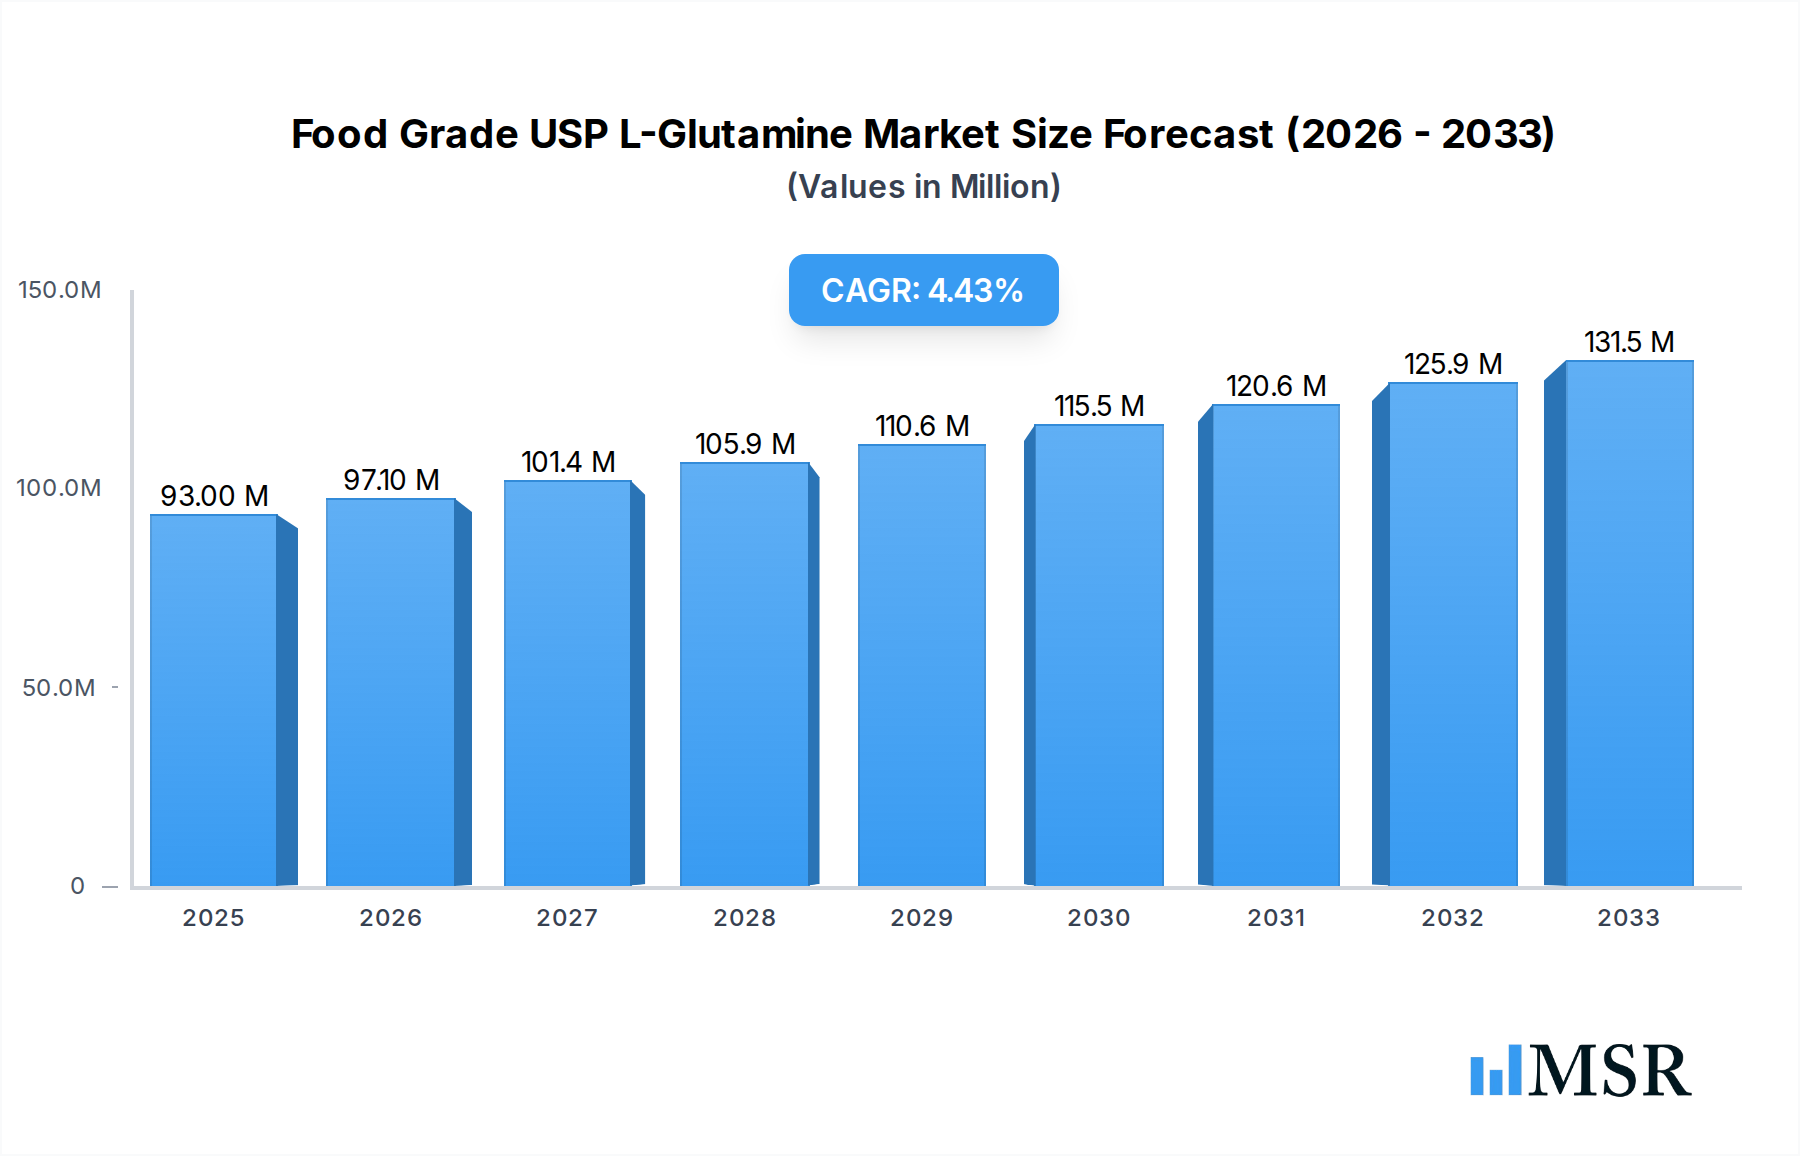
Food Grade USP L-Glutamine Market Size (In Million)
Despite the strong growth prospects, the market faces certain restraints, such as the fluctuating raw material costs and the stringent regulatory landscape governing food additives. However, these challenges are being addressed through strategic innovations in production processes and supply chain management by major industry players. Emerging trends indicate a significant surge in demand from the Asia Pacific region, particularly China and India, driven by their large populations and rapidly growing food processing sectors. North America and Europe also represent substantial markets, with a growing preference for high-quality, food-grade ingredients. The continuous innovation in product development, including the exploration of new applications and enhanced bioavailability, is expected to sustain the market's healthy expansion in the coming years, solidifying Food Grade USP L-Glutamine's position as a vital ingredient in the global food supply chain.

Food Grade USP L-Glutamine Company Market Share
Unlock the Potential: A Comprehensive Report on the Global Food Grade USP L-Glutamine Market (2019-2033)
This in-depth market research report provides a definitive analysis of the global Food Grade USP L-Glutamine market, a critical ingredient with burgeoning applications across the food and beverage, pharmaceutical, and nutraceutical industries. Spanning a comprehensive study period from 2019 to 2033, with a base year of 2025, this report offers unparalleled insights into market dynamics, growth trajectories, and future opportunities. The report meticulously analyzes market concentration, identifies key industry trends, highlights leading market segments, and explores product developments, challenges, and driving forces. With a focus on actionable intelligence for industry stakeholders, this report is your essential guide to navigating the evolving landscape of Food Grade USP L-Glutamine.
Food Grade USP L-Glutamine Market Concentration & Dynamics
The global Food Grade USP L-Glutamine market exhibits a moderate concentration, with leading players including MeiHua Holdings Group, Ajinomoto, Kyowa Hakko, Fufeng Group, and Daesang holding significant market share, estimated at over 70% of the total market value. The innovation ecosystem is characterized by ongoing R&D efforts focused on enhancing production efficiency, purity levels, and expanding application versatility. Regulatory frameworks, particularly those established by the USP (United States Pharmacopeia) and other international food safety authorities, play a crucial role in dictating product quality and market access. Substitute products, such as other amino acids or functional ingredients, pose a limited threat due to L-Glutamine's unique biological functions and established efficacy. End-user trends show a growing demand for high-purity L-Glutamine in sports nutrition, infant formulas, and therapeutic dietary supplements. Merger and acquisition (M&A) activities are observed periodically, driven by the desire for market consolidation and vertical integration, with an estimated xx M&A deals recorded in the historical period.
- Market Share of Top 5 Players: Estimated at >70% of global market value.
- Innovation Focus: Production efficiency, purity enhancement, application expansion.
- Regulatory Influence: USP standards, food safety certifications are paramount.
- Substitute Threat: Low, due to unique functional properties.
- End-User Demand: Sports nutrition, infant formula, therapeutic supplements.
- M&A Activity: Moderate, strategic acquisitions for market share and integration.
Food Grade USP L-Glutamine Industry Insights & Trends
The Food Grade USP L-Glutamine market is poised for robust growth, projected to reach an estimated market size of $XX million in the base year 2025, and expand to $XX million by 2033, exhibiting a Compound Annual Growth Rate (CAGR) of XX% during the forecast period (2025-2033). This expansion is underpinned by several key market growth drivers. The increasing consumer awareness regarding the health benefits of L-Glutamine, particularly its role in gut health, immune function, and muscle recovery, is a significant catalyst. The burgeoning sports nutrition sector, driven by a global trend towards health and fitness, is a major consumer of high-purity L-Glutamine. Furthermore, the rising adoption of L-Glutamine in infant nutrition for its crucial role in infant development and the growing prevalence of gut-related health issues are contributing to sustained demand. Technological disruptions, such as advancements in fermentation technology and purification processes, are enhancing production yields and reducing costs, making L-Glutamine more accessible. Evolving consumer behaviors also favor products with natural ingredients and scientifically validated health claims, aligning perfectly with the perceived benefits of L-Glutamine. The pharmaceutical sector's increasing interest in L-Glutamine for critical care and post-operative recovery applications further bolsters market prospects. The market is also witnessing innovation in delivery systems and fortified food products, catering to a broader consumer base and specific dietary needs. The historical period (2019-2024) saw a consistent upward trend, driven by initial market penetration in key applications and a growing understanding of L-Glutamine's multifaceted benefits. The report forecasts a continuation and acceleration of this trend, fueled by ongoing research and development and expanding market penetration into emerging economies. The demand for high-quality, USP-grade L-Glutamine is expected to remain a dominant factor, with manufacturers focusing on stringent quality control and adherence to international standards.
Key Markets & Segments Leading Food Grade USP L-Glutamine
The global Food Grade USP L-Glutamine market is experiencing significant growth across various segments, with distinct regions and applications leading the charge.
Dominant Application Segments:
Factory: The factory application segment is a primary driver, encompassing its widespread use as a raw material in the production of food supplements, fortified foods, and pharmaceuticals. Economic growth and increased manufacturing capacity in key regions contribute significantly to this segment's dominance. The demand for L-Glutamine as a functional ingredient in processed foods, energy drinks, and meal replacements is particularly high, driven by consumer preference for convenient health solutions. Infrastructure development in manufacturing hubs further supports the large-scale production and utilization of L-Glutamine in factory settings.
Laboratory: The laboratory segment, while smaller in volume, is crucial for research and development, quality control, and specialized scientific applications. Its importance lies in driving innovation and validating new uses for L-Glutamine. Increased investment in life sciences research and pharmaceutical R&D globally fuels the demand within this segment.
Others: This segment includes niche applications such as animal feed supplements and specialized cosmetic formulations. While currently smaller, these segments hold potential for future expansion as research uncovers further benefits of L-Glutamine.
Dominant Product Types:
Powder: The powder form of Food Grade USP L-Glutamine is overwhelmingly dominant due to its versatility, ease of handling, and cost-effectiveness in large-scale manufacturing. Its compatibility with various formulation processes makes it the preferred choice for most applications, from dietary supplements to infant formula.
Granulated: The granulated form offers advantages in terms of improved flowability, reduced dusting, and enhanced compressibility, making it suitable for specific tableting and encapsulation processes. While less prevalent than powder, its specialized applications contribute to its market presence.
Leading Regions and Countries:
North America and Europe currently represent the largest markets, driven by high consumer awareness, established nutraceutical and pharmaceutical industries, and stringent quality standards. Asia-Pacific is emerging as a rapid growth region, propelled by increasing disposable incomes, a growing health-conscious population, and expanding manufacturing capabilities. Countries like China, India, and Southeast Asian nations are key contributors to this growth.
Food Grade USP L-Glutamine Product Developments
Recent product developments in the Food Grade USP L-Glutamine market center on enhancing purity, optimizing bioavailability, and expanding its application scope. Manufacturers are investing in advanced fermentation and purification technologies to achieve higher grades of L-Glutamine, meeting the stringent requirements of pharmaceutical and infant nutrition sectors. Innovations in encapsulation and sustained-release formulations are also gaining traction, aiming to improve L-Glutamine's efficacy and consumer compliance in dietary supplements. Furthermore, research into synergistic combinations of L-Glutamine with other bioactive compounds is unlocking new application possibilities in functional foods and specialized health products, providing a competitive edge to forward-thinking companies.
Challenges in the Food Grade USP L-Glutamine Market
The Food Grade USP L-Glutamine market, while promising, faces several challenges. Regulatory hurdles in different regions can impact market entry and product approval processes, requiring significant compliance efforts. Supply chain disruptions, exacerbated by geopolitical factors or raw material availability, can affect production costs and delivery timelines. Intense competitive pressures among established players and emerging manufacturers can lead to price erosion, impacting profit margins. Furthermore, consumer education on the specific benefits and optimal usage of L-Glutamine remains an ongoing challenge to maximize market penetration.
- Regulatory Compliance: Navigating diverse international food and drug regulations.
- Supply Chain Volatility: Risks associated with raw material sourcing and global logistics.
- Market Competition: Price sensitivity and differentiation strategies.
- Consumer Awareness: Educating the market on nuanced benefits and applications.
Forces Driving Food Grade USP L-Glutamine Growth
The Food Grade USP L-Glutamine market is propelled by several compelling growth drivers. The rising global emphasis on health and wellness fuels the demand for dietary supplements and functional foods, where L-Glutamine plays a vital role. Advancements in biotechnology and fermentation processes are leading to more efficient and cost-effective production methods, increasing accessibility. The expanding sports nutrition industry, driven by a growing fitness-conscious population, is a significant consumer of L-Glutamine for muscle recovery and performance enhancement. Additionally, increasing research into L-Glutamine's therapeutic benefits, particularly for gut health and immune support, is opening up new application avenues in the pharmaceutical and medical nutrition sectors.
Challenges in the Food Grade USP L-Glutamine Market
Long-term growth catalysts for the Food Grade USP L-Glutamine market are rooted in continuous innovation and strategic market expansion. Ongoing research into novel therapeutic applications, such as its role in managing inflammatory bowel diseases and supporting recovery from critical illnesses, will unlock significant new demand segments. Technological advancements in sustainable and efficient L-Glutamine production, including bio-based manufacturing processes, will further enhance cost-effectiveness and environmental appeal. Strategic partnerships between ingredient manufacturers and end-product formulators will accelerate product development and market penetration. Furthermore, expanding into emerging markets with growing healthcare awareness and disposable incomes presents a substantial long-term growth opportunity.
Emerging Opportunities in Food Grade USP L-Glutamine
Emerging opportunities in the Food Grade USP L-Glutamine market are abundant, driven by evolving consumer preferences and scientific discoveries. The growing demand for plant-based and clean-label products presents an opportunity for L-Glutamine derived from sustainable fermentation processes. Innovations in personalized nutrition are creating niches for targeted L-Glutamine formulations catering to specific health goals and individual needs. Furthermore, the increasing research into L-Glutamine's role in cognitive function and mental well-being opens up the potential for its inclusion in nootropic supplements and functional beverages. The expansion of online retail channels also provides a direct pathway to consumers, enabling wider market reach for L-Glutamine-based products.
Leading Players in the Food Grade USP L-Glutamine Sector
- MeiHua Holdings Group
- Ajinomoto
- Kyowa Hakko
- Fufeng Group
- Daesang
Key Milestones in Food Grade USP L-Glutamine Industry
- 2019: Increased investment in R&D for L-Glutamine's gut health benefits.
- 2020: Expansion of fermentation capacity by key manufacturers to meet rising demand.
- 2021: Growing adoption of USP L-Glutamine in advanced infant nutrition formulas.
- 2022: Significant breakthroughs in research linking L-Glutamine to immune system modulation.
- 2023: Strategic collaborations to develop new delivery systems for L-Glutamine supplements.
- 2024: Enhanced focus on sustainable production practices for L-Glutamine.
- 2025 (Estimated): Anticipated surge in demand from the sports nutrition and clinical nutrition sectors.
- 2026-2033 (Forecast): Continued market expansion driven by new therapeutic applications and emerging economies.
Strategic Outlook for Food Grade USP L-Glutamine Market
The strategic outlook for the Food Grade USP L-Glutamine market is exceptionally bright, characterized by sustained growth and innovation. Key growth accelerators include the continued expansion of the global nutraceutical and pharmaceutical sectors, coupled with increasing consumer demand for health-promoting ingredients. Manufacturers are advised to focus on vertical integration, invest in advanced production technologies to optimize cost and purity, and actively pursue research and development for novel applications, particularly in areas like gut health and cognitive function. Strategic partnerships with research institutions and end-product manufacturers will be crucial for accelerating market penetration and product development. Furthermore, proactive engagement with regulatory bodies and a commitment to sustainable manufacturing practices will ensure long-term market viability and consumer trust. The market is ripe for companies that can effectively leverage scientific advancements and cater to evolving consumer wellness trends.
Food Grade USP L-Glutamine Segmentation
-
1. Application
- 1.1. Factory
- 1.2. Laboratory
- 1.3. Others
-
2. Types
- 2.1. Powder
- 2.2. Granulated
Food Grade USP L-Glutamine Segmentation By Geography
-
1. North America
- 1.1. United States
- 1.2. Canada
- 1.3. Mexico
-
2. South America
- 2.1. Brazil
- 2.2. Argentina
- 2.3. Rest of South America
-
3. Europe
- 3.1. United Kingdom
- 3.2. Germany
- 3.3. France
- 3.4. Italy
- 3.5. Spain
- 3.6. Russia
- 3.7. Benelux
- 3.8. Nordics
- 3.9. Rest of Europe
-
4. Middle East & Africa
- 4.1. Turkey
- 4.2. Israel
- 4.3. GCC
- 4.4. North Africa
- 4.5. South Africa
- 4.6. Rest of Middle East & Africa
-
5. Asia Pacific
- 5.1. China
- 5.2. India
- 5.3. Japan
- 5.4. South Korea
- 5.5. ASEAN
- 5.6. Oceania
- 5.7. Rest of Asia Pacific
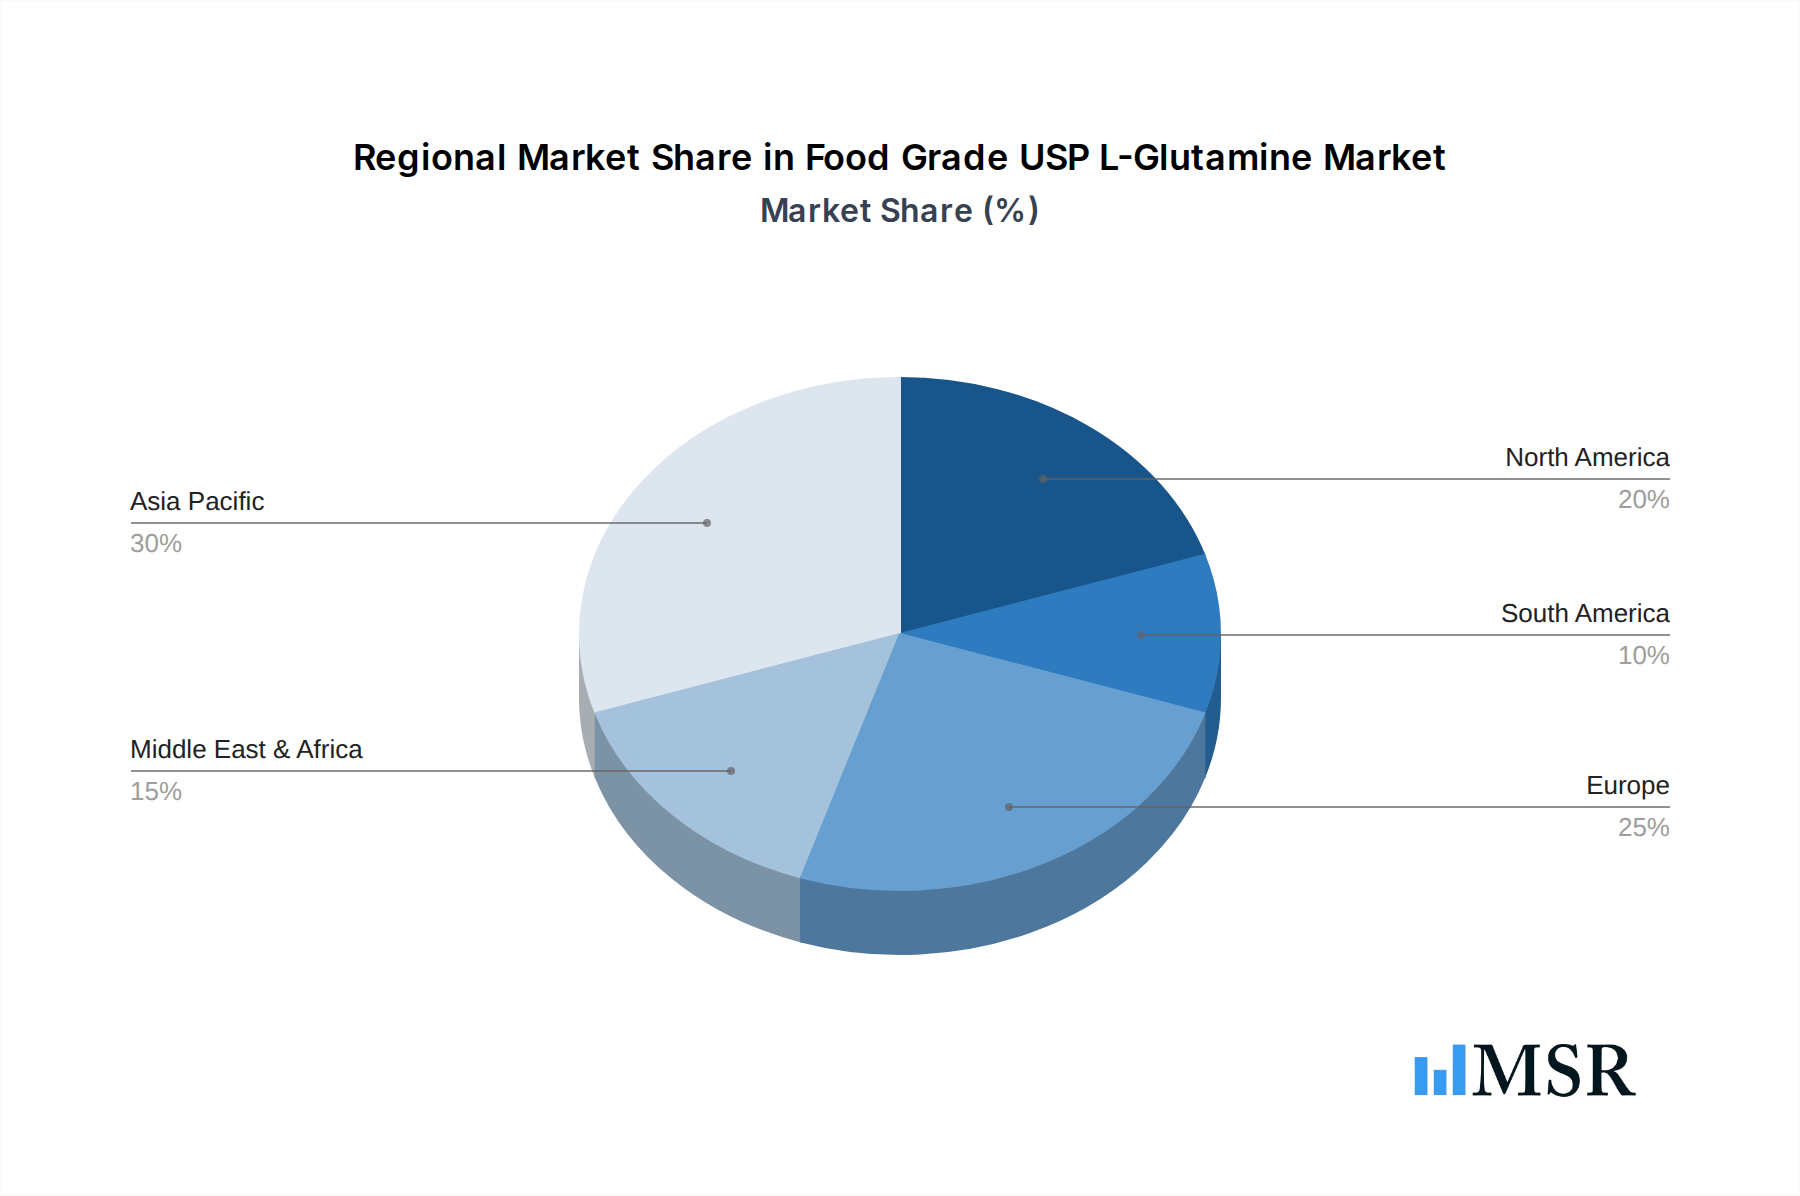
Food Grade USP L-Glutamine Regional Market Share
Geographic Coverage of Food Grade USP L-Glutamine
Food Grade USP L-Glutamine REPORT HIGHLIGHTS
| Aspects | Details |
|---|---|
| Study Period | 2020-2034 |
| Base Year | 2025 |
| Estimated Year | 2026 |
| Forecast Period | 2026-2034 |
| Historical Period | 2020-2025 |
| Growth Rate | CAGR of 4.5% from 2020-2034 |
| Segmentation |
|
Table of Contents
- 1. Introduction
- 1.1. Research Scope
- 1.2. Market Segmentation
- 1.3. Research Methodology
- 1.4. Definitions and Assumptions
- 2. Executive Summary
- 2.1. Introduction
- 3. Market Dynamics
- 3.1. Introduction
- 3.2. Market Drivers
- 3.3. Market Restrains
- 3.4. Market Trends
- 4. Market Factor Analysis
- 4.1. Porters Five Forces
- 4.2. Supply/Value Chain
- 4.3. PESTEL analysis
- 4.4. Market Entropy
- 4.5. Patent/Trademark Analysis
- 5. Global Food Grade USP L-Glutamine Analysis, Insights and Forecast, 2020-2032
- 5.1. Market Analysis, Insights and Forecast - by Application
- 5.1.1. Factory
- 5.1.2. Laboratory
- 5.1.3. Others
- 5.2. Market Analysis, Insights and Forecast - by Types
- 5.2.1. Powder
- 5.2.2. Granulated
- 5.3. Market Analysis, Insights and Forecast - by Region
- 5.3.1. North America
- 5.3.2. South America
- 5.3.3. Europe
- 5.3.4. Middle East & Africa
- 5.3.5. Asia Pacific
- 5.1. Market Analysis, Insights and Forecast - by Application
- 6. North America Food Grade USP L-Glutamine Analysis, Insights and Forecast, 2020-2032
- 6.1. Market Analysis, Insights and Forecast - by Application
- 6.1.1. Factory
- 6.1.2. Laboratory
- 6.1.3. Others
- 6.2. Market Analysis, Insights and Forecast - by Types
- 6.2.1. Powder
- 6.2.2. Granulated
- 6.1. Market Analysis, Insights and Forecast - by Application
- 7. South America Food Grade USP L-Glutamine Analysis, Insights and Forecast, 2020-2032
- 7.1. Market Analysis, Insights and Forecast - by Application
- 7.1.1. Factory
- 7.1.2. Laboratory
- 7.1.3. Others
- 7.2. Market Analysis, Insights and Forecast - by Types
- 7.2.1. Powder
- 7.2.2. Granulated
- 7.1. Market Analysis, Insights and Forecast - by Application
- 8. Europe Food Grade USP L-Glutamine Analysis, Insights and Forecast, 2020-2032
- 8.1. Market Analysis, Insights and Forecast - by Application
- 8.1.1. Factory
- 8.1.2. Laboratory
- 8.1.3. Others
- 8.2. Market Analysis, Insights and Forecast - by Types
- 8.2.1. Powder
- 8.2.2. Granulated
- 8.1. Market Analysis, Insights and Forecast - by Application
- 9. Middle East & Africa Food Grade USP L-Glutamine Analysis, Insights and Forecast, 2020-2032
- 9.1. Market Analysis, Insights and Forecast - by Application
- 9.1.1. Factory
- 9.1.2. Laboratory
- 9.1.3. Others
- 9.2. Market Analysis, Insights and Forecast - by Types
- 9.2.1. Powder
- 9.2.2. Granulated
- 9.1. Market Analysis, Insights and Forecast - by Application
- 10. Asia Pacific Food Grade USP L-Glutamine Analysis, Insights and Forecast, 2020-2032
- 10.1. Market Analysis, Insights and Forecast - by Application
- 10.1.1. Factory
- 10.1.2. Laboratory
- 10.1.3. Others
- 10.2. Market Analysis, Insights and Forecast - by Types
- 10.2.1. Powder
- 10.2.2. Granulated
- 10.1. Market Analysis, Insights and Forecast - by Application
- 11. Competitive Analysis
- 11.1. Global Market Share Analysis 2025
- 11.2. Company Profiles
- 11.2.1 MeiHua Holdings Group
- 11.2.1.1. Overview
- 11.2.1.2. Products
- 11.2.1.3. SWOT Analysis
- 11.2.1.4. Recent Developments
- 11.2.1.5. Financials (Based on Availability)
- 11.2.2 Ajinomoto
- 11.2.2.1. Overview
- 11.2.2.2. Products
- 11.2.2.3. SWOT Analysis
- 11.2.2.4. Recent Developments
- 11.2.2.5. Financials (Based on Availability)
- 11.2.3 Kyowa Hakko
- 11.2.3.1. Overview
- 11.2.3.2. Products
- 11.2.3.3. SWOT Analysis
- 11.2.3.4. Recent Developments
- 11.2.3.5. Financials (Based on Availability)
- 11.2.4 Fufeng Group
- 11.2.4.1. Overview
- 11.2.4.2. Products
- 11.2.4.3. SWOT Analysis
- 11.2.4.4. Recent Developments
- 11.2.4.5. Financials (Based on Availability)
- 11.2.5 Daesang
- 11.2.5.1. Overview
- 11.2.5.2. Products
- 11.2.5.3. SWOT Analysis
- 11.2.5.4. Recent Developments
- 11.2.5.5. Financials (Based on Availability)
- 11.2.1 MeiHua Holdings Group
List of Figures
- Figure 1: Global Food Grade USP L-Glutamine Revenue Breakdown (million, %) by Region 2025 & 2033
- Figure 2: Global Food Grade USP L-Glutamine Volume Breakdown (K, %) by Region 2025 & 2033
- Figure 3: North America Food Grade USP L-Glutamine Revenue (million), by Application 2025 & 2033
- Figure 4: North America Food Grade USP L-Glutamine Volume (K), by Application 2025 & 2033
- Figure 5: North America Food Grade USP L-Glutamine Revenue Share (%), by Application 2025 & 2033
- Figure 6: North America Food Grade USP L-Glutamine Volume Share (%), by Application 2025 & 2033
- Figure 7: North America Food Grade USP L-Glutamine Revenue (million), by Types 2025 & 2033
- Figure 8: North America Food Grade USP L-Glutamine Volume (K), by Types 2025 & 2033
- Figure 9: North America Food Grade USP L-Glutamine Revenue Share (%), by Types 2025 & 2033
- Figure 10: North America Food Grade USP L-Glutamine Volume Share (%), by Types 2025 & 2033
- Figure 11: North America Food Grade USP L-Glutamine Revenue (million), by Country 2025 & 2033
- Figure 12: North America Food Grade USP L-Glutamine Volume (K), by Country 2025 & 2033
- Figure 13: North America Food Grade USP L-Glutamine Revenue Share (%), by Country 2025 & 2033
- Figure 14: North America Food Grade USP L-Glutamine Volume Share (%), by Country 2025 & 2033
- Figure 15: South America Food Grade USP L-Glutamine Revenue (million), by Application 2025 & 2033
- Figure 16: South America Food Grade USP L-Glutamine Volume (K), by Application 2025 & 2033
- Figure 17: South America Food Grade USP L-Glutamine Revenue Share (%), by Application 2025 & 2033
- Figure 18: South America Food Grade USP L-Glutamine Volume Share (%), by Application 2025 & 2033
- Figure 19: South America Food Grade USP L-Glutamine Revenue (million), by Types 2025 & 2033
- Figure 20: South America Food Grade USP L-Glutamine Volume (K), by Types 2025 & 2033
- Figure 21: South America Food Grade USP L-Glutamine Revenue Share (%), by Types 2025 & 2033
- Figure 22: South America Food Grade USP L-Glutamine Volume Share (%), by Types 2025 & 2033
- Figure 23: South America Food Grade USP L-Glutamine Revenue (million), by Country 2025 & 2033
- Figure 24: South America Food Grade USP L-Glutamine Volume (K), by Country 2025 & 2033
- Figure 25: South America Food Grade USP L-Glutamine Revenue Share (%), by Country 2025 & 2033
- Figure 26: South America Food Grade USP L-Glutamine Volume Share (%), by Country 2025 & 2033
- Figure 27: Europe Food Grade USP L-Glutamine Revenue (million), by Application 2025 & 2033
- Figure 28: Europe Food Grade USP L-Glutamine Volume (K), by Application 2025 & 2033
- Figure 29: Europe Food Grade USP L-Glutamine Revenue Share (%), by Application 2025 & 2033
- Figure 30: Europe Food Grade USP L-Glutamine Volume Share (%), by Application 2025 & 2033
- Figure 31: Europe Food Grade USP L-Glutamine Revenue (million), by Types 2025 & 2033
- Figure 32: Europe Food Grade USP L-Glutamine Volume (K), by Types 2025 & 2033
- Figure 33: Europe Food Grade USP L-Glutamine Revenue Share (%), by Types 2025 & 2033
- Figure 34: Europe Food Grade USP L-Glutamine Volume Share (%), by Types 2025 & 2033
- Figure 35: Europe Food Grade USP L-Glutamine Revenue (million), by Country 2025 & 2033
- Figure 36: Europe Food Grade USP L-Glutamine Volume (K), by Country 2025 & 2033
- Figure 37: Europe Food Grade USP L-Glutamine Revenue Share (%), by Country 2025 & 2033
- Figure 38: Europe Food Grade USP L-Glutamine Volume Share (%), by Country 2025 & 2033
- Figure 39: Middle East & Africa Food Grade USP L-Glutamine Revenue (million), by Application 2025 & 2033
- Figure 40: Middle East & Africa Food Grade USP L-Glutamine Volume (K), by Application 2025 & 2033
- Figure 41: Middle East & Africa Food Grade USP L-Glutamine Revenue Share (%), by Application 2025 & 2033
- Figure 42: Middle East & Africa Food Grade USP L-Glutamine Volume Share (%), by Application 2025 & 2033
- Figure 43: Middle East & Africa Food Grade USP L-Glutamine Revenue (million), by Types 2025 & 2033
- Figure 44: Middle East & Africa Food Grade USP L-Glutamine Volume (K), by Types 2025 & 2033
- Figure 45: Middle East & Africa Food Grade USP L-Glutamine Revenue Share (%), by Types 2025 & 2033
- Figure 46: Middle East & Africa Food Grade USP L-Glutamine Volume Share (%), by Types 2025 & 2033
- Figure 47: Middle East & Africa Food Grade USP L-Glutamine Revenue (million), by Country 2025 & 2033
- Figure 48: Middle East & Africa Food Grade USP L-Glutamine Volume (K), by Country 2025 & 2033
- Figure 49: Middle East & Africa Food Grade USP L-Glutamine Revenue Share (%), by Country 2025 & 2033
- Figure 50: Middle East & Africa Food Grade USP L-Glutamine Volume Share (%), by Country 2025 & 2033
- Figure 51: Asia Pacific Food Grade USP L-Glutamine Revenue (million), by Application 2025 & 2033
- Figure 52: Asia Pacific Food Grade USP L-Glutamine Volume (K), by Application 2025 & 2033
- Figure 53: Asia Pacific Food Grade USP L-Glutamine Revenue Share (%), by Application 2025 & 2033
- Figure 54: Asia Pacific Food Grade USP L-Glutamine Volume Share (%), by Application 2025 & 2033
- Figure 55: Asia Pacific Food Grade USP L-Glutamine Revenue (million), by Types 2025 & 2033
- Figure 56: Asia Pacific Food Grade USP L-Glutamine Volume (K), by Types 2025 & 2033
- Figure 57: Asia Pacific Food Grade USP L-Glutamine Revenue Share (%), by Types 2025 & 2033
- Figure 58: Asia Pacific Food Grade USP L-Glutamine Volume Share (%), by Types 2025 & 2033
- Figure 59: Asia Pacific Food Grade USP L-Glutamine Revenue (million), by Country 2025 & 2033
- Figure 60: Asia Pacific Food Grade USP L-Glutamine Volume (K), by Country 2025 & 2033
- Figure 61: Asia Pacific Food Grade USP L-Glutamine Revenue Share (%), by Country 2025 & 2033
- Figure 62: Asia Pacific Food Grade USP L-Glutamine Volume Share (%), by Country 2025 & 2033
List of Tables
- Table 1: Global Food Grade USP L-Glutamine Revenue million Forecast, by Application 2020 & 2033
- Table 2: Global Food Grade USP L-Glutamine Volume K Forecast, by Application 2020 & 2033
- Table 3: Global Food Grade USP L-Glutamine Revenue million Forecast, by Types 2020 & 2033
- Table 4: Global Food Grade USP L-Glutamine Volume K Forecast, by Types 2020 & 2033
- Table 5: Global Food Grade USP L-Glutamine Revenue million Forecast, by Region 2020 & 2033
- Table 6: Global Food Grade USP L-Glutamine Volume K Forecast, by Region 2020 & 2033
- Table 7: Global Food Grade USP L-Glutamine Revenue million Forecast, by Application 2020 & 2033
- Table 8: Global Food Grade USP L-Glutamine Volume K Forecast, by Application 2020 & 2033
- Table 9: Global Food Grade USP L-Glutamine Revenue million Forecast, by Types 2020 & 2033
- Table 10: Global Food Grade USP L-Glutamine Volume K Forecast, by Types 2020 & 2033
- Table 11: Global Food Grade USP L-Glutamine Revenue million Forecast, by Country 2020 & 2033
- Table 12: Global Food Grade USP L-Glutamine Volume K Forecast, by Country 2020 & 2033
- Table 13: United States Food Grade USP L-Glutamine Revenue (million) Forecast, by Application 2020 & 2033
- Table 14: United States Food Grade USP L-Glutamine Volume (K) Forecast, by Application 2020 & 2033
- Table 15: Canada Food Grade USP L-Glutamine Revenue (million) Forecast, by Application 2020 & 2033
- Table 16: Canada Food Grade USP L-Glutamine Volume (K) Forecast, by Application 2020 & 2033
- Table 17: Mexico Food Grade USP L-Glutamine Revenue (million) Forecast, by Application 2020 & 2033
- Table 18: Mexico Food Grade USP L-Glutamine Volume (K) Forecast, by Application 2020 & 2033
- Table 19: Global Food Grade USP L-Glutamine Revenue million Forecast, by Application 2020 & 2033
- Table 20: Global Food Grade USP L-Glutamine Volume K Forecast, by Application 2020 & 2033
- Table 21: Global Food Grade USP L-Glutamine Revenue million Forecast, by Types 2020 & 2033
- Table 22: Global Food Grade USP L-Glutamine Volume K Forecast, by Types 2020 & 2033
- Table 23: Global Food Grade USP L-Glutamine Revenue million Forecast, by Country 2020 & 2033
- Table 24: Global Food Grade USP L-Glutamine Volume K Forecast, by Country 2020 & 2033
- Table 25: Brazil Food Grade USP L-Glutamine Revenue (million) Forecast, by Application 2020 & 2033
- Table 26: Brazil Food Grade USP L-Glutamine Volume (K) Forecast, by Application 2020 & 2033
- Table 27: Argentina Food Grade USP L-Glutamine Revenue (million) Forecast, by Application 2020 & 2033
- Table 28: Argentina Food Grade USP L-Glutamine Volume (K) Forecast, by Application 2020 & 2033
- Table 29: Rest of South America Food Grade USP L-Glutamine Revenue (million) Forecast, by Application 2020 & 2033
- Table 30: Rest of South America Food Grade USP L-Glutamine Volume (K) Forecast, by Application 2020 & 2033
- Table 31: Global Food Grade USP L-Glutamine Revenue million Forecast, by Application 2020 & 2033
- Table 32: Global Food Grade USP L-Glutamine Volume K Forecast, by Application 2020 & 2033
- Table 33: Global Food Grade USP L-Glutamine Revenue million Forecast, by Types 2020 & 2033
- Table 34: Global Food Grade USP L-Glutamine Volume K Forecast, by Types 2020 & 2033
- Table 35: Global Food Grade USP L-Glutamine Revenue million Forecast, by Country 2020 & 2033
- Table 36: Global Food Grade USP L-Glutamine Volume K Forecast, by Country 2020 & 2033
- Table 37: United Kingdom Food Grade USP L-Glutamine Revenue (million) Forecast, by Application 2020 & 2033
- Table 38: United Kingdom Food Grade USP L-Glutamine Volume (K) Forecast, by Application 2020 & 2033
- Table 39: Germany Food Grade USP L-Glutamine Revenue (million) Forecast, by Application 2020 & 2033
- Table 40: Germany Food Grade USP L-Glutamine Volume (K) Forecast, by Application 2020 & 2033
- Table 41: France Food Grade USP L-Glutamine Revenue (million) Forecast, by Application 2020 & 2033
- Table 42: France Food Grade USP L-Glutamine Volume (K) Forecast, by Application 2020 & 2033
- Table 43: Italy Food Grade USP L-Glutamine Revenue (million) Forecast, by Application 2020 & 2033
- Table 44: Italy Food Grade USP L-Glutamine Volume (K) Forecast, by Application 2020 & 2033
- Table 45: Spain Food Grade USP L-Glutamine Revenue (million) Forecast, by Application 2020 & 2033
- Table 46: Spain Food Grade USP L-Glutamine Volume (K) Forecast, by Application 2020 & 2033
- Table 47: Russia Food Grade USP L-Glutamine Revenue (million) Forecast, by Application 2020 & 2033
- Table 48: Russia Food Grade USP L-Glutamine Volume (K) Forecast, by Application 2020 & 2033
- Table 49: Benelux Food Grade USP L-Glutamine Revenue (million) Forecast, by Application 2020 & 2033
- Table 50: Benelux Food Grade USP L-Glutamine Volume (K) Forecast, by Application 2020 & 2033
- Table 51: Nordics Food Grade USP L-Glutamine Revenue (million) Forecast, by Application 2020 & 2033
- Table 52: Nordics Food Grade USP L-Glutamine Volume (K) Forecast, by Application 2020 & 2033
- Table 53: Rest of Europe Food Grade USP L-Glutamine Revenue (million) Forecast, by Application 2020 & 2033
- Table 54: Rest of Europe Food Grade USP L-Glutamine Volume (K) Forecast, by Application 2020 & 2033
- Table 55: Global Food Grade USP L-Glutamine Revenue million Forecast, by Application 2020 & 2033
- Table 56: Global Food Grade USP L-Glutamine Volume K Forecast, by Application 2020 & 2033
- Table 57: Global Food Grade USP L-Glutamine Revenue million Forecast, by Types 2020 & 2033
- Table 58: Global Food Grade USP L-Glutamine Volume K Forecast, by Types 2020 & 2033
- Table 59: Global Food Grade USP L-Glutamine Revenue million Forecast, by Country 2020 & 2033
- Table 60: Global Food Grade USP L-Glutamine Volume K Forecast, by Country 2020 & 2033
- Table 61: Turkey Food Grade USP L-Glutamine Revenue (million) Forecast, by Application 2020 & 2033
- Table 62: Turkey Food Grade USP L-Glutamine Volume (K) Forecast, by Application 2020 & 2033
- Table 63: Israel Food Grade USP L-Glutamine Revenue (million) Forecast, by Application 2020 & 2033
- Table 64: Israel Food Grade USP L-Glutamine Volume (K) Forecast, by Application 2020 & 2033
- Table 65: GCC Food Grade USP L-Glutamine Revenue (million) Forecast, by Application 2020 & 2033
- Table 66: GCC Food Grade USP L-Glutamine Volume (K) Forecast, by Application 2020 & 2033
- Table 67: North Africa Food Grade USP L-Glutamine Revenue (million) Forecast, by Application 2020 & 2033
- Table 68: North Africa Food Grade USP L-Glutamine Volume (K) Forecast, by Application 2020 & 2033
- Table 69: South Africa Food Grade USP L-Glutamine Revenue (million) Forecast, by Application 2020 & 2033
- Table 70: South Africa Food Grade USP L-Glutamine Volume (K) Forecast, by Application 2020 & 2033
- Table 71: Rest of Middle East & Africa Food Grade USP L-Glutamine Revenue (million) Forecast, by Application 2020 & 2033
- Table 72: Rest of Middle East & Africa Food Grade USP L-Glutamine Volume (K) Forecast, by Application 2020 & 2033
- Table 73: Global Food Grade USP L-Glutamine Revenue million Forecast, by Application 2020 & 2033
- Table 74: Global Food Grade USP L-Glutamine Volume K Forecast, by Application 2020 & 2033
- Table 75: Global Food Grade USP L-Glutamine Revenue million Forecast, by Types 2020 & 2033
- Table 76: Global Food Grade USP L-Glutamine Volume K Forecast, by Types 2020 & 2033
- Table 77: Global Food Grade USP L-Glutamine Revenue million Forecast, by Country 2020 & 2033
- Table 78: Global Food Grade USP L-Glutamine Volume K Forecast, by Country 2020 & 2033
- Table 79: China Food Grade USP L-Glutamine Revenue (million) Forecast, by Application 2020 & 2033
- Table 80: China Food Grade USP L-Glutamine Volume (K) Forecast, by Application 2020 & 2033
- Table 81: India Food Grade USP L-Glutamine Revenue (million) Forecast, by Application 2020 & 2033
- Table 82: India Food Grade USP L-Glutamine Volume (K) Forecast, by Application 2020 & 2033
- Table 83: Japan Food Grade USP L-Glutamine Revenue (million) Forecast, by Application 2020 & 2033
- Table 84: Japan Food Grade USP L-Glutamine Volume (K) Forecast, by Application 2020 & 2033
- Table 85: South Korea Food Grade USP L-Glutamine Revenue (million) Forecast, by Application 2020 & 2033
- Table 86: South Korea Food Grade USP L-Glutamine Volume (K) Forecast, by Application 2020 & 2033
- Table 87: ASEAN Food Grade USP L-Glutamine Revenue (million) Forecast, by Application 2020 & 2033
- Table 88: ASEAN Food Grade USP L-Glutamine Volume (K) Forecast, by Application 2020 & 2033
- Table 89: Oceania Food Grade USP L-Glutamine Revenue (million) Forecast, by Application 2020 & 2033
- Table 90: Oceania Food Grade USP L-Glutamine Volume (K) Forecast, by Application 2020 & 2033
- Table 91: Rest of Asia Pacific Food Grade USP L-Glutamine Revenue (million) Forecast, by Application 2020 & 2033
- Table 92: Rest of Asia Pacific Food Grade USP L-Glutamine Volume (K) Forecast, by Application 2020 & 2033
Frequently Asked Questions
1. What is the projected Compound Annual Growth Rate (CAGR) of the Food Grade USP L-Glutamine?
The projected CAGR is approximately 4.5%.
2. Which companies are prominent players in the Food Grade USP L-Glutamine?
Key companies in the market include MeiHua Holdings Group, Ajinomoto, Kyowa Hakko, Fufeng Group, Daesang.
3. What are the main segments of the Food Grade USP L-Glutamine?
The market segments include Application, Types.
4. Can you provide details about the market size?
The market size is estimated to be USD 93 million as of 2022.
5. What are some drivers contributing to market growth?
N/A
6. What are the notable trends driving market growth?
N/A
7. Are there any restraints impacting market growth?
N/A
8. Can you provide examples of recent developments in the market?
N/A
9. What pricing options are available for accessing the report?
Pricing options include single-user, multi-user, and enterprise licenses priced at USD 4350.00, USD 6525.00, and USD 8700.00 respectively.
10. Is the market size provided in terms of value or volume?
The market size is provided in terms of value, measured in million and volume, measured in K.
11. Are there any specific market keywords associated with the report?
Yes, the market keyword associated with the report is "Food Grade USP L-Glutamine," which aids in identifying and referencing the specific market segment covered.
12. How do I determine which pricing option suits my needs best?
The pricing options vary based on user requirements and access needs. Individual users may opt for single-user licenses, while businesses requiring broader access may choose multi-user or enterprise licenses for cost-effective access to the report.
13. Are there any additional resources or data provided in the Food Grade USP L-Glutamine report?
While the report offers comprehensive insights, it's advisable to review the specific contents or supplementary materials provided to ascertain if additional resources or data are available.
14. How can I stay updated on further developments or reports in the Food Grade USP L-Glutamine?
To stay informed about further developments, trends, and reports in the Food Grade USP L-Glutamine, consider subscribing to industry newsletters, following relevant companies and organizations, or regularly checking reputable industry news sources and publications.
Methodology
Step 1 - Identification of Relevant Samples Size from Population Database


Step 2 - Approaches for Defining Global Market Size (Value, Volume* & Price*)

Note*: In applicable scenarios
Step 3 - Data Sources
Primary Research
- Web Analytics
- Survey Reports
- Research Institute
- Latest Research Reports
- Opinion Leaders
Secondary Research
- Annual Reports
- White Paper
- Latest Press Release
- Industry Association
- Paid Database
- Investor Presentations

Step 4 - Data Triangulation
Involves using different sources of information in order to increase the validity of a study
These sources are likely to be stakeholders in a program - participants, other researchers, program staff, other community members, and so on.
Then we put all data in single framework & apply various statistical tools to find out the dynamic on the market.
During the analysis stage, feedback from the stakeholder groups would be compared to determine areas of agreement as well as areas of divergence