

Key Insights
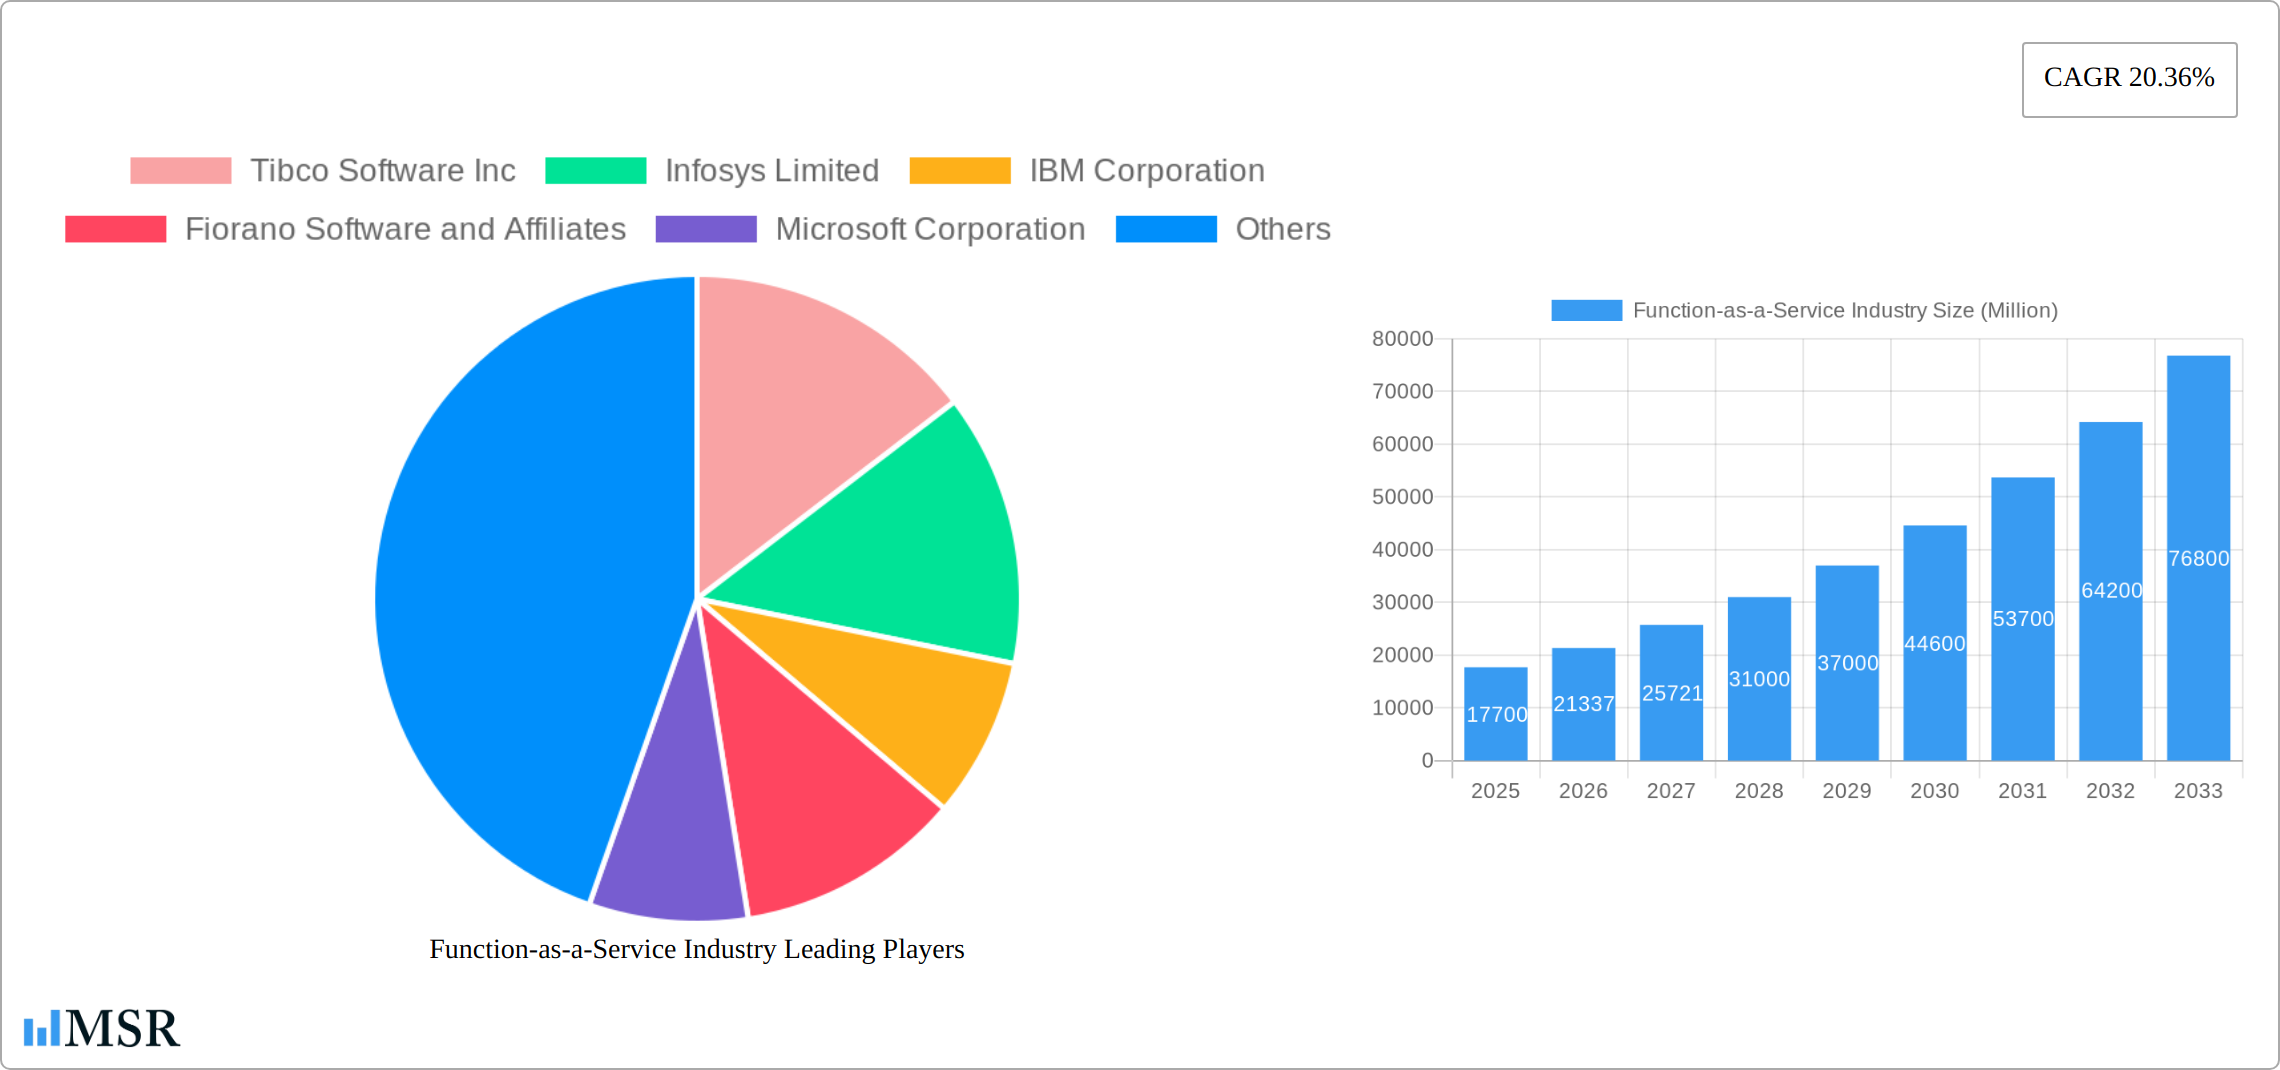
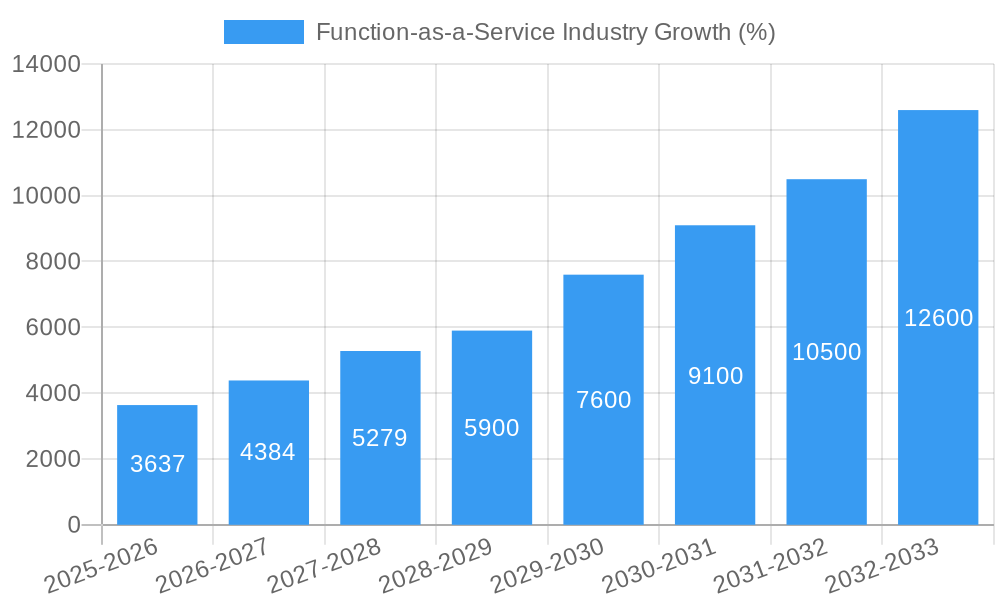
The Function-as-a-Service (FaaS) market is experiencing robust growth, projected to reach a market size of $17.70 billion in 2025 and exhibiting a Compound Annual Growth Rate (CAGR) of 20.36%. This expansion is fueled by several key drivers. The increasing adoption of cloud-native architectures, microservices, and serverless computing significantly contributes to the market's momentum. Businesses are increasingly seeking agile and cost-effective solutions to manage their applications and infrastructure, which FaaS provides through its pay-as-you-go pricing model and automated scaling capabilities. Furthermore, the rising demand for real-time data processing and event-driven architectures is driving adoption across various sectors, including BFSI (Banking, Financial Services, and Insurance), IT and Telecommunications, and Retail. The versatility of FaaS, enabling rapid deployment and scalability, makes it an attractive option for both small and medium-sized enterprises (SMEs) seeking to accelerate innovation and large enterprises aiming to optimize operational efficiency. Competitive advantages are being created through the use of sophisticated FaaS features such as automated scaling and robust monitoring tools allowing companies to react swiftly to changes in business needs.
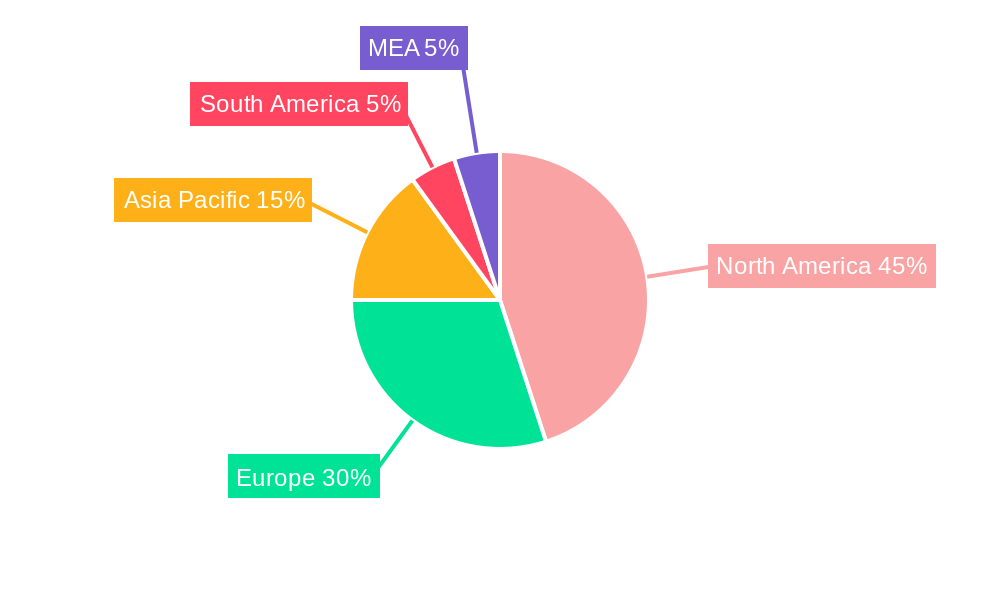
Despite its impressive growth, the FaaS market faces certain challenges. Security concerns related to data breaches and vulnerabilities in serverless environments remain a primary restraint. The need for specialized skills in developing and managing serverless applications presents a hurdle for some organizations, potentially hindering broader adoption. However, ongoing advancements in security technologies, the expanding availability of training and educational resources, and the emergence of management platforms are gradually mitigating these constraints. The market segmentation reveals significant opportunities across different deployment types (public, private, hybrid), organization sizes (SMEs, large enterprises), and end-user industries. North America currently holds a dominant market share, but the Asia-Pacific region is expected to witness significant growth in the coming years, driven by increasing digital transformation initiatives and cloud adoption across several nations. Key players like Amazon Web Services, Microsoft Azure, Google Cloud Platform, and IBM are heavily investing in FaaS offerings, further fostering market competition and innovation. The continuous evolution of FaaS, integrating advanced features like AI and machine learning capabilities, is poised to accelerate its penetration across diverse business applications.
Function-as-a-Service (FaaS) Industry Report: A Comprehensive Market Analysis (2019-2033)
This comprehensive report provides a detailed analysis of the Function-as-a-Service (FaaS) industry, offering invaluable insights into market dynamics, key players, and future growth prospects. The report covers the period from 2019 to 2033, with a focus on the estimated year 2025 and a forecast period of 2025-2033. This in-depth study is essential for industry stakeholders, investors, and businesses seeking to understand and capitalize on the significant opportunities within the rapidly evolving FaaS landscape. The global FaaS market is projected to reach xx Million by 2033, demonstrating robust growth potential.
Function-as-a-Service Industry Market Concentration & Dynamics
The Function-as-a-Service market exhibits a moderately concentrated landscape, with a few dominant players holding significant market share. However, the market is dynamic, characterized by continuous innovation, strategic mergers and acquisitions (M&A), and evolving regulatory frameworks. Major players such as Amazon Web Services (AWS), Microsoft Azure, and Google Cloud Platform (GCP) dominate the public cloud segment, while other companies like IBM, Oracle, and SAP contribute significantly to the overall market. The market concentration ratio (CR4) for 2024 is estimated at xx%, indicating a moderate level of concentration.
- Innovation Ecosystems: The FaaS market thrives on rapid technological advancements, fostering a vibrant ecosystem of startups and established players. Open-source contributions and community engagement further fuel innovation.
- Regulatory Frameworks: Government regulations regarding data privacy and security significantly impact the FaaS market, requiring providers to comply with evolving standards. The impact of GDPR, CCPA, and other similar regulations is a key factor in market dynamics.
- Substitute Products: Traditional on-premise infrastructure and other cloud computing models (e.g., IaaS, PaaS) compete with FaaS, although the unique advantages of serverless computing are driving market adoption.
- End-User Trends: Increasing demand for scalability, cost-efficiency, and faster deployment is driving the adoption of FaaS among diverse end-users. Businesses are increasingly adopting serverless architectures to streamline operations and reduce IT expenditure.
- M&A Activities: The number of M&A deals within the FaaS sector has shown a significant increase in recent years (xx deals in 2024). This indicates aggressive consolidation and expansion strategies among key players.
Function-as-a-Service Industry Industry Insights & Trends
The Function-as-a-Service (FaaS) market is experiencing rapid growth, driven by several key factors. The global market size reached xx Million in 2024 and is projected to experience a Compound Annual Growth Rate (CAGR) of xx% during the forecast period (2025-2033). This growth is fueled by the increasing adoption of cloud-native architectures, the rise of microservices, and the need for greater scalability and cost efficiency in application development. Furthermore, the increasing demand for real-time data processing and event-driven architectures is contributing to the expansion of the FaaS market. Technological disruptions, such as the development of serverless frameworks and improved containerization technologies, are further accelerating the market's growth. Evolving consumer behaviors, including a preference for on-demand services and pay-as-you-go pricing models, also play a significant role in driving FaaS adoption.
Key Markets & Segments Leading Function-as-a-Service Industry
The global FaaS market is segmented by type of cloud deployment (public, private, hybrid), organization size (SMEs, large enterprises), and end-user industry (BFSI, IT & Telecommunication, Retail, Healthcare & Life Sciences, Others).
Dominant Region/Country: North America currently dominates the FaaS market due to high cloud adoption rates and the presence of major cloud providers. However, Asia-Pacific is expected to witness significant growth in the coming years due to rising digitalization efforts and increasing internet penetration.
By Type of Cloud Deployment: The public cloud segment holds the largest market share due to its scalability, cost-effectiveness, and ease of access. However, private and hybrid cloud deployments are also growing in popularity as organizations seek to enhance security and control over their data.
By Organization Size: Large enterprises currently dominate the market owing to their substantial IT budgets and greater need for scalability. However, SMEs are increasingly adopting FaaS as they seek to streamline operations and reduce IT infrastructure costs.
By End-User: The BFSI, IT & Telecommunication, and Retail sectors are among the largest consumers of FaaS solutions. However, the Healthcare and Life Sciences sector is experiencing rapid growth as organizations seek to leverage FaaS for data analytics, AI, and other advanced technologies. Drivers include:
- Economic Growth: Strong economic growth in key regions fuels investment in IT infrastructure, including FaaS.
- Infrastructure Development: Increased investment in cloud infrastructure and improved internet connectivity supports FaaS adoption.
- Government Initiatives: Government policies promoting digital transformation and cloud adoption positively impact market growth.
Function-as-a-Service Industry Product Developments
Recent product developments in the FaaS industry have focused on enhancing scalability, security, and ease of use. Several providers have launched new serverless frameworks, improved container orchestration tools, and introduced advanced monitoring and management capabilities. These advancements aim to reduce the complexity of application development and deployment, providing developers with greater agility and flexibility. The integration of AI and machine learning into FaaS platforms is also gaining momentum, enabling developers to build more intelligent and responsive applications. This competition drives innovation and leads to more sophisticated and feature-rich FaaS offerings.
Challenges in the Function-as-a-Service Industry Market
The FaaS market faces several challenges, including:
- Vendor Lock-in: Dependence on specific FaaS providers can limit flexibility and increase switching costs.
- Security Concerns: Ensuring data security and compliance remains a critical challenge, especially with the increasing use of third-party services.
- Scalability Issues: Managing sudden traffic spikes and ensuring consistent performance can be difficult.
- Complexity: The complexity of serverless architectures can pose challenges for developers unfamiliar with the technology.
Forces Driving Function-as-a-Service Industry Growth
Several factors are driving the growth of the FaaS industry, including:
- Technological Advancements: Continuous innovation in serverless technologies, containerization, and microservices architectures.
- Cost Optimization: FaaS offers significant cost savings compared to traditional IT infrastructure.
- Enhanced Scalability: The ability to scale resources on demand is crucial for handling fluctuating workloads.
- Increased Agility: FaaS enables faster development cycles and quicker deployment of applications.
Challenges in the Function-as-a-Service Industry Market
Long-term growth in the FaaS market will depend on addressing challenges like improving developer experience and enhancing security features, along with continuous innovation in serverless technologies. Strategic partnerships and acquisitions will also play a crucial role in shaping the future landscape. Expanding into emerging markets and creating solutions for niche industries will further accelerate growth.
Emerging Opportunities in Function-as-a-Service Industry
Emerging opportunities in the FaaS industry include:
- Edge Computing: Expanding FaaS capabilities to edge devices for low-latency applications.
- AI & Machine Learning Integration: Integrating AI/ML capabilities into FaaS platforms to enhance application intelligence.
- Serverless Databases: Developing efficient serverless database solutions for seamless integration with FaaS functions.
- Specialized FaaS offerings: Catering to specific industries with tailored solutions.
Leading Players in the Function-as-a-Service Industry Sector
- Tibco Software Inc
- Infosys Limited
- IBM Corporation
- Fiorano Software and Affiliates
- Microsoft Corporation
- Amazon Web Services Inc
- Oracle Corporation
- Rogue Wave Software Inc
- Google Inc
- Dynatrace LLC
- SAP SE
Key Milestones in Function-as-a-Service Industry Industry
- March 2022: Microsoft Corp. launched advancements in cloud technology for healthcare and life sciences, including Azure Health Data Services, strengthening its position in this growing market segment.
- July 2022: Rackspace Technology launched the Rackspace Technology Cloud DNS v2 API, enhancing developer capabilities and expanding its multi-cloud service offerings.
- November 2022: Hewlett Packard Enterprise and VMware announced a further integration of HPE GreenLake and VMware Cloud, offering a more seamless hybrid cloud solution.
- December 2022: Tech Mahindra launched Cloud BlazeTech, an integrated platform aimed at optimizing economic value for cloud-powered organizations, demonstrating commitment to cloud services expansion.
Strategic Outlook for Function-as-a-Service Industry Market
The FaaS market is poised for significant growth, driven by the increasing adoption of cloud-native architectures and the demand for cost-effective and scalable solutions. Strategic partnerships, mergers and acquisitions, and continued innovation in serverless technologies will further shape the market landscape. The focus on security, compliance, and improved developer experiences will be crucial for long-term success. Expanding into new markets and developing industry-specific solutions will unlock significant growth potential.
Function-as-a-Service Industry Segmentation
-
1. Type of Cloud Deployment
- 1.1. Public
- 1.2. Private
- 1.3. Hybrid
-
2. Organization Size
- 2.1. Small and Medium Enterprises
- 2.2. Large Enterprises
-
3. End-User
- 3.1. BFSI
- 3.2. IT and Telecommunication
- 3.3. Retail
- 3.4. Healthcare and Life Sciences
- 3.5. Other En
Function-as-a-Service Industry Segmentation By Geography
- 1. North America
- 2. Europe
- 3. Asia Pacific
- 4. Rest of the World
Function-as-a-Service Industry REPORT HIGHLIGHTS
| Aspects | Details |
|---|---|
| Study Period | 2019-2033 |
| Base Year | 2024 |
| Estimated Year | 2025 |
| Forecast Period | 2025-2033 |
| Historical Period | 2019-2024 |
| Growth Rate | CAGR of 20.36% from 2019-2033 |
| Segmentation |
|
Table of Contents
- 1. Introduction
- 1.1. Research Scope
- 1.2. Market Segmentation
- 1.3. Research Methodology
- 1.4. Definitions and Assumptions
- 2. Executive Summary
- 2.1. Introduction
- 3. Market Dynamics
- 3.1. Introduction
- 3.2. Market Drivers
- 3.2.1. Growing shift towards serverless computing; Increasing focus towards agility of infrastructure and cost reduction
- 3.3. Market Restrains
- 3.3.1. Incompatibility of some applications with cloud environment
- 3.4. Market Trends
- 3.4.1. Hybrid Cloud to Drive the Growth of the Market for Security and Privacy Concerned End Users
- 4. Market Factor Analysis
- 4.1. Porters Five Forces
- 4.2. Supply/Value Chain
- 4.3. PESTEL analysis
- 4.4. Market Entropy
- 4.5. Patent/Trademark Analysis
- 5. Global Function-as-a-Service Industry Analysis, Insights and Forecast, 2019-2031
- 5.1. Market Analysis, Insights and Forecast - by Type of Cloud Deployment
- 5.1.1. Public
- 5.1.2. Private
- 5.1.3. Hybrid
- 5.2. Market Analysis, Insights and Forecast - by Organization Size
- 5.2.1. Small and Medium Enterprises
- 5.2.2. Large Enterprises
- 5.3. Market Analysis, Insights and Forecast - by End-User
- 5.3.1. BFSI
- 5.3.2. IT and Telecommunication
- 5.3.3. Retail
- 5.3.4. Healthcare and Life Sciences
- 5.3.5. Other En
- 5.4. Market Analysis, Insights and Forecast - by Region
- 5.4.1. North America
- 5.4.2. Europe
- 5.4.3. Asia Pacific
- 5.4.4. Rest of the World
- 5.1. Market Analysis, Insights and Forecast - by Type of Cloud Deployment
- 6. North America Function-as-a-Service Industry Analysis, Insights and Forecast, 2019-2031
- 6.1. Market Analysis, Insights and Forecast - by Type of Cloud Deployment
- 6.1.1. Public
- 6.1.2. Private
- 6.1.3. Hybrid
- 6.2. Market Analysis, Insights and Forecast - by Organization Size
- 6.2.1. Small and Medium Enterprises
- 6.2.2. Large Enterprises
- 6.3. Market Analysis, Insights and Forecast - by End-User
- 6.3.1. BFSI
- 6.3.2. IT and Telecommunication
- 6.3.3. Retail
- 6.3.4. Healthcare and Life Sciences
- 6.3.5. Other En
- 6.1. Market Analysis, Insights and Forecast - by Type of Cloud Deployment
- 7. Europe Function-as-a-Service Industry Analysis, Insights and Forecast, 2019-2031
- 7.1. Market Analysis, Insights and Forecast - by Type of Cloud Deployment
- 7.1.1. Public
- 7.1.2. Private
- 7.1.3. Hybrid
- 7.2. Market Analysis, Insights and Forecast - by Organization Size
- 7.2.1. Small and Medium Enterprises
- 7.2.2. Large Enterprises
- 7.3. Market Analysis, Insights and Forecast - by End-User
- 7.3.1. BFSI
- 7.3.2. IT and Telecommunication
- 7.3.3. Retail
- 7.3.4. Healthcare and Life Sciences
- 7.3.5. Other En
- 7.1. Market Analysis, Insights and Forecast - by Type of Cloud Deployment
- 8. Asia Pacific Function-as-a-Service Industry Analysis, Insights and Forecast, 2019-2031
- 8.1. Market Analysis, Insights and Forecast - by Type of Cloud Deployment
- 8.1.1. Public
- 8.1.2. Private
- 8.1.3. Hybrid
- 8.2. Market Analysis, Insights and Forecast - by Organization Size
- 8.2.1. Small and Medium Enterprises
- 8.2.2. Large Enterprises
- 8.3. Market Analysis, Insights and Forecast - by End-User
- 8.3.1. BFSI
- 8.3.2. IT and Telecommunication
- 8.3.3. Retail
- 8.3.4. Healthcare and Life Sciences
- 8.3.5. Other En
- 8.1. Market Analysis, Insights and Forecast - by Type of Cloud Deployment
- 9. Rest of the World Function-as-a-Service Industry Analysis, Insights and Forecast, 2019-2031
- 9.1. Market Analysis, Insights and Forecast - by Type of Cloud Deployment
- 9.1.1. Public
- 9.1.2. Private
- 9.1.3. Hybrid
- 9.2. Market Analysis, Insights and Forecast - by Organization Size
- 9.2.1. Small and Medium Enterprises
- 9.2.2. Large Enterprises
- 9.3. Market Analysis, Insights and Forecast - by End-User
- 9.3.1. BFSI
- 9.3.2. IT and Telecommunication
- 9.3.3. Retail
- 9.3.4. Healthcare and Life Sciences
- 9.3.5. Other En
- 9.1. Market Analysis, Insights and Forecast - by Type of Cloud Deployment
- 10. North America Function-as-a-Service Industry Analysis, Insights and Forecast, 2019-2031
- 10.1. Market Analysis, Insights and Forecast - By Country/Sub-region
- 10.1.1 United States
- 10.1.2 Canada
- 10.1.3 Mexico
- 11. Europe Function-as-a-Service Industry Analysis, Insights and Forecast, 2019-2031
- 11.1. Market Analysis, Insights and Forecast - By Country/Sub-region
- 11.1.1 Germany
- 11.1.2 United Kingdom
- 11.1.3 France
- 11.1.4 Spain
- 11.1.5 Italy
- 11.1.6 Spain
- 11.1.7 Belgium
- 11.1.8 Netherland
- 11.1.9 Nordics
- 11.1.10 Rest of Europe
- 12. Asia Pacific Function-as-a-Service Industry Analysis, Insights and Forecast, 2019-2031
- 12.1. Market Analysis, Insights and Forecast - By Country/Sub-region
- 12.1.1 China
- 12.1.2 Japan
- 12.1.3 India
- 12.1.4 South Korea
- 12.1.5 Southeast Asia
- 12.1.6 Australia
- 12.1.7 Indonesia
- 12.1.8 Phillipes
- 12.1.9 Singapore
- 12.1.10 Thailandc
- 12.1.11 Rest of Asia Pacific
- 13. South America Function-as-a-Service Industry Analysis, Insights and Forecast, 2019-2031
- 13.1. Market Analysis, Insights and Forecast - By Country/Sub-region
- 13.1.1 Brazil
- 13.1.2 Argentina
- 13.1.3 Peru
- 13.1.4 Chile
- 13.1.5 Colombia
- 13.1.6 Ecuador
- 13.1.7 Venezuela
- 13.1.8 Rest of South America
- 14. North America Function-as-a-Service Industry Analysis, Insights and Forecast, 2019-2031
- 14.1. Market Analysis, Insights and Forecast - By Country/Sub-region
- 14.1.1 United States
- 14.1.2 Canada
- 14.1.3 Mexico
- 15. MEA Function-as-a-Service Industry Analysis, Insights and Forecast, 2019-2031
- 15.1. Market Analysis, Insights and Forecast - By Country/Sub-region
- 15.1.1 United Arab Emirates
- 15.1.2 Saudi Arabia
- 15.1.3 South Africa
- 15.1.4 Rest of Middle East and Africa
- 16. Competitive Analysis
- 16.1. Global Market Share Analysis 2024
- 16.2. Company Profiles
- 16.2.1 Tibco Software Inc
- 16.2.1.1. Overview
- 16.2.1.2. Products
- 16.2.1.3. SWOT Analysis
- 16.2.1.4. Recent Developments
- 16.2.1.5. Financials (Based on Availability)
- 16.2.2 Infosys Limited
- 16.2.2.1. Overview
- 16.2.2.2. Products
- 16.2.2.3. SWOT Analysis
- 16.2.2.4. Recent Developments
- 16.2.2.5. Financials (Based on Availability)
- 16.2.3 IBM Corporation
- 16.2.3.1. Overview
- 16.2.3.2. Products
- 16.2.3.3. SWOT Analysis
- 16.2.3.4. Recent Developments
- 16.2.3.5. Financials (Based on Availability)
- 16.2.4 Fiorano Software and Affiliates
- 16.2.4.1. Overview
- 16.2.4.2. Products
- 16.2.4.3. SWOT Analysis
- 16.2.4.4. Recent Developments
- 16.2.4.5. Financials (Based on Availability)
- 16.2.5 Microsoft Corporation
- 16.2.5.1. Overview
- 16.2.5.2. Products
- 16.2.5.3. SWOT Analysis
- 16.2.5.4. Recent Developments
- 16.2.5.5. Financials (Based on Availability)
- 16.2.6 Amazon Web Services Inc
- 16.2.6.1. Overview
- 16.2.6.2. Products
- 16.2.6.3. SWOT Analysis
- 16.2.6.4. Recent Developments
- 16.2.6.5. Financials (Based on Availability)
- 16.2.7 Oracle Corporation
- 16.2.7.1. Overview
- 16.2.7.2. Products
- 16.2.7.3. SWOT Analysis
- 16.2.7.4. Recent Developments
- 16.2.7.5. Financials (Based on Availability)
- 16.2.8 Rogue Wave Software Inc
- 16.2.8.1. Overview
- 16.2.8.2. Products
- 16.2.8.3. SWOT Analysis
- 16.2.8.4. Recent Developments
- 16.2.8.5. Financials (Based on Availability)
- 16.2.9 Google Inc
- 16.2.9.1. Overview
- 16.2.9.2. Products
- 16.2.9.3. SWOT Analysis
- 16.2.9.4. Recent Developments
- 16.2.9.5. Financials (Based on Availability)
- 16.2.10 Dynatrace LLC
- 16.2.10.1. Overview
- 16.2.10.2. Products
- 16.2.10.3. SWOT Analysis
- 16.2.10.4. Recent Developments
- 16.2.10.5. Financials (Based on Availability)
- 16.2.11 SAP SE
- 16.2.11.1. Overview
- 16.2.11.2. Products
- 16.2.11.3. SWOT Analysis
- 16.2.11.4. Recent Developments
- 16.2.11.5. Financials (Based on Availability)
- 16.2.1 Tibco Software Inc
List of Figures
- Figure 1: Global Function-as-a-Service Industry Revenue Breakdown (Million, %) by Region 2024 & 2032
- Figure 2: Global Function-as-a-Service Industry Volume Breakdown (K Unit, %) by Region 2024 & 2032
- Figure 3: North America Function-as-a-Service Industry Revenue (Million), by Country 2024 & 2032
- Figure 4: North America Function-as-a-Service Industry Volume (K Unit), by Country 2024 & 2032
- Figure 5: North America Function-as-a-Service Industry Revenue Share (%), by Country 2024 & 2032
- Figure 6: North America Function-as-a-Service Industry Volume Share (%), by Country 2024 & 2032
- Figure 7: Europe Function-as-a-Service Industry Revenue (Million), by Country 2024 & 2032
- Figure 8: Europe Function-as-a-Service Industry Volume (K Unit), by Country 2024 & 2032
- Figure 9: Europe Function-as-a-Service Industry Revenue Share (%), by Country 2024 & 2032
- Figure 10: Europe Function-as-a-Service Industry Volume Share (%), by Country 2024 & 2032
- Figure 11: Asia Pacific Function-as-a-Service Industry Revenue (Million), by Country 2024 & 2032
- Figure 12: Asia Pacific Function-as-a-Service Industry Volume (K Unit), by Country 2024 & 2032
- Figure 13: Asia Pacific Function-as-a-Service Industry Revenue Share (%), by Country 2024 & 2032
- Figure 14: Asia Pacific Function-as-a-Service Industry Volume Share (%), by Country 2024 & 2032
- Figure 15: South America Function-as-a-Service Industry Revenue (Million), by Country 2024 & 2032
- Figure 16: South America Function-as-a-Service Industry Volume (K Unit), by Country 2024 & 2032
- Figure 17: South America Function-as-a-Service Industry Revenue Share (%), by Country 2024 & 2032
- Figure 18: South America Function-as-a-Service Industry Volume Share (%), by Country 2024 & 2032
- Figure 19: North America Function-as-a-Service Industry Revenue (Million), by Country 2024 & 2032
- Figure 20: North America Function-as-a-Service Industry Volume (K Unit), by Country 2024 & 2032
- Figure 21: North America Function-as-a-Service Industry Revenue Share (%), by Country 2024 & 2032
- Figure 22: North America Function-as-a-Service Industry Volume Share (%), by Country 2024 & 2032
- Figure 23: MEA Function-as-a-Service Industry Revenue (Million), by Country 2024 & 2032
- Figure 24: MEA Function-as-a-Service Industry Volume (K Unit), by Country 2024 & 2032
- Figure 25: MEA Function-as-a-Service Industry Revenue Share (%), by Country 2024 & 2032
- Figure 26: MEA Function-as-a-Service Industry Volume Share (%), by Country 2024 & 2032
- Figure 27: North America Function-as-a-Service Industry Revenue (Million), by Type of Cloud Deployment 2024 & 2032
- Figure 28: North America Function-as-a-Service Industry Volume (K Unit), by Type of Cloud Deployment 2024 & 2032
- Figure 29: North America Function-as-a-Service Industry Revenue Share (%), by Type of Cloud Deployment 2024 & 2032
- Figure 30: North America Function-as-a-Service Industry Volume Share (%), by Type of Cloud Deployment 2024 & 2032
- Figure 31: North America Function-as-a-Service Industry Revenue (Million), by Organization Size 2024 & 2032
- Figure 32: North America Function-as-a-Service Industry Volume (K Unit), by Organization Size 2024 & 2032
- Figure 33: North America Function-as-a-Service Industry Revenue Share (%), by Organization Size 2024 & 2032
- Figure 34: North America Function-as-a-Service Industry Volume Share (%), by Organization Size 2024 & 2032
- Figure 35: North America Function-as-a-Service Industry Revenue (Million), by End-User 2024 & 2032
- Figure 36: North America Function-as-a-Service Industry Volume (K Unit), by End-User 2024 & 2032
- Figure 37: North America Function-as-a-Service Industry Revenue Share (%), by End-User 2024 & 2032
- Figure 38: North America Function-as-a-Service Industry Volume Share (%), by End-User 2024 & 2032
- Figure 39: North America Function-as-a-Service Industry Revenue (Million), by Country 2024 & 2032
- Figure 40: North America Function-as-a-Service Industry Volume (K Unit), by Country 2024 & 2032
- Figure 41: North America Function-as-a-Service Industry Revenue Share (%), by Country 2024 & 2032
- Figure 42: North America Function-as-a-Service Industry Volume Share (%), by Country 2024 & 2032
- Figure 43: Europe Function-as-a-Service Industry Revenue (Million), by Type of Cloud Deployment 2024 & 2032
- Figure 44: Europe Function-as-a-Service Industry Volume (K Unit), by Type of Cloud Deployment 2024 & 2032
- Figure 45: Europe Function-as-a-Service Industry Revenue Share (%), by Type of Cloud Deployment 2024 & 2032
- Figure 46: Europe Function-as-a-Service Industry Volume Share (%), by Type of Cloud Deployment 2024 & 2032
- Figure 47: Europe Function-as-a-Service Industry Revenue (Million), by Organization Size 2024 & 2032
- Figure 48: Europe Function-as-a-Service Industry Volume (K Unit), by Organization Size 2024 & 2032
- Figure 49: Europe Function-as-a-Service Industry Revenue Share (%), by Organization Size 2024 & 2032
- Figure 50: Europe Function-as-a-Service Industry Volume Share (%), by Organization Size 2024 & 2032
- Figure 51: Europe Function-as-a-Service Industry Revenue (Million), by End-User 2024 & 2032
- Figure 52: Europe Function-as-a-Service Industry Volume (K Unit), by End-User 2024 & 2032
- Figure 53: Europe Function-as-a-Service Industry Revenue Share (%), by End-User 2024 & 2032
- Figure 54: Europe Function-as-a-Service Industry Volume Share (%), by End-User 2024 & 2032
- Figure 55: Europe Function-as-a-Service Industry Revenue (Million), by Country 2024 & 2032
- Figure 56: Europe Function-as-a-Service Industry Volume (K Unit), by Country 2024 & 2032
- Figure 57: Europe Function-as-a-Service Industry Revenue Share (%), by Country 2024 & 2032
- Figure 58: Europe Function-as-a-Service Industry Volume Share (%), by Country 2024 & 2032
- Figure 59: Asia Pacific Function-as-a-Service Industry Revenue (Million), by Type of Cloud Deployment 2024 & 2032
- Figure 60: Asia Pacific Function-as-a-Service Industry Volume (K Unit), by Type of Cloud Deployment 2024 & 2032
- Figure 61: Asia Pacific Function-as-a-Service Industry Revenue Share (%), by Type of Cloud Deployment 2024 & 2032
- Figure 62: Asia Pacific Function-as-a-Service Industry Volume Share (%), by Type of Cloud Deployment 2024 & 2032
- Figure 63: Asia Pacific Function-as-a-Service Industry Revenue (Million), by Organization Size 2024 & 2032
- Figure 64: Asia Pacific Function-as-a-Service Industry Volume (K Unit), by Organization Size 2024 & 2032
- Figure 65: Asia Pacific Function-as-a-Service Industry Revenue Share (%), by Organization Size 2024 & 2032
- Figure 66: Asia Pacific Function-as-a-Service Industry Volume Share (%), by Organization Size 2024 & 2032
- Figure 67: Asia Pacific Function-as-a-Service Industry Revenue (Million), by End-User 2024 & 2032
- Figure 68: Asia Pacific Function-as-a-Service Industry Volume (K Unit), by End-User 2024 & 2032
- Figure 69: Asia Pacific Function-as-a-Service Industry Revenue Share (%), by End-User 2024 & 2032
- Figure 70: Asia Pacific Function-as-a-Service Industry Volume Share (%), by End-User 2024 & 2032
- Figure 71: Asia Pacific Function-as-a-Service Industry Revenue (Million), by Country 2024 & 2032
- Figure 72: Asia Pacific Function-as-a-Service Industry Volume (K Unit), by Country 2024 & 2032
- Figure 73: Asia Pacific Function-as-a-Service Industry Revenue Share (%), by Country 2024 & 2032
- Figure 74: Asia Pacific Function-as-a-Service Industry Volume Share (%), by Country 2024 & 2032
- Figure 75: Rest of the World Function-as-a-Service Industry Revenue (Million), by Type of Cloud Deployment 2024 & 2032
- Figure 76: Rest of the World Function-as-a-Service Industry Volume (K Unit), by Type of Cloud Deployment 2024 & 2032
- Figure 77: Rest of the World Function-as-a-Service Industry Revenue Share (%), by Type of Cloud Deployment 2024 & 2032
- Figure 78: Rest of the World Function-as-a-Service Industry Volume Share (%), by Type of Cloud Deployment 2024 & 2032
- Figure 79: Rest of the World Function-as-a-Service Industry Revenue (Million), by Organization Size 2024 & 2032
- Figure 80: Rest of the World Function-as-a-Service Industry Volume (K Unit), by Organization Size 2024 & 2032
- Figure 81: Rest of the World Function-as-a-Service Industry Revenue Share (%), by Organization Size 2024 & 2032
- Figure 82: Rest of the World Function-as-a-Service Industry Volume Share (%), by Organization Size 2024 & 2032
- Figure 83: Rest of the World Function-as-a-Service Industry Revenue (Million), by End-User 2024 & 2032
- Figure 84: Rest of the World Function-as-a-Service Industry Volume (K Unit), by End-User 2024 & 2032
- Figure 85: Rest of the World Function-as-a-Service Industry Revenue Share (%), by End-User 2024 & 2032
- Figure 86: Rest of the World Function-as-a-Service Industry Volume Share (%), by End-User 2024 & 2032
- Figure 87: Rest of the World Function-as-a-Service Industry Revenue (Million), by Country 2024 & 2032
- Figure 88: Rest of the World Function-as-a-Service Industry Volume (K Unit), by Country 2024 & 2032
- Figure 89: Rest of the World Function-as-a-Service Industry Revenue Share (%), by Country 2024 & 2032
- Figure 90: Rest of the World Function-as-a-Service Industry Volume Share (%), by Country 2024 & 2032
List of Tables
- Table 1: Global Function-as-a-Service Industry Revenue Million Forecast, by Region 2019 & 2032
- Table 2: Global Function-as-a-Service Industry Volume K Unit Forecast, by Region 2019 & 2032
- Table 3: Global Function-as-a-Service Industry Revenue Million Forecast, by Type of Cloud Deployment 2019 & 2032
- Table 4: Global Function-as-a-Service Industry Volume K Unit Forecast, by Type of Cloud Deployment 2019 & 2032
- Table 5: Global Function-as-a-Service Industry Revenue Million Forecast, by Organization Size 2019 & 2032
- Table 6: Global Function-as-a-Service Industry Volume K Unit Forecast, by Organization Size 2019 & 2032
- Table 7: Global Function-as-a-Service Industry Revenue Million Forecast, by End-User 2019 & 2032
- Table 8: Global Function-as-a-Service Industry Volume K Unit Forecast, by End-User 2019 & 2032
- Table 9: Global Function-as-a-Service Industry Revenue Million Forecast, by Region 2019 & 2032
- Table 10: Global Function-as-a-Service Industry Volume K Unit Forecast, by Region 2019 & 2032
- Table 11: Global Function-as-a-Service Industry Revenue Million Forecast, by Country 2019 & 2032
- Table 12: Global Function-as-a-Service Industry Volume K Unit Forecast, by Country 2019 & 2032
- Table 13: United States Function-as-a-Service Industry Revenue (Million) Forecast, by Application 2019 & 2032
- Table 14: United States Function-as-a-Service Industry Volume (K Unit) Forecast, by Application 2019 & 2032
- Table 15: Canada Function-as-a-Service Industry Revenue (Million) Forecast, by Application 2019 & 2032
- Table 16: Canada Function-as-a-Service Industry Volume (K Unit) Forecast, by Application 2019 & 2032
- Table 17: Mexico Function-as-a-Service Industry Revenue (Million) Forecast, by Application 2019 & 2032
- Table 18: Mexico Function-as-a-Service Industry Volume (K Unit) Forecast, by Application 2019 & 2032
- Table 19: Global Function-as-a-Service Industry Revenue Million Forecast, by Country 2019 & 2032
- Table 20: Global Function-as-a-Service Industry Volume K Unit Forecast, by Country 2019 & 2032
- Table 21: Germany Function-as-a-Service Industry Revenue (Million) Forecast, by Application 2019 & 2032
- Table 22: Germany Function-as-a-Service Industry Volume (K Unit) Forecast, by Application 2019 & 2032
- Table 23: United Kingdom Function-as-a-Service Industry Revenue (Million) Forecast, by Application 2019 & 2032
- Table 24: United Kingdom Function-as-a-Service Industry Volume (K Unit) Forecast, by Application 2019 & 2032
- Table 25: France Function-as-a-Service Industry Revenue (Million) Forecast, by Application 2019 & 2032
- Table 26: France Function-as-a-Service Industry Volume (K Unit) Forecast, by Application 2019 & 2032
- Table 27: Spain Function-as-a-Service Industry Revenue (Million) Forecast, by Application 2019 & 2032
- Table 28: Spain Function-as-a-Service Industry Volume (K Unit) Forecast, by Application 2019 & 2032
- Table 29: Italy Function-as-a-Service Industry Revenue (Million) Forecast, by Application 2019 & 2032
- Table 30: Italy Function-as-a-Service Industry Volume (K Unit) Forecast, by Application 2019 & 2032
- Table 31: Spain Function-as-a-Service Industry Revenue (Million) Forecast, by Application 2019 & 2032
- Table 32: Spain Function-as-a-Service Industry Volume (K Unit) Forecast, by Application 2019 & 2032
- Table 33: Belgium Function-as-a-Service Industry Revenue (Million) Forecast, by Application 2019 & 2032
- Table 34: Belgium Function-as-a-Service Industry Volume (K Unit) Forecast, by Application 2019 & 2032
- Table 35: Netherland Function-as-a-Service Industry Revenue (Million) Forecast, by Application 2019 & 2032
- Table 36: Netherland Function-as-a-Service Industry Volume (K Unit) Forecast, by Application 2019 & 2032
- Table 37: Nordics Function-as-a-Service Industry Revenue (Million) Forecast, by Application 2019 & 2032
- Table 38: Nordics Function-as-a-Service Industry Volume (K Unit) Forecast, by Application 2019 & 2032
- Table 39: Rest of Europe Function-as-a-Service Industry Revenue (Million) Forecast, by Application 2019 & 2032
- Table 40: Rest of Europe Function-as-a-Service Industry Volume (K Unit) Forecast, by Application 2019 & 2032
- Table 41: Global Function-as-a-Service Industry Revenue Million Forecast, by Country 2019 & 2032
- Table 42: Global Function-as-a-Service Industry Volume K Unit Forecast, by Country 2019 & 2032
- Table 43: China Function-as-a-Service Industry Revenue (Million) Forecast, by Application 2019 & 2032
- Table 44: China Function-as-a-Service Industry Volume (K Unit) Forecast, by Application 2019 & 2032
- Table 45: Japan Function-as-a-Service Industry Revenue (Million) Forecast, by Application 2019 & 2032
- Table 46: Japan Function-as-a-Service Industry Volume (K Unit) Forecast, by Application 2019 & 2032
- Table 47: India Function-as-a-Service Industry Revenue (Million) Forecast, by Application 2019 & 2032
- Table 48: India Function-as-a-Service Industry Volume (K Unit) Forecast, by Application 2019 & 2032
- Table 49: South Korea Function-as-a-Service Industry Revenue (Million) Forecast, by Application 2019 & 2032
- Table 50: South Korea Function-as-a-Service Industry Volume (K Unit) Forecast, by Application 2019 & 2032
- Table 51: Southeast Asia Function-as-a-Service Industry Revenue (Million) Forecast, by Application 2019 & 2032
- Table 52: Southeast Asia Function-as-a-Service Industry Volume (K Unit) Forecast, by Application 2019 & 2032
- Table 53: Australia Function-as-a-Service Industry Revenue (Million) Forecast, by Application 2019 & 2032
- Table 54: Australia Function-as-a-Service Industry Volume (K Unit) Forecast, by Application 2019 & 2032
- Table 55: Indonesia Function-as-a-Service Industry Revenue (Million) Forecast, by Application 2019 & 2032
- Table 56: Indonesia Function-as-a-Service Industry Volume (K Unit) Forecast, by Application 2019 & 2032
- Table 57: Phillipes Function-as-a-Service Industry Revenue (Million) Forecast, by Application 2019 & 2032
- Table 58: Phillipes Function-as-a-Service Industry Volume (K Unit) Forecast, by Application 2019 & 2032
- Table 59: Singapore Function-as-a-Service Industry Revenue (Million) Forecast, by Application 2019 & 2032
- Table 60: Singapore Function-as-a-Service Industry Volume (K Unit) Forecast, by Application 2019 & 2032
- Table 61: Thailandc Function-as-a-Service Industry Revenue (Million) Forecast, by Application 2019 & 2032
- Table 62: Thailandc Function-as-a-Service Industry Volume (K Unit) Forecast, by Application 2019 & 2032
- Table 63: Rest of Asia Pacific Function-as-a-Service Industry Revenue (Million) Forecast, by Application 2019 & 2032
- Table 64: Rest of Asia Pacific Function-as-a-Service Industry Volume (K Unit) Forecast, by Application 2019 & 2032
- Table 65: Global Function-as-a-Service Industry Revenue Million Forecast, by Country 2019 & 2032
- Table 66: Global Function-as-a-Service Industry Volume K Unit Forecast, by Country 2019 & 2032
- Table 67: Brazil Function-as-a-Service Industry Revenue (Million) Forecast, by Application 2019 & 2032
- Table 68: Brazil Function-as-a-Service Industry Volume (K Unit) Forecast, by Application 2019 & 2032
- Table 69: Argentina Function-as-a-Service Industry Revenue (Million) Forecast, by Application 2019 & 2032
- Table 70: Argentina Function-as-a-Service Industry Volume (K Unit) Forecast, by Application 2019 & 2032
- Table 71: Peru Function-as-a-Service Industry Revenue (Million) Forecast, by Application 2019 & 2032
- Table 72: Peru Function-as-a-Service Industry Volume (K Unit) Forecast, by Application 2019 & 2032
- Table 73: Chile Function-as-a-Service Industry Revenue (Million) Forecast, by Application 2019 & 2032
- Table 74: Chile Function-as-a-Service Industry Volume (K Unit) Forecast, by Application 2019 & 2032
- Table 75: Colombia Function-as-a-Service Industry Revenue (Million) Forecast, by Application 2019 & 2032
- Table 76: Colombia Function-as-a-Service Industry Volume (K Unit) Forecast, by Application 2019 & 2032
- Table 77: Ecuador Function-as-a-Service Industry Revenue (Million) Forecast, by Application 2019 & 2032
- Table 78: Ecuador Function-as-a-Service Industry Volume (K Unit) Forecast, by Application 2019 & 2032
- Table 79: Venezuela Function-as-a-Service Industry Revenue (Million) Forecast, by Application 2019 & 2032
- Table 80: Venezuela Function-as-a-Service Industry Volume (K Unit) Forecast, by Application 2019 & 2032
- Table 81: Rest of South America Function-as-a-Service Industry Revenue (Million) Forecast, by Application 2019 & 2032
- Table 82: Rest of South America Function-as-a-Service Industry Volume (K Unit) Forecast, by Application 2019 & 2032
- Table 83: Global Function-as-a-Service Industry Revenue Million Forecast, by Country 2019 & 2032
- Table 84: Global Function-as-a-Service Industry Volume K Unit Forecast, by Country 2019 & 2032
- Table 85: United States Function-as-a-Service Industry Revenue (Million) Forecast, by Application 2019 & 2032
- Table 86: United States Function-as-a-Service Industry Volume (K Unit) Forecast, by Application 2019 & 2032
- Table 87: Canada Function-as-a-Service Industry Revenue (Million) Forecast, by Application 2019 & 2032
- Table 88: Canada Function-as-a-Service Industry Volume (K Unit) Forecast, by Application 2019 & 2032
- Table 89: Mexico Function-as-a-Service Industry Revenue (Million) Forecast, by Application 2019 & 2032
- Table 90: Mexico Function-as-a-Service Industry Volume (K Unit) Forecast, by Application 2019 & 2032
- Table 91: Global Function-as-a-Service Industry Revenue Million Forecast, by Country 2019 & 2032
- Table 92: Global Function-as-a-Service Industry Volume K Unit Forecast, by Country 2019 & 2032
- Table 93: United Arab Emirates Function-as-a-Service Industry Revenue (Million) Forecast, by Application 2019 & 2032
- Table 94: United Arab Emirates Function-as-a-Service Industry Volume (K Unit) Forecast, by Application 2019 & 2032
- Table 95: Saudi Arabia Function-as-a-Service Industry Revenue (Million) Forecast, by Application 2019 & 2032
- Table 96: Saudi Arabia Function-as-a-Service Industry Volume (K Unit) Forecast, by Application 2019 & 2032
- Table 97: South Africa Function-as-a-Service Industry Revenue (Million) Forecast, by Application 2019 & 2032
- Table 98: South Africa Function-as-a-Service Industry Volume (K Unit) Forecast, by Application 2019 & 2032
- Table 99: Rest of Middle East and Africa Function-as-a-Service Industry Revenue (Million) Forecast, by Application 2019 & 2032
- Table 100: Rest of Middle East and Africa Function-as-a-Service Industry Volume (K Unit) Forecast, by Application 2019 & 2032
- Table 101: Global Function-as-a-Service Industry Revenue Million Forecast, by Type of Cloud Deployment 2019 & 2032
- Table 102: Global Function-as-a-Service Industry Volume K Unit Forecast, by Type of Cloud Deployment 2019 & 2032
- Table 103: Global Function-as-a-Service Industry Revenue Million Forecast, by Organization Size 2019 & 2032
- Table 104: Global Function-as-a-Service Industry Volume K Unit Forecast, by Organization Size 2019 & 2032
- Table 105: Global Function-as-a-Service Industry Revenue Million Forecast, by End-User 2019 & 2032
- Table 106: Global Function-as-a-Service Industry Volume K Unit Forecast, by End-User 2019 & 2032
- Table 107: Global Function-as-a-Service Industry Revenue Million Forecast, by Country 2019 & 2032
- Table 108: Global Function-as-a-Service Industry Volume K Unit Forecast, by Country 2019 & 2032
- Table 109: Global Function-as-a-Service Industry Revenue Million Forecast, by Type of Cloud Deployment 2019 & 2032
- Table 110: Global Function-as-a-Service Industry Volume K Unit Forecast, by Type of Cloud Deployment 2019 & 2032
- Table 111: Global Function-as-a-Service Industry Revenue Million Forecast, by Organization Size 2019 & 2032
- Table 112: Global Function-as-a-Service Industry Volume K Unit Forecast, by Organization Size 2019 & 2032
- Table 113: Global Function-as-a-Service Industry Revenue Million Forecast, by End-User 2019 & 2032
- Table 114: Global Function-as-a-Service Industry Volume K Unit Forecast, by End-User 2019 & 2032
- Table 115: Global Function-as-a-Service Industry Revenue Million Forecast, by Country 2019 & 2032
- Table 116: Global Function-as-a-Service Industry Volume K Unit Forecast, by Country 2019 & 2032
- Table 117: Global Function-as-a-Service Industry Revenue Million Forecast, by Type of Cloud Deployment 2019 & 2032
- Table 118: Global Function-as-a-Service Industry Volume K Unit Forecast, by Type of Cloud Deployment 2019 & 2032
- Table 119: Global Function-as-a-Service Industry Revenue Million Forecast, by Organization Size 2019 & 2032
- Table 120: Global Function-as-a-Service Industry Volume K Unit Forecast, by Organization Size 2019 & 2032
- Table 121: Global Function-as-a-Service Industry Revenue Million Forecast, by End-User 2019 & 2032
- Table 122: Global Function-as-a-Service Industry Volume K Unit Forecast, by End-User 2019 & 2032
- Table 123: Global Function-as-a-Service Industry Revenue Million Forecast, by Country 2019 & 2032
- Table 124: Global Function-as-a-Service Industry Volume K Unit Forecast, by Country 2019 & 2032
- Table 125: Global Function-as-a-Service Industry Revenue Million Forecast, by Type of Cloud Deployment 2019 & 2032
- Table 126: Global Function-as-a-Service Industry Volume K Unit Forecast, by Type of Cloud Deployment 2019 & 2032
- Table 127: Global Function-as-a-Service Industry Revenue Million Forecast, by Organization Size 2019 & 2032
- Table 128: Global Function-as-a-Service Industry Volume K Unit Forecast, by Organization Size 2019 & 2032
- Table 129: Global Function-as-a-Service Industry Revenue Million Forecast, by End-User 2019 & 2032
- Table 130: Global Function-as-a-Service Industry Volume K Unit Forecast, by End-User 2019 & 2032
- Table 131: Global Function-as-a-Service Industry Revenue Million Forecast, by Country 2019 & 2032
- Table 132: Global Function-as-a-Service Industry Volume K Unit Forecast, by Country 2019 & 2032
Frequently Asked Questions
1. What is the projected Compound Annual Growth Rate (CAGR) of the Function-as-a-Service Industry?
The projected CAGR is approximately 20.36%.
2. Which companies are prominent players in the Function-as-a-Service Industry?
Key companies in the market include Tibco Software Inc, Infosys Limited, IBM Corporation, Fiorano Software and Affiliates, Microsoft Corporation, Amazon Web Services Inc, Oracle Corporation, Rogue Wave Software Inc, Google Inc, Dynatrace LLC, SAP SE.
3. What are the main segments of the Function-as-a-Service Industry?
The market segments include Type of Cloud Deployment, Organization Size, End-User.
4. Can you provide details about the market size?
The market size is estimated to be USD 17.70 Million as of 2022.
5. What are some drivers contributing to market growth?
Growing shift towards serverless computing; Increasing focus towards agility of infrastructure and cost reduction.
6. What are the notable trends driving market growth?
Hybrid Cloud to Drive the Growth of the Market for Security and Privacy Concerned End Users.
7. Are there any restraints impacting market growth?
Incompatibility of some applications with cloud environment.
8. Can you provide examples of recent developments in the market?
December 2022: To optimize economic value for cloud-powered organizations worldwide, Tech Mahindra, a leading provider of digital transformation, consultancy, and business re-engineering services and solutions, launched Cloud BlazeTech, an integrated, industry-neutral platform. To accelerate business digital transformation, the firm will continue to invest in cloud services & ties with hyperscalers.
9. What pricing options are available for accessing the report?
Pricing options include single-user, multi-user, and enterprise licenses priced at USD 4750, USD 5250, and USD 8750 respectively.
10. Is the market size provided in terms of value or volume?
The market size is provided in terms of value, measured in Million and volume, measured in K Unit.
11. Are there any specific market keywords associated with the report?
Yes, the market keyword associated with the report is "Function-as-a-Service Industry," which aids in identifying and referencing the specific market segment covered.
12. How do I determine which pricing option suits my needs best?
The pricing options vary based on user requirements and access needs. Individual users may opt for single-user licenses, while businesses requiring broader access may choose multi-user or enterprise licenses for cost-effective access to the report.
13. Are there any additional resources or data provided in the Function-as-a-Service Industry report?
While the report offers comprehensive insights, it's advisable to review the specific contents or supplementary materials provided to ascertain if additional resources or data are available.
14. How can I stay updated on further developments or reports in the Function-as-a-Service Industry?
To stay informed about further developments, trends, and reports in the Function-as-a-Service Industry, consider subscribing to industry newsletters, following relevant companies and organizations, or regularly checking reputable industry news sources and publications.
Methodology
Step 1 - Identification of Relevant Samples Size from Population Database


Step 2 - Approaches for Defining Global Market Size (Value, Volume* & Price*)

Note*: In applicable scenarios
Step 3 - Data Sources
Primary Research
- Web Analytics
- Survey Reports
- Research Institute
- Latest Research Reports
- Opinion Leaders
Secondary Research
- Annual Reports
- White Paper
- Latest Press Release
- Industry Association
- Paid Database
- Investor Presentations

Step 4 - Data Triangulation
Involves using different sources of information in order to increase the validity of a study
These sources are likely to be stakeholders in a program - participants, other researchers, program staff, other community members, and so on.
Then we put all data in single framework & apply various statistical tools to find out the dynamic on the market.
During the analysis stage, feedback from the stakeholder groups would be compared to determine areas of agreement as well as areas of divergence
