

Key Insights
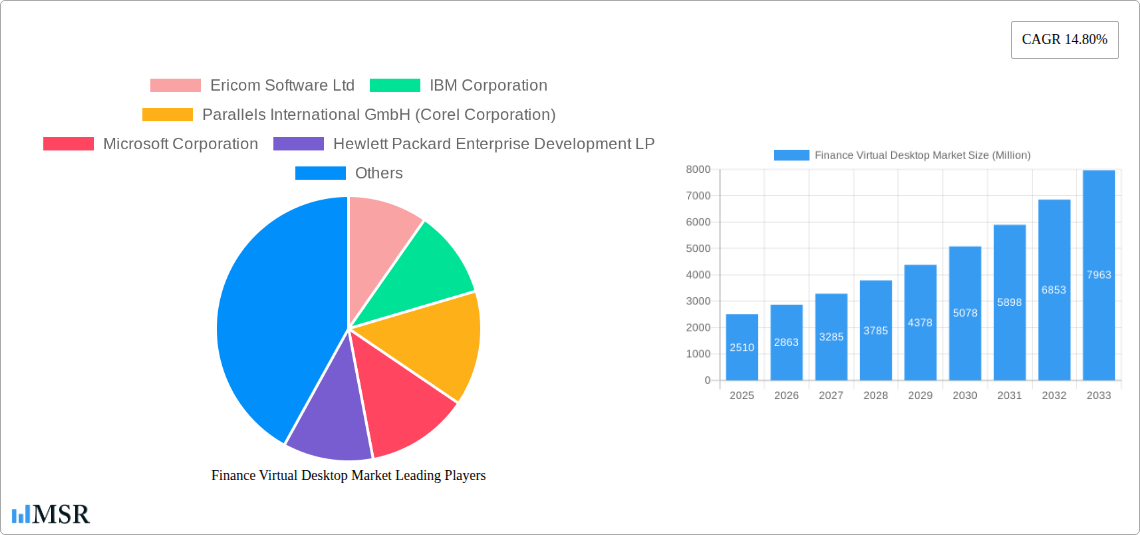
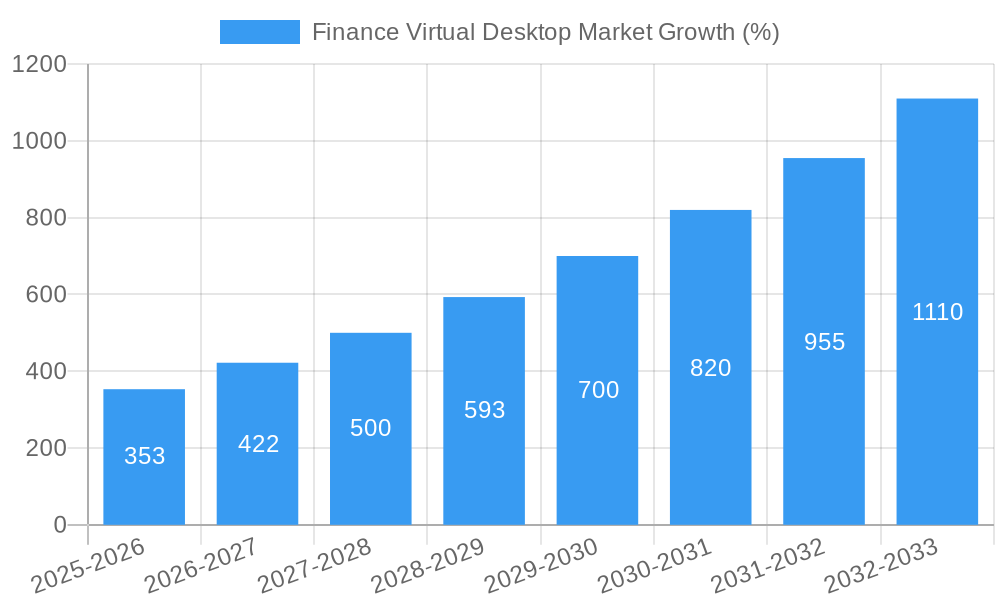
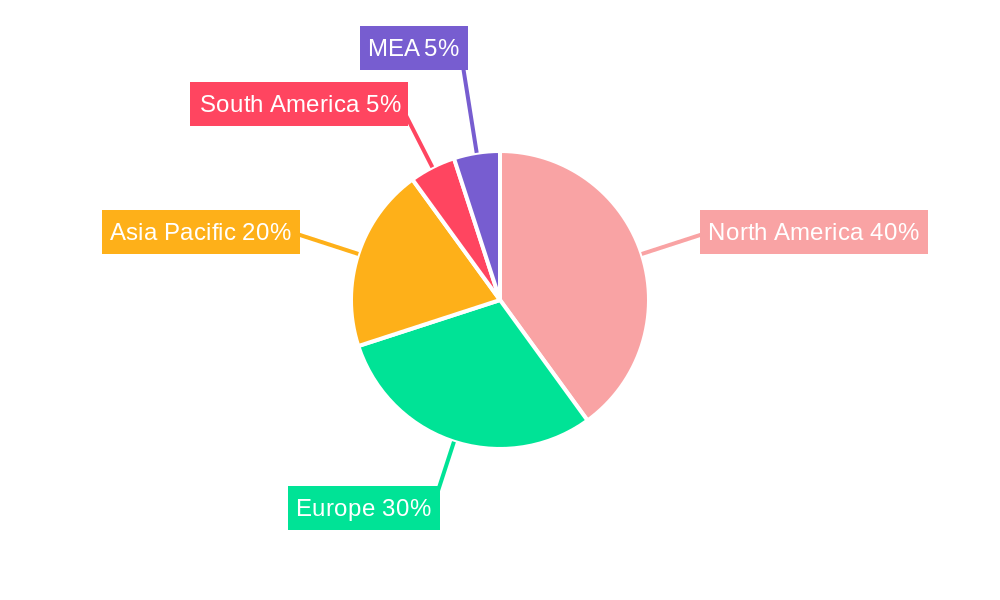
The global Finance Virtual Desktop (FVD) market is experiencing robust growth, projected to reach \$2.51 billion in 2025 and maintain a Compound Annual Growth Rate (CAGR) of 14.80% from 2025 to 2033. This expansion is driven by several key factors. The increasing adoption of cloud-based solutions within the finance sector enhances security, scalability, and cost-effectiveness, fueling demand for FVDs. Regulatory compliance mandates and the need for secure remote access to sensitive financial data are further accelerating market growth. Furthermore, the rising adoption of BYOD (Bring Your Own Device) policies and the increasing need for flexible work arrangements are pushing organizations to embrace FVDs for their enhanced security and streamlined management capabilities. The market is segmented by delivery platform (Hosted Virtual Desktop, Hosted Shared Desktop, and others) and deployment mode (on-premises and cloud), with the cloud segment expected to dominate due to its inherent flexibility and cost advantages. North America currently holds a significant market share, driven by early adoption and a well-established IT infrastructure. However, regions like Asia-Pacific are witnessing rapid growth, fueled by increasing digitalization and expanding financial services sectors.
Competitive intensity within the FVD market is high, with major players such as Citrix, Microsoft, and IBM competing alongside specialized providers like Ericom Software and Parallels. These companies are actively investing in R&D to enhance features like enhanced security, improved performance, and seamless integration with existing financial applications. The future growth of the FVD market will be influenced by advancements in virtualization technologies, increased cybersecurity threats, and the evolving regulatory landscape within the finance industry. Continued innovation in delivering secure, scalable, and cost-effective solutions will be crucial for vendors to maintain their market positions in this rapidly evolving space. The ongoing trend towards hybrid and multi-cloud environments will also present opportunities for vendors who can provide flexible and adaptable FVD solutions.
Finance Virtual Desktop Market: A Comprehensive Report (2019-2033)
This in-depth report provides a comprehensive analysis of the Finance Virtual Desktop Market, offering invaluable insights for industry stakeholders, investors, and strategic decision-makers. Covering the period from 2019 to 2033, with a focus on 2025, this report delves into market dynamics, key trends, leading players, and future growth opportunities within the rapidly evolving landscape of finance virtual desktops. The global market size is projected to reach xx Million by 2033, exhibiting a CAGR of xx% during the forecast period (2025-2033).
Finance Virtual Desktop Market Concentration & Dynamics
The Finance Virtual Desktop Market exhibits a moderately concentrated landscape, with several key players holding significant market share. However, the market is also characterized by a dynamic ecosystem of innovation, driven by technological advancements and evolving regulatory frameworks. Substitute products, such as traditional desktop solutions, continue to compete, but the advantages of VDI in terms of cost-effectiveness, scalability, and security are increasingly driving adoption. End-user trends show a preference for cloud-based solutions and increased emphasis on data security.
Market Concentration Metrics (2024 Estimates):
- Top 5 players account for approximately xx% of the market share.
- Average market share of top 10 players: xx%
- Number of M&A deals in the last 5 years: xx
Key Dynamics:
- Innovation Ecosystem: Significant investments in R&D are driving innovations in security, scalability, and user experience.
- Regulatory Frameworks: Compliance requirements (e.g., GDPR, CCPA) influence market strategies and product development.
- Substitute Products: Traditional desktop solutions and other remote access technologies offer competition.
- End-User Trends: Growing demand for secure, scalable, and cost-effective solutions within the finance sector.
- M&A Activities: Recent acquisitions, such as the February 2023 acquisition of NetCom Systems by Coretelligent, highlight the consolidation trend within the market.
Finance Virtual Desktop Market Industry Insights & Trends
The Finance Virtual Desktop Market is experiencing robust growth, fueled by several key factors. The increasing adoption of cloud computing, the growing need for enhanced security and compliance, and the rising demand for remote work capabilities are major drivers. Technological disruptions, such as the introduction of innovative VDI solutions like Amazon WorkSpaces Core, are further accelerating market expansion. Consumer behavior is shifting towards flexible and secure access to financial applications, favoring the adoption of VDI solutions. Market size reached approximately xx Million in 2024, and is projected to reach xx Million by 2025.
Key Markets & Segments Leading Finance Virtual Desktop Market
The cloud deployment mode segment holds a dominant position in the Finance Virtual Desktop Market, driven by its inherent scalability, flexibility, and cost-effectiveness. Similarly, the Hosted Virtual Desktop (HVD) segment dominates the market in terms of desktop delivery platforms, due to its superior performance and security features. The North American region shows strong market dominance, attributed to robust IT infrastructure, high technological adoption rates, and significant investments in financial technologies.
Key Drivers:
- By Deployment Mode:
- Cloud: Scalability, cost-efficiency, accessibility.
- On-premises: Enhanced control over data and security.
- By Desktop Delivery Platform:
- Hosted Virtual Desktop (HVD): Superior performance, security.
- Hosted Shared Desktop (HSD): Cost-effectiveness for basic needs.
- Other Desktop Delivery Platform: Niche applications and specific requirements.
Dominance Analysis: The North American market's strong growth is primarily fueled by increased regulatory compliance needs and the high concentration of financial institutions in the region. The cloud-based deployment model is also rapidly gaining traction due to its flexible cost structure and scalability benefits for organizations of all sizes within the financial sector.
Finance Virtual Desktop Market Product Developments
Recent product innovations focus on enhancing security, improving user experience, and optimizing performance. Advancements in technologies like AI and machine learning are being integrated to improve resource allocation and enhance security features. These developments are providing competitive edges by offering superior solutions to cater to the specific needs of financial institutions.
Challenges in the Finance Virtual Desktop Market Market
Significant challenges exist within the Finance Virtual Desktop Market, including regulatory compliance costs, stringent security requirements, and the complexities of integrating VDI solutions with legacy systems. Supply chain disruptions also pose a significant risk, particularly regarding the availability of specialized hardware and software components. Furthermore, intense competition among established players and emerging startups puts pressure on pricing and profit margins.
Forces Driving Finance Virtual Desktop Market Growth
The Finance Virtual Desktop Market is driven by several key factors. The increasing need for remote access to financial applications, coupled with the demand for enhanced security and regulatory compliance, is a primary driver. Technological advancements, such as the development of more sophisticated and secure VDI platforms, are also contributing significantly to market expansion. Government initiatives supporting digital transformation within the financial sector further accelerate adoption.
Long-Term Growth Catalysts in Finance Virtual Desktop Market
Long-term growth will be fueled by continued innovation in VDI technologies, strategic partnerships between technology providers and financial institutions, and expansion into new and emerging markets. The increasing adoption of hybrid cloud models and the integration of advanced security features will be crucial growth drivers.
Emerging Opportunities in Finance Virtual Desktop Market
Emerging opportunities lie in the expansion into underserved markets, leveraging advancements in AI and machine learning for enhanced security and performance optimization, and the development of tailored solutions for specific financial applications. The rise of edge computing and the demand for seamless integration with other financial technologies present significant growth avenues.
Leading Players in the Finance Virtual Desktop Market Sector
- Ericom Software Ltd
- IBM Corporation
- Parallels International GmbH (Corel Corporation)
- Microsoft Corporation
- Hewlett Packard Enterprise Development LP
- Dell Inc
- NComputing Co Ltd
- Huawei Technologies Co Ltd
- Evolve IP LLC
- Citrix Systems Inc
Key Milestones in Finance Virtual Desktop Market Industry
- September 2022: AWS launched Amazon WorkSpaces Core, a fully managed VDI solution, significantly impacting the market by offering a highly scalable and secure option.
- February 2023: The acquisition of NetCom Systems by Coretelligent expanded Coretelligent's VDI capabilities and market presence. This consolidation highlights the ongoing industry mergers and acquisitions activity.
Strategic Outlook for Finance Virtual Desktop Market Market
The Finance Virtual Desktop Market is poised for continued strong growth, driven by sustained technological advancements, increasing demand for secure remote access, and regulatory compliance needs. Strategic opportunities exist for companies that can offer innovative, secure, and scalable solutions tailored to the specific needs of financial institutions. The focus on enhancing security features, improving user experience, and expanding into new markets will be key to unlocking future market potential.
Finance Virtual Desktop Market Segmentation
-
1. Desktop Delivery Platform
- 1.1. Hosted Virtual Desktop (HVD)
- 1.2. Hosted Shared Desktop (HSD)
- 1.3. Other Desktop Delivery Platform
-
2. Deployment Mode
- 2.1. On-premises
- 2.2. Cloud
Finance Virtual Desktop Market Segmentation By Geography
- 1. North America
- 2. Europe
- 3. Asia
- 4. Australia and New Zealand
- 5. Latin America
- 6. Middle East and Africa
Finance Virtual Desktop Market REPORT HIGHLIGHTS
| Aspects | Details |
|---|---|
| Study Period | 2019-2033 |
| Base Year | 2024 |
| Estimated Year | 2025 |
| Forecast Period | 2025-2033 |
| Historical Period | 2019-2024 |
| Growth Rate | CAGR of 14.80% from 2019-2033 |
| Segmentation |
|
Table of Contents
- 1. Introduction
- 1.1. Research Scope
- 1.2. Market Segmentation
- 1.3. Research Methodology
- 1.4. Definitions and Assumptions
- 2. Executive Summary
- 2.1. Introduction
- 3. Market Dynamics
- 3.1. Introduction
- 3.2. Market Drivers
- 3.2.1. Increasing Adoption of Cloud Services in Financial Institutions; Desktop Virtualization Supports Inorganic Growth
- 3.3. Market Restrains
- 3.3.1. Infrastructural Constraints of Enterprises will Act as a Challenge for the Growth of the Market; Lack of Skilled Professionals
- 3.4. Market Trends
- 3.4.1. Increasing Adoption of Cloud Services in Financial Institutions to Drive the Market Growth
- 4. Market Factor Analysis
- 4.1. Porters Five Forces
- 4.2. Supply/Value Chain
- 4.3. PESTEL analysis
- 4.4. Market Entropy
- 4.5. Patent/Trademark Analysis
- 5. Global Finance Virtual Desktop Market Analysis, Insights and Forecast, 2019-2031
- 5.1. Market Analysis, Insights and Forecast - by Desktop Delivery Platform
- 5.1.1. Hosted Virtual Desktop (HVD)
- 5.1.2. Hosted Shared Desktop (HSD)
- 5.1.3. Other Desktop Delivery Platform
- 5.2. Market Analysis, Insights and Forecast - by Deployment Mode
- 5.2.1. On-premises
- 5.2.2. Cloud
- 5.3. Market Analysis, Insights and Forecast - by Region
- 5.3.1. North America
- 5.3.2. Europe
- 5.3.3. Asia
- 5.3.4. Australia and New Zealand
- 5.3.5. Latin America
- 5.3.6. Middle East and Africa
- 5.1. Market Analysis, Insights and Forecast - by Desktop Delivery Platform
- 6. North America Finance Virtual Desktop Market Analysis, Insights and Forecast, 2019-2031
- 6.1. Market Analysis, Insights and Forecast - by Desktop Delivery Platform
- 6.1.1. Hosted Virtual Desktop (HVD)
- 6.1.2. Hosted Shared Desktop (HSD)
- 6.1.3. Other Desktop Delivery Platform
- 6.2. Market Analysis, Insights and Forecast - by Deployment Mode
- 6.2.1. On-premises
- 6.2.2. Cloud
- 6.1. Market Analysis, Insights and Forecast - by Desktop Delivery Platform
- 7. Europe Finance Virtual Desktop Market Analysis, Insights and Forecast, 2019-2031
- 7.1. Market Analysis, Insights and Forecast - by Desktop Delivery Platform
- 7.1.1. Hosted Virtual Desktop (HVD)
- 7.1.2. Hosted Shared Desktop (HSD)
- 7.1.3. Other Desktop Delivery Platform
- 7.2. Market Analysis, Insights and Forecast - by Deployment Mode
- 7.2.1. On-premises
- 7.2.2. Cloud
- 7.1. Market Analysis, Insights and Forecast - by Desktop Delivery Platform
- 8. Asia Finance Virtual Desktop Market Analysis, Insights and Forecast, 2019-2031
- 8.1. Market Analysis, Insights and Forecast - by Desktop Delivery Platform
- 8.1.1. Hosted Virtual Desktop (HVD)
- 8.1.2. Hosted Shared Desktop (HSD)
- 8.1.3. Other Desktop Delivery Platform
- 8.2. Market Analysis, Insights and Forecast - by Deployment Mode
- 8.2.1. On-premises
- 8.2.2. Cloud
- 8.1. Market Analysis, Insights and Forecast - by Desktop Delivery Platform
- 9. Australia and New Zealand Finance Virtual Desktop Market Analysis, Insights and Forecast, 2019-2031
- 9.1. Market Analysis, Insights and Forecast - by Desktop Delivery Platform
- 9.1.1. Hosted Virtual Desktop (HVD)
- 9.1.2. Hosted Shared Desktop (HSD)
- 9.1.3. Other Desktop Delivery Platform
- 9.2. Market Analysis, Insights and Forecast - by Deployment Mode
- 9.2.1. On-premises
- 9.2.2. Cloud
- 9.1. Market Analysis, Insights and Forecast - by Desktop Delivery Platform
- 10. Latin America Finance Virtual Desktop Market Analysis, Insights and Forecast, 2019-2031
- 10.1. Market Analysis, Insights and Forecast - by Desktop Delivery Platform
- 10.1.1. Hosted Virtual Desktop (HVD)
- 10.1.2. Hosted Shared Desktop (HSD)
- 10.1.3. Other Desktop Delivery Platform
- 10.2. Market Analysis, Insights and Forecast - by Deployment Mode
- 10.2.1. On-premises
- 10.2.2. Cloud
- 10.1. Market Analysis, Insights and Forecast - by Desktop Delivery Platform
- 11. Middle East and Africa Finance Virtual Desktop Market Analysis, Insights and Forecast, 2019-2031
- 11.1. Market Analysis, Insights and Forecast - by Desktop Delivery Platform
- 11.1.1. Hosted Virtual Desktop (HVD)
- 11.1.2. Hosted Shared Desktop (HSD)
- 11.1.3. Other Desktop Delivery Platform
- 11.2. Market Analysis, Insights and Forecast - by Deployment Mode
- 11.2.1. On-premises
- 11.2.2. Cloud
- 11.1. Market Analysis, Insights and Forecast - by Desktop Delivery Platform
- 12. North America Finance Virtual Desktop Market Analysis, Insights and Forecast, 2019-2031
- 12.1. Market Analysis, Insights and Forecast - By Country/Sub-region
- 12.1.1 United States
- 12.1.2 Canada
- 12.1.3 Mexico
- 13. Europe Finance Virtual Desktop Market Analysis, Insights and Forecast, 2019-2031
- 13.1. Market Analysis, Insights and Forecast - By Country/Sub-region
- 13.1.1 Germany
- 13.1.2 United Kingdom
- 13.1.3 France
- 13.1.4 Spain
- 13.1.5 Italy
- 13.1.6 Spain
- 13.1.7 Belgium
- 13.1.8 Netherland
- 13.1.9 Nordics
- 13.1.10 Rest of Europe
- 14. Asia Pacific Finance Virtual Desktop Market Analysis, Insights and Forecast, 2019-2031
- 14.1. Market Analysis, Insights and Forecast - By Country/Sub-region
- 14.1.1 China
- 14.1.2 Japan
- 14.1.3 India
- 14.1.4 South Korea
- 14.1.5 Southeast Asia
- 14.1.6 Australia
- 14.1.7 Indonesia
- 14.1.8 Phillipes
- 14.1.9 Singapore
- 14.1.10 Thailandc
- 14.1.11 Rest of Asia Pacific
- 15. South America Finance Virtual Desktop Market Analysis, Insights and Forecast, 2019-2031
- 15.1. Market Analysis, Insights and Forecast - By Country/Sub-region
- 15.1.1 Brazil
- 15.1.2 Argentina
- 15.1.3 Peru
- 15.1.4 Chile
- 15.1.5 Colombia
- 15.1.6 Ecuador
- 15.1.7 Venezuela
- 15.1.8 Rest of South America
- 16. North America Finance Virtual Desktop Market Analysis, Insights and Forecast, 2019-2031
- 16.1. Market Analysis, Insights and Forecast - By Country/Sub-region
- 16.1.1 United States
- 16.1.2 Canada
- 16.1.3 Mexico
- 17. MEA Finance Virtual Desktop Market Analysis, Insights and Forecast, 2019-2031
- 17.1. Market Analysis, Insights and Forecast - By Country/Sub-region
- 17.1.1 United Arab Emirates
- 17.1.2 Saudi Arabia
- 17.1.3 South Africa
- 17.1.4 Rest of Middle East and Africa
- 18. Competitive Analysis
- 18.1. Global Market Share Analysis 2024
- 18.2. Company Profiles
- 18.2.1 Ericom Software Ltd
- 18.2.1.1. Overview
- 18.2.1.2. Products
- 18.2.1.3. SWOT Analysis
- 18.2.1.4. Recent Developments
- 18.2.1.5. Financials (Based on Availability)
- 18.2.2 IBM Corporation
- 18.2.2.1. Overview
- 18.2.2.2. Products
- 18.2.2.3. SWOT Analysis
- 18.2.2.4. Recent Developments
- 18.2.2.5. Financials (Based on Availability)
- 18.2.3 Parallels International GmbH (Corel Corporation)
- 18.2.3.1. Overview
- 18.2.3.2. Products
- 18.2.3.3. SWOT Analysis
- 18.2.3.4. Recent Developments
- 18.2.3.5. Financials (Based on Availability)
- 18.2.4 Microsoft Corporation
- 18.2.4.1. Overview
- 18.2.4.2. Products
- 18.2.4.3. SWOT Analysis
- 18.2.4.4. Recent Developments
- 18.2.4.5. Financials (Based on Availability)
- 18.2.5 Hewlett Packard Enterprise Development LP
- 18.2.5.1. Overview
- 18.2.5.2. Products
- 18.2.5.3. SWOT Analysis
- 18.2.5.4. Recent Developments
- 18.2.5.5. Financials (Based on Availability)
- 18.2.6 Dell Inc
- 18.2.6.1. Overview
- 18.2.6.2. Products
- 18.2.6.3. SWOT Analysis
- 18.2.6.4. Recent Developments
- 18.2.6.5. Financials (Based on Availability)
- 18.2.7 NComputing Co Ltd
- 18.2.7.1. Overview
- 18.2.7.2. Products
- 18.2.7.3. SWOT Analysis
- 18.2.7.4. Recent Developments
- 18.2.7.5. Financials (Based on Availability)
- 18.2.8 Huawei Technologies Co Ltd
- 18.2.8.1. Overview
- 18.2.8.2. Products
- 18.2.8.3. SWOT Analysis
- 18.2.8.4. Recent Developments
- 18.2.8.5. Financials (Based on Availability)
- 18.2.9 Evolve IP LLC
- 18.2.9.1. Overview
- 18.2.9.2. Products
- 18.2.9.3. SWOT Analysis
- 18.2.9.4. Recent Developments
- 18.2.9.5. Financials (Based on Availability)
- 18.2.10 Citrix Systems Inc
- 18.2.10.1. Overview
- 18.2.10.2. Products
- 18.2.10.3. SWOT Analysis
- 18.2.10.4. Recent Developments
- 18.2.10.5. Financials (Based on Availability)
- 18.2.1 Ericom Software Ltd
List of Figures
- Figure 1: Global Finance Virtual Desktop Market Revenue Breakdown (Million, %) by Region 2024 & 2032
- Figure 2: North America Finance Virtual Desktop Market Revenue (Million), by Country 2024 & 2032
- Figure 3: North America Finance Virtual Desktop Market Revenue Share (%), by Country 2024 & 2032
- Figure 4: Europe Finance Virtual Desktop Market Revenue (Million), by Country 2024 & 2032
- Figure 5: Europe Finance Virtual Desktop Market Revenue Share (%), by Country 2024 & 2032
- Figure 6: Asia Pacific Finance Virtual Desktop Market Revenue (Million), by Country 2024 & 2032
- Figure 7: Asia Pacific Finance Virtual Desktop Market Revenue Share (%), by Country 2024 & 2032
- Figure 8: South America Finance Virtual Desktop Market Revenue (Million), by Country 2024 & 2032
- Figure 9: South America Finance Virtual Desktop Market Revenue Share (%), by Country 2024 & 2032
- Figure 10: North America Finance Virtual Desktop Market Revenue (Million), by Country 2024 & 2032
- Figure 11: North America Finance Virtual Desktop Market Revenue Share (%), by Country 2024 & 2032
- Figure 12: MEA Finance Virtual Desktop Market Revenue (Million), by Country 2024 & 2032
- Figure 13: MEA Finance Virtual Desktop Market Revenue Share (%), by Country 2024 & 2032
- Figure 14: North America Finance Virtual Desktop Market Revenue (Million), by Desktop Delivery Platform 2024 & 2032
- Figure 15: North America Finance Virtual Desktop Market Revenue Share (%), by Desktop Delivery Platform 2024 & 2032
- Figure 16: North America Finance Virtual Desktop Market Revenue (Million), by Deployment Mode 2024 & 2032
- Figure 17: North America Finance Virtual Desktop Market Revenue Share (%), by Deployment Mode 2024 & 2032
- Figure 18: North America Finance Virtual Desktop Market Revenue (Million), by Country 2024 & 2032
- Figure 19: North America Finance Virtual Desktop Market Revenue Share (%), by Country 2024 & 2032
- Figure 20: Europe Finance Virtual Desktop Market Revenue (Million), by Desktop Delivery Platform 2024 & 2032
- Figure 21: Europe Finance Virtual Desktop Market Revenue Share (%), by Desktop Delivery Platform 2024 & 2032
- Figure 22: Europe Finance Virtual Desktop Market Revenue (Million), by Deployment Mode 2024 & 2032
- Figure 23: Europe Finance Virtual Desktop Market Revenue Share (%), by Deployment Mode 2024 & 2032
- Figure 24: Europe Finance Virtual Desktop Market Revenue (Million), by Country 2024 & 2032
- Figure 25: Europe Finance Virtual Desktop Market Revenue Share (%), by Country 2024 & 2032
- Figure 26: Asia Finance Virtual Desktop Market Revenue (Million), by Desktop Delivery Platform 2024 & 2032
- Figure 27: Asia Finance Virtual Desktop Market Revenue Share (%), by Desktop Delivery Platform 2024 & 2032
- Figure 28: Asia Finance Virtual Desktop Market Revenue (Million), by Deployment Mode 2024 & 2032
- Figure 29: Asia Finance Virtual Desktop Market Revenue Share (%), by Deployment Mode 2024 & 2032
- Figure 30: Asia Finance Virtual Desktop Market Revenue (Million), by Country 2024 & 2032
- Figure 31: Asia Finance Virtual Desktop Market Revenue Share (%), by Country 2024 & 2032
- Figure 32: Australia and New Zealand Finance Virtual Desktop Market Revenue (Million), by Desktop Delivery Platform 2024 & 2032
- Figure 33: Australia and New Zealand Finance Virtual Desktop Market Revenue Share (%), by Desktop Delivery Platform 2024 & 2032
- Figure 34: Australia and New Zealand Finance Virtual Desktop Market Revenue (Million), by Deployment Mode 2024 & 2032
- Figure 35: Australia and New Zealand Finance Virtual Desktop Market Revenue Share (%), by Deployment Mode 2024 & 2032
- Figure 36: Australia and New Zealand Finance Virtual Desktop Market Revenue (Million), by Country 2024 & 2032
- Figure 37: Australia and New Zealand Finance Virtual Desktop Market Revenue Share (%), by Country 2024 & 2032
- Figure 38: Latin America Finance Virtual Desktop Market Revenue (Million), by Desktop Delivery Platform 2024 & 2032
- Figure 39: Latin America Finance Virtual Desktop Market Revenue Share (%), by Desktop Delivery Platform 2024 & 2032
- Figure 40: Latin America Finance Virtual Desktop Market Revenue (Million), by Deployment Mode 2024 & 2032
- Figure 41: Latin America Finance Virtual Desktop Market Revenue Share (%), by Deployment Mode 2024 & 2032
- Figure 42: Latin America Finance Virtual Desktop Market Revenue (Million), by Country 2024 & 2032
- Figure 43: Latin America Finance Virtual Desktop Market Revenue Share (%), by Country 2024 & 2032
- Figure 44: Middle East and Africa Finance Virtual Desktop Market Revenue (Million), by Desktop Delivery Platform 2024 & 2032
- Figure 45: Middle East and Africa Finance Virtual Desktop Market Revenue Share (%), by Desktop Delivery Platform 2024 & 2032
- Figure 46: Middle East and Africa Finance Virtual Desktop Market Revenue (Million), by Deployment Mode 2024 & 2032
- Figure 47: Middle East and Africa Finance Virtual Desktop Market Revenue Share (%), by Deployment Mode 2024 & 2032
- Figure 48: Middle East and Africa Finance Virtual Desktop Market Revenue (Million), by Country 2024 & 2032
- Figure 49: Middle East and Africa Finance Virtual Desktop Market Revenue Share (%), by Country 2024 & 2032
List of Tables
- Table 1: Global Finance Virtual Desktop Market Revenue Million Forecast, by Region 2019 & 2032
- Table 2: Global Finance Virtual Desktop Market Revenue Million Forecast, by Desktop Delivery Platform 2019 & 2032
- Table 3: Global Finance Virtual Desktop Market Revenue Million Forecast, by Deployment Mode 2019 & 2032
- Table 4: Global Finance Virtual Desktop Market Revenue Million Forecast, by Region 2019 & 2032
- Table 5: Global Finance Virtual Desktop Market Revenue Million Forecast, by Country 2019 & 2032
- Table 6: United States Finance Virtual Desktop Market Revenue (Million) Forecast, by Application 2019 & 2032
- Table 7: Canada Finance Virtual Desktop Market Revenue (Million) Forecast, by Application 2019 & 2032
- Table 8: Mexico Finance Virtual Desktop Market Revenue (Million) Forecast, by Application 2019 & 2032
- Table 9: Global Finance Virtual Desktop Market Revenue Million Forecast, by Country 2019 & 2032
- Table 10: Germany Finance Virtual Desktop Market Revenue (Million) Forecast, by Application 2019 & 2032
- Table 11: United Kingdom Finance Virtual Desktop Market Revenue (Million) Forecast, by Application 2019 & 2032
- Table 12: France Finance Virtual Desktop Market Revenue (Million) Forecast, by Application 2019 & 2032
- Table 13: Spain Finance Virtual Desktop Market Revenue (Million) Forecast, by Application 2019 & 2032
- Table 14: Italy Finance Virtual Desktop Market Revenue (Million) Forecast, by Application 2019 & 2032
- Table 15: Spain Finance Virtual Desktop Market Revenue (Million) Forecast, by Application 2019 & 2032
- Table 16: Belgium Finance Virtual Desktop Market Revenue (Million) Forecast, by Application 2019 & 2032
- Table 17: Netherland Finance Virtual Desktop Market Revenue (Million) Forecast, by Application 2019 & 2032
- Table 18: Nordics Finance Virtual Desktop Market Revenue (Million) Forecast, by Application 2019 & 2032
- Table 19: Rest of Europe Finance Virtual Desktop Market Revenue (Million) Forecast, by Application 2019 & 2032
- Table 20: Global Finance Virtual Desktop Market Revenue Million Forecast, by Country 2019 & 2032
- Table 21: China Finance Virtual Desktop Market Revenue (Million) Forecast, by Application 2019 & 2032
- Table 22: Japan Finance Virtual Desktop Market Revenue (Million) Forecast, by Application 2019 & 2032
- Table 23: India Finance Virtual Desktop Market Revenue (Million) Forecast, by Application 2019 & 2032
- Table 24: South Korea Finance Virtual Desktop Market Revenue (Million) Forecast, by Application 2019 & 2032
- Table 25: Southeast Asia Finance Virtual Desktop Market Revenue (Million) Forecast, by Application 2019 & 2032
- Table 26: Australia Finance Virtual Desktop Market Revenue (Million) Forecast, by Application 2019 & 2032
- Table 27: Indonesia Finance Virtual Desktop Market Revenue (Million) Forecast, by Application 2019 & 2032
- Table 28: Phillipes Finance Virtual Desktop Market Revenue (Million) Forecast, by Application 2019 & 2032
- Table 29: Singapore Finance Virtual Desktop Market Revenue (Million) Forecast, by Application 2019 & 2032
- Table 30: Thailandc Finance Virtual Desktop Market Revenue (Million) Forecast, by Application 2019 & 2032
- Table 31: Rest of Asia Pacific Finance Virtual Desktop Market Revenue (Million) Forecast, by Application 2019 & 2032
- Table 32: Global Finance Virtual Desktop Market Revenue Million Forecast, by Country 2019 & 2032
- Table 33: Brazil Finance Virtual Desktop Market Revenue (Million) Forecast, by Application 2019 & 2032
- Table 34: Argentina Finance Virtual Desktop Market Revenue (Million) Forecast, by Application 2019 & 2032
- Table 35: Peru Finance Virtual Desktop Market Revenue (Million) Forecast, by Application 2019 & 2032
- Table 36: Chile Finance Virtual Desktop Market Revenue (Million) Forecast, by Application 2019 & 2032
- Table 37: Colombia Finance Virtual Desktop Market Revenue (Million) Forecast, by Application 2019 & 2032
- Table 38: Ecuador Finance Virtual Desktop Market Revenue (Million) Forecast, by Application 2019 & 2032
- Table 39: Venezuela Finance Virtual Desktop Market Revenue (Million) Forecast, by Application 2019 & 2032
- Table 40: Rest of South America Finance Virtual Desktop Market Revenue (Million) Forecast, by Application 2019 & 2032
- Table 41: Global Finance Virtual Desktop Market Revenue Million Forecast, by Country 2019 & 2032
- Table 42: United States Finance Virtual Desktop Market Revenue (Million) Forecast, by Application 2019 & 2032
- Table 43: Canada Finance Virtual Desktop Market Revenue (Million) Forecast, by Application 2019 & 2032
- Table 44: Mexico Finance Virtual Desktop Market Revenue (Million) Forecast, by Application 2019 & 2032
- Table 45: Global Finance Virtual Desktop Market Revenue Million Forecast, by Country 2019 & 2032
- Table 46: United Arab Emirates Finance Virtual Desktop Market Revenue (Million) Forecast, by Application 2019 & 2032
- Table 47: Saudi Arabia Finance Virtual Desktop Market Revenue (Million) Forecast, by Application 2019 & 2032
- Table 48: South Africa Finance Virtual Desktop Market Revenue (Million) Forecast, by Application 2019 & 2032
- Table 49: Rest of Middle East and Africa Finance Virtual Desktop Market Revenue (Million) Forecast, by Application 2019 & 2032
- Table 50: Global Finance Virtual Desktop Market Revenue Million Forecast, by Desktop Delivery Platform 2019 & 2032
- Table 51: Global Finance Virtual Desktop Market Revenue Million Forecast, by Deployment Mode 2019 & 2032
- Table 52: Global Finance Virtual Desktop Market Revenue Million Forecast, by Country 2019 & 2032
- Table 53: Global Finance Virtual Desktop Market Revenue Million Forecast, by Desktop Delivery Platform 2019 & 2032
- Table 54: Global Finance Virtual Desktop Market Revenue Million Forecast, by Deployment Mode 2019 & 2032
- Table 55: Global Finance Virtual Desktop Market Revenue Million Forecast, by Country 2019 & 2032
- Table 56: Global Finance Virtual Desktop Market Revenue Million Forecast, by Desktop Delivery Platform 2019 & 2032
- Table 57: Global Finance Virtual Desktop Market Revenue Million Forecast, by Deployment Mode 2019 & 2032
- Table 58: Global Finance Virtual Desktop Market Revenue Million Forecast, by Country 2019 & 2032
- Table 59: Global Finance Virtual Desktop Market Revenue Million Forecast, by Desktop Delivery Platform 2019 & 2032
- Table 60: Global Finance Virtual Desktop Market Revenue Million Forecast, by Deployment Mode 2019 & 2032
- Table 61: Global Finance Virtual Desktop Market Revenue Million Forecast, by Country 2019 & 2032
- Table 62: Global Finance Virtual Desktop Market Revenue Million Forecast, by Desktop Delivery Platform 2019 & 2032
- Table 63: Global Finance Virtual Desktop Market Revenue Million Forecast, by Deployment Mode 2019 & 2032
- Table 64: Global Finance Virtual Desktop Market Revenue Million Forecast, by Country 2019 & 2032
- Table 65: Global Finance Virtual Desktop Market Revenue Million Forecast, by Desktop Delivery Platform 2019 & 2032
- Table 66: Global Finance Virtual Desktop Market Revenue Million Forecast, by Deployment Mode 2019 & 2032
- Table 67: Global Finance Virtual Desktop Market Revenue Million Forecast, by Country 2019 & 2032
Frequently Asked Questions
1. What is the projected Compound Annual Growth Rate (CAGR) of the Finance Virtual Desktop Market?
The projected CAGR is approximately 14.80%.
2. Which companies are prominent players in the Finance Virtual Desktop Market?
Key companies in the market include Ericom Software Ltd, IBM Corporation, Parallels International GmbH (Corel Corporation), Microsoft Corporation, Hewlett Packard Enterprise Development LP, Dell Inc, NComputing Co Ltd, Huawei Technologies Co Ltd, Evolve IP LLC, Citrix Systems Inc.
3. What are the main segments of the Finance Virtual Desktop Market?
The market segments include Desktop Delivery Platform, Deployment Mode.
4. Can you provide details about the market size?
The market size is estimated to be USD 2.51 Million as of 2022.
5. What are some drivers contributing to market growth?
Increasing Adoption of Cloud Services in Financial Institutions; Desktop Virtualization Supports Inorganic Growth.
6. What are the notable trends driving market growth?
Increasing Adoption of Cloud Services in Financial Institutions to Drive the Market Growth.
7. Are there any restraints impacting market growth?
Infrastructural Constraints of Enterprises will Act as a Challenge for the Growth of the Market; Lack of Skilled Professionals.
8. Can you provide examples of recent developments in the market?
February 2023: Norwest Equity Partners (NEP), a prominent middle-market investment firm, and Coretelligent, a United States-based IT service management firm, announced the acquisition of NetCom Systems, Inc. The acquisition adds network and cloud infrastructure, application administration, and virtual desktop infrastructure (VDI) to Coretelligent's currently secure infrastructure, enhancing current resources and providing critical redundancies.
9. What pricing options are available for accessing the report?
Pricing options include single-user, multi-user, and enterprise licenses priced at USD 4750, USD 5250, and USD 8750 respectively.
10. Is the market size provided in terms of value or volume?
The market size is provided in terms of value, measured in Million.
11. Are there any specific market keywords associated with the report?
Yes, the market keyword associated with the report is "Finance Virtual Desktop Market," which aids in identifying and referencing the specific market segment covered.
12. How do I determine which pricing option suits my needs best?
The pricing options vary based on user requirements and access needs. Individual users may opt for single-user licenses, while businesses requiring broader access may choose multi-user or enterprise licenses for cost-effective access to the report.
13. Are there any additional resources or data provided in the Finance Virtual Desktop Market report?
While the report offers comprehensive insights, it's advisable to review the specific contents or supplementary materials provided to ascertain if additional resources or data are available.
14. How can I stay updated on further developments or reports in the Finance Virtual Desktop Market?
To stay informed about further developments, trends, and reports in the Finance Virtual Desktop Market, consider subscribing to industry newsletters, following relevant companies and organizations, or regularly checking reputable industry news sources and publications.
Methodology
Step 1 - Identification of Relevant Samples Size from Population Database


Step 2 - Approaches for Defining Global Market Size (Value, Volume* & Price*)

Note*: In applicable scenarios
Step 3 - Data Sources
Primary Research
- Web Analytics
- Survey Reports
- Research Institute
- Latest Research Reports
- Opinion Leaders
Secondary Research
- Annual Reports
- White Paper
- Latest Press Release
- Industry Association
- Paid Database
- Investor Presentations

Step 4 - Data Triangulation
Involves using different sources of information in order to increase the validity of a study
These sources are likely to be stakeholders in a program - participants, other researchers, program staff, other community members, and so on.
Then we put all data in single framework & apply various statistical tools to find out the dynamic on the market.
During the analysis stage, feedback from the stakeholder groups would be compared to determine areas of agreement as well as areas of divergence
