

Key Insights
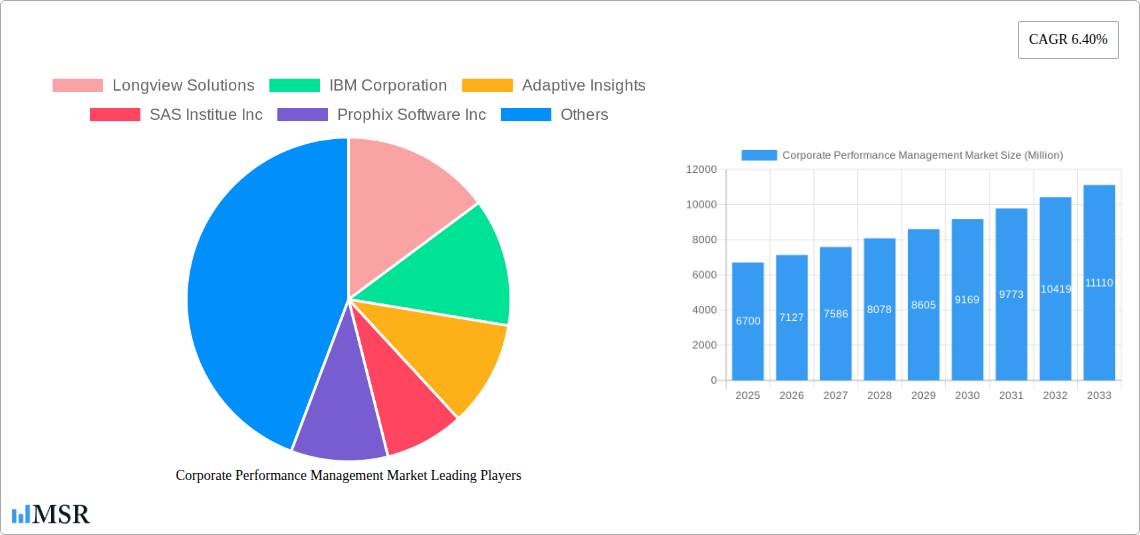
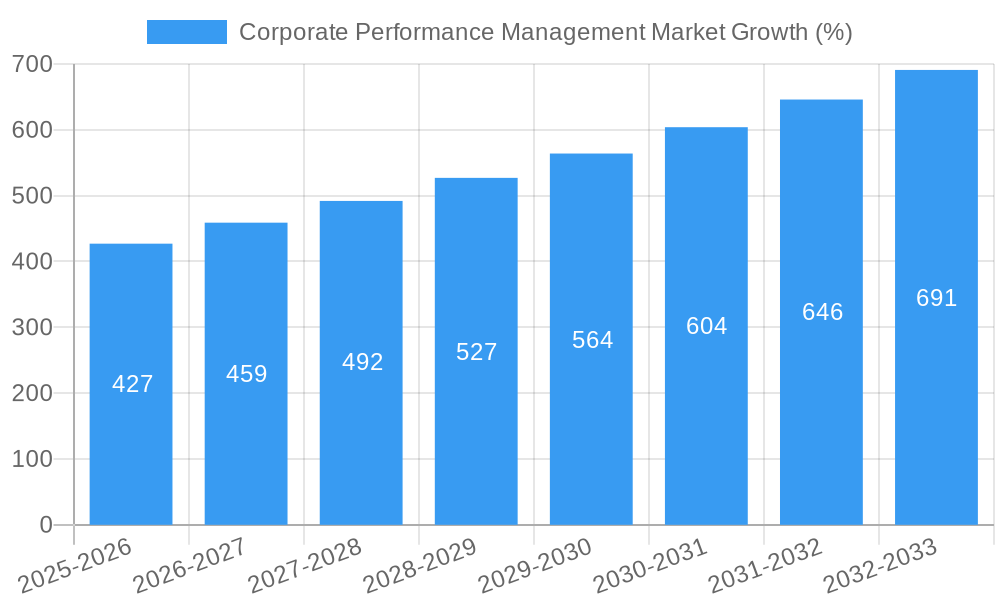
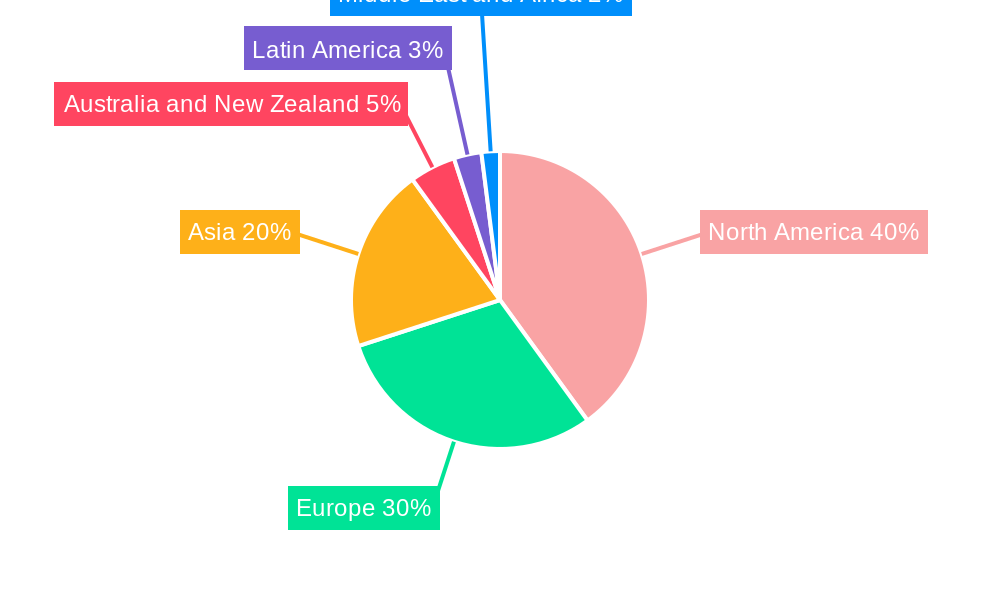
The Corporate Performance Management (CPM) market is experiencing robust growth, projected to reach $6.70 billion in 2025 and maintain a Compound Annual Growth Rate (CAGR) of 6.40% from 2025 to 2033. This expansion is fueled by several key drivers. Increasing demand for real-time data analytics and improved decision-making capabilities across diverse industries is a major catalyst. Businesses are increasingly adopting cloud-based CPM solutions for enhanced scalability, flexibility, and cost-effectiveness, driving market segment growth. Furthermore, the rising adoption of advanced technologies like artificial intelligence (AI) and machine learning (ML) for predictive analytics and automated reporting is contributing significantly to market expansion. The shift towards integrated platforms offering a comprehensive suite of CPM functionalities is also creating lucrative opportunities for vendors. Growth is particularly strong in the large enterprise segment, driven by their need for sophisticated solutions to manage complex operations and financial data. Regions such as North America and Europe currently hold significant market share, but Asia Pacific is expected to witness substantial growth in the coming years, fueled by increasing digitalization and economic development. While data security concerns and the complexities involved in CPM implementation pose some restraints, the overall market outlook remains positive, driven by the continuous demand for efficient performance management solutions.
The competitive landscape is marked by a mix of established players and innovative startups. Established players like IBM, Oracle, and SAP leverage their existing customer base and extensive product portfolios to maintain their market positions. Meanwhile, newer companies are focusing on niche segments and innovative offerings to gain market share. The market is witnessing increasing consolidation, with mergers and acquisitions playing a significant role in shaping the competitive landscape. To maintain a competitive edge, vendors are investing heavily in research and development, focusing on enhancing their product offerings with advanced functionalities, improved user interfaces, and seamless integrations with other enterprise systems. The future success of CPM vendors will depend on their ability to adapt to evolving customer needs, embrace technological advancements, and provide robust solutions that meet the evolving challenges of the business world.
Unlock Growth in the Booming Corporate Performance Management (CPM) Market: A Comprehensive Report (2019-2033)
This in-depth report provides a comprehensive analysis of the Corporate Performance Management (CPM) market, offering invaluable insights for industry stakeholders, investors, and strategic decision-makers. The study covers the period 2019-2033, with a focus on the estimated year 2025 and a forecast period extending to 2033. The report illuminates market dynamics, growth drivers, key segments, leading players, and emerging opportunities within this rapidly evolving landscape. The market size in 2025 is estimated at $xx Million, with a projected Compound Annual Growth Rate (CAGR) of xx% from 2025 to 2033.
Corporate Performance Management Market Concentration & Dynamics
The Corporate Performance Management (CPM) market exhibits a moderately concentrated landscape, with a few major players holding significant market share.
Market share data for 2025 (estimated) indicates that IBM Corporation and SAP SE hold the largest portions, followed by Oracle Corporation, Anaplan Inc, and SAS Institute Inc. However, several smaller, specialized players continue to innovate and capture niche markets.
The innovation ecosystem is vibrant, characterized by continuous advancements in cloud-based solutions, artificial intelligence (AI) integration, and advanced analytics capabilities. Regulatory frameworks, particularly concerning data privacy and security, significantly influence market practices. Substitute products, such as spreadsheet-based solutions and basic reporting tools, face challenges in keeping up with the comprehensive capabilities of modern CPM systems. End-user trends point towards a growing demand for real-time data visualization, predictive analytics, and improved mobile accessibility. Mergers and acquisitions (M&A) activity has been notable in recent years, with xx major deals recorded between 2019 and 2024, reflecting consolidation and strategic expansion efforts.
Corporate Performance Management Market Industry Insights & Trends
The CPM market is experiencing robust growth driven by several factors. The increasing need for businesses to enhance operational efficiency, improve decision-making capabilities, and gain a competitive edge fuels market expansion. Technological advancements, such as cloud computing, big data analytics, and artificial intelligence (AI), have profoundly impacted the sector. Cloud-based CPM solutions are witnessing significant adoption due to their scalability, cost-effectiveness, and accessibility. The integration of AI and machine learning empowers businesses with predictive analytics and automated insights, leading to better forecasting and strategic planning. Evolving consumer behaviors, marked by an increased demand for personalized experiences and real-time data accessibility, further fuel market growth. The global CPM market size reached $xx Million in 2024, exhibiting significant growth compared to the previous year.
Key Markets & Segments Leading Corporate Performance Management Market
The cloud deployment model dominates the CPM market, fueled by its scalability, accessibility, and cost-effectiveness. Large enterprises constitute a larger segment compared to SMEs, driven by their greater need for sophisticated CPM functionalities. The BFSI (Banking, Financial Services, and Insurance) sector leads in adoption rates due to its stringent regulatory compliance and risk management requirements.
Dominant Region/Country: North America currently holds the largest market share, followed by Europe and Asia-Pacific.
By Mode of Deployment:
- Cloud: Rapid adoption due to scalability, cost-effectiveness, and accessibility.
- On-Premises: Still holds a significant share, particularly among large enterprises with stringent security requirements.
By Size of Organization:
- Large Enterprises: Higher adoption rates due to complex business processes and need for sophisticated features.
- Small and Medium Enterprises (SMEs): Growing adoption, driven by ease of use and affordable cloud-based solutions.
By End-user Industry:
- BFSI: Highest adoption rate, due to regulatory compliance and risk management demands.
- Manufacturing: Strong growth, fueled by the need for production optimization and supply chain management.
- Retail: Significant growth driven by the need to improve inventory management and customer relationship management.
- Energy and Power: Increasing demand for improved operational efficiency and compliance.
- Other End-user Industries: Steady growth across various sectors.
Corporate Performance Management Market Product Developments
Recent product innovations focus on enhancing user experience, improving data visualization, and integrating advanced analytics capabilities. New applications include advanced predictive modeling, real-time dashboards, and mobile accessibility, enabling improved decision-making and business agility. These advancements provide competitive advantages to vendors by offering more robust and user-friendly solutions catering to evolving business needs.
Challenges in the Corporate Performance Management Market Market
The CPM market faces challenges including high implementation costs, integration complexities with existing systems, the need for skilled professionals, and potential data security concerns. Competitive pressures from established players and new entrants also pose a challenge. The total estimated impact of these challenges on market growth is around xx Million annually.
Forces Driving Corporate Performance Management Market Growth
Key growth drivers include the increasing adoption of cloud-based solutions, rising demand for real-time data analytics and predictive modeling, and stringent regulatory compliance requirements in various sectors. Government initiatives promoting digital transformation and technological advancements also contribute to market expansion.
Long-Term Growth Catalysts in Corporate Performance Management Market
Long-term growth will be driven by ongoing technological innovations, strategic partnerships between CPM vendors and other technology providers, and expansion into new geographical markets, particularly in developing economies. Increased adoption of AI and machine learning capabilities will also significantly contribute to growth.
Emerging Opportunities in Corporate Performance Management Market
Emerging opportunities include the integration of Internet of Things (IoT) data into CPM systems, the use of blockchain technology for improved security and transparency, and the expansion of services to include more specialized industry solutions. The rise of extended planning and analysis (xP&A) solutions also presents significant opportunities for growth.
Leading Players in the Corporate Performance Management Market Sector
- Longview Solutions
- IBM Corporation
- Adaptive Insights
- SAS Institute Inc
- Prophix Software Inc
- Anaplan Inc
- Oracle Corporation
- Tagetik Software S.r.l
- Host Analytics
- Board International
- Axiom Software
- SAP SE
Key Milestones in Corporate Performance Management Market Industry
- 2020: Increased cloud adoption due to the pandemic.
- 2021: Several significant M&A activities reshaped market landscape.
- 2022: Launch of several AI-powered CPM solutions.
- 2023: Growing focus on sustainability and ESG reporting within CPM systems.
- 2024: Increased adoption of xP&A solutions.
Strategic Outlook for Corporate Performance Management Market Market
The future of the CPM market is promising, with continuous growth expected due to sustained technological advancements, increasing demand for advanced analytics, and expanding adoption across various industries and geographies. Strategic opportunities lie in focusing on innovative solutions, expanding into niche markets, and fostering strategic partnerships to capitalize on market potential.
Corporate Performance Management Market Segmentation
-
1. Mode of Deployment
- 1.1. On-Premises
- 1.2. Cloud
-
2. Size of Organization
- 2.1. Small and Medium Enterprises
- 2.2. Large Enterprises
-
3. End-user Industry
- 3.1. Retail
- 3.2. BFSI
- 3.3. Manufacturing
- 3.4. Energy and Power
- 3.5. Other End-user Industries
Corporate Performance Management Market Segmentation By Geography
- 1. North America
- 2. Europe
- 3. Asia
- 4. Australia and New Zealand
- 5. Latin America
- 6. Middle East and Africa
Corporate Performance Management Market REPORT HIGHLIGHTS
| Aspects | Details |
|---|---|
| Study Period | 2019-2033 |
| Base Year | 2024 |
| Estimated Year | 2025 |
| Forecast Period | 2025-2033 |
| Historical Period | 2019-2024 |
| Growth Rate | CAGR of 6.40% from 2019-2033 |
| Segmentation |
|
Table of Contents
- 1. Introduction
- 1.1. Research Scope
- 1.2. Market Segmentation
- 1.3. Research Methodology
- 1.4. Definitions and Assumptions
- 2. Executive Summary
- 2.1. Introduction
- 3. Market Dynamics
- 3.1. Introduction
- 3.2. Market Drivers
- 3.2.1. Proliferation of Data Driven Decision Making; Growing Focus on Organizational Compliance
- 3.3. Market Restrains
- 3.3.1. Rise of Cloud-based Cyber Threats
- 3.4. Market Trends
- 3.4.1. Cloud Segment is Expected to Hold a Significant Share of the Market
- 4. Market Factor Analysis
- 4.1. Porters Five Forces
- 4.2. Supply/Value Chain
- 4.3. PESTEL analysis
- 4.4. Market Entropy
- 4.5. Patent/Trademark Analysis
- 5. Global Corporate Performance Management Market Analysis, Insights and Forecast, 2019-2031
- 5.1. Market Analysis, Insights and Forecast - by Mode of Deployment
- 5.1.1. On-Premises
- 5.1.2. Cloud
- 5.2. Market Analysis, Insights and Forecast - by Size of Organization
- 5.2.1. Small and Medium Enterprises
- 5.2.2. Large Enterprises
- 5.3. Market Analysis, Insights and Forecast - by End-user Industry
- 5.3.1. Retail
- 5.3.2. BFSI
- 5.3.3. Manufacturing
- 5.3.4. Energy and Power
- 5.3.5. Other End-user Industries
- 5.4. Market Analysis, Insights and Forecast - by Region
- 5.4.1. North America
- 5.4.2. Europe
- 5.4.3. Asia
- 5.4.4. Australia and New Zealand
- 5.4.5. Latin America
- 5.4.6. Middle East and Africa
- 5.1. Market Analysis, Insights and Forecast - by Mode of Deployment
- 6. North America Corporate Performance Management Market Analysis, Insights and Forecast, 2019-2031
- 6.1. Market Analysis, Insights and Forecast - by Mode of Deployment
- 6.1.1. On-Premises
- 6.1.2. Cloud
- 6.2. Market Analysis, Insights and Forecast - by Size of Organization
- 6.2.1. Small and Medium Enterprises
- 6.2.2. Large Enterprises
- 6.3. Market Analysis, Insights and Forecast - by End-user Industry
- 6.3.1. Retail
- 6.3.2. BFSI
- 6.3.3. Manufacturing
- 6.3.4. Energy and Power
- 6.3.5. Other End-user Industries
- 6.1. Market Analysis, Insights and Forecast - by Mode of Deployment
- 7. Europe Corporate Performance Management Market Analysis, Insights and Forecast, 2019-2031
- 7.1. Market Analysis, Insights and Forecast - by Mode of Deployment
- 7.1.1. On-Premises
- 7.1.2. Cloud
- 7.2. Market Analysis, Insights and Forecast - by Size of Organization
- 7.2.1. Small and Medium Enterprises
- 7.2.2. Large Enterprises
- 7.3. Market Analysis, Insights and Forecast - by End-user Industry
- 7.3.1. Retail
- 7.3.2. BFSI
- 7.3.3. Manufacturing
- 7.3.4. Energy and Power
- 7.3.5. Other End-user Industries
- 7.1. Market Analysis, Insights and Forecast - by Mode of Deployment
- 8. Asia Corporate Performance Management Market Analysis, Insights and Forecast, 2019-2031
- 8.1. Market Analysis, Insights and Forecast - by Mode of Deployment
- 8.1.1. On-Premises
- 8.1.2. Cloud
- 8.2. Market Analysis, Insights and Forecast - by Size of Organization
- 8.2.1. Small and Medium Enterprises
- 8.2.2. Large Enterprises
- 8.3. Market Analysis, Insights and Forecast - by End-user Industry
- 8.3.1. Retail
- 8.3.2. BFSI
- 8.3.3. Manufacturing
- 8.3.4. Energy and Power
- 8.3.5. Other End-user Industries
- 8.1. Market Analysis, Insights and Forecast - by Mode of Deployment
- 9. Australia and New Zealand Corporate Performance Management Market Analysis, Insights and Forecast, 2019-2031
- 9.1. Market Analysis, Insights and Forecast - by Mode of Deployment
- 9.1.1. On-Premises
- 9.1.2. Cloud
- 9.2. Market Analysis, Insights and Forecast - by Size of Organization
- 9.2.1. Small and Medium Enterprises
- 9.2.2. Large Enterprises
- 9.3. Market Analysis, Insights and Forecast - by End-user Industry
- 9.3.1. Retail
- 9.3.2. BFSI
- 9.3.3. Manufacturing
- 9.3.4. Energy and Power
- 9.3.5. Other End-user Industries
- 9.1. Market Analysis, Insights and Forecast - by Mode of Deployment
- 10. Latin America Corporate Performance Management Market Analysis, Insights and Forecast, 2019-2031
- 10.1. Market Analysis, Insights and Forecast - by Mode of Deployment
- 10.1.1. On-Premises
- 10.1.2. Cloud
- 10.2. Market Analysis, Insights and Forecast - by Size of Organization
- 10.2.1. Small and Medium Enterprises
- 10.2.2. Large Enterprises
- 10.3. Market Analysis, Insights and Forecast - by End-user Industry
- 10.3.1. Retail
- 10.3.2. BFSI
- 10.3.3. Manufacturing
- 10.3.4. Energy and Power
- 10.3.5. Other End-user Industries
- 10.1. Market Analysis, Insights and Forecast - by Mode of Deployment
- 11. Middle East and Africa Corporate Performance Management Market Analysis, Insights and Forecast, 2019-2031
- 11.1. Market Analysis, Insights and Forecast - by Mode of Deployment
- 11.1.1. On-Premises
- 11.1.2. Cloud
- 11.2. Market Analysis, Insights and Forecast - by Size of Organization
- 11.2.1. Small and Medium Enterprises
- 11.2.2. Large Enterprises
- 11.3. Market Analysis, Insights and Forecast - by End-user Industry
- 11.3.1. Retail
- 11.3.2. BFSI
- 11.3.3. Manufacturing
- 11.3.4. Energy and Power
- 11.3.5. Other End-user Industries
- 11.1. Market Analysis, Insights and Forecast - by Mode of Deployment
- 12. North America Corporate Performance Management Market Analysis, Insights and Forecast, 2019-2031
- 12.1. Market Analysis, Insights and Forecast - By Country/Sub-region
- 12.1.1.
- 13. Europe Corporate Performance Management Market Analysis, Insights and Forecast, 2019-2031
- 13.1. Market Analysis, Insights and Forecast - By Country/Sub-region
- 13.1.1.
- 14. Asia Corporate Performance Management Market Analysis, Insights and Forecast, 2019-2031
- 14.1. Market Analysis, Insights and Forecast - By Country/Sub-region
- 14.1.1.
- 15. Australia and New Zealand Corporate Performance Management Market Analysis, Insights and Forecast, 2019-2031
- 15.1. Market Analysis, Insights and Forecast - By Country/Sub-region
- 15.1.1.
- 16. Latin America Corporate Performance Management Market Analysis, Insights and Forecast, 2019-2031
- 16.1. Market Analysis, Insights and Forecast - By Country/Sub-region
- 16.1.1.
- 17. Middle East and Africa Corporate Performance Management Market Analysis, Insights and Forecast, 2019-2031
- 17.1. Market Analysis, Insights and Forecast - By Country/Sub-region
- 17.1.1.
- 18. Competitive Analysis
- 18.1. Global Market Share Analysis 2024
- 18.2. Company Profiles
- 18.2.1 Longview Solutions
- 18.2.1.1. Overview
- 18.2.1.2. Products
- 18.2.1.3. SWOT Analysis
- 18.2.1.4. Recent Developments
- 18.2.1.5. Financials (Based on Availability)
- 18.2.2 IBM Corporation
- 18.2.2.1. Overview
- 18.2.2.2. Products
- 18.2.2.3. SWOT Analysis
- 18.2.2.4. Recent Developments
- 18.2.2.5. Financials (Based on Availability)
- 18.2.3 Adaptive Insights
- 18.2.3.1. Overview
- 18.2.3.2. Products
- 18.2.3.3. SWOT Analysis
- 18.2.3.4. Recent Developments
- 18.2.3.5. Financials (Based on Availability)
- 18.2.4 SAS Institue Inc
- 18.2.4.1. Overview
- 18.2.4.2. Products
- 18.2.4.3. SWOT Analysis
- 18.2.4.4. Recent Developments
- 18.2.4.5. Financials (Based on Availability)
- 18.2.5 Prophix Software Inc
- 18.2.5.1. Overview
- 18.2.5.2. Products
- 18.2.5.3. SWOT Analysis
- 18.2.5.4. Recent Developments
- 18.2.5.5. Financials (Based on Availability)
- 18.2.6 Anaplan Inc
- 18.2.6.1. Overview
- 18.2.6.2. Products
- 18.2.6.3. SWOT Analysis
- 18.2.6.4. Recent Developments
- 18.2.6.5. Financials (Based on Availability)
- 18.2.7 Oracle Corporation
- 18.2.7.1. Overview
- 18.2.7.2. Products
- 18.2.7.3. SWOT Analysis
- 18.2.7.4. Recent Developments
- 18.2.7.5. Financials (Based on Availability)
- 18.2.8 Tagetik Software S r l
- 18.2.8.1. Overview
- 18.2.8.2. Products
- 18.2.8.3. SWOT Analysis
- 18.2.8.4. Recent Developments
- 18.2.8.5. Financials (Based on Availability)
- 18.2.9 Host Analytics
- 18.2.9.1. Overview
- 18.2.9.2. Products
- 18.2.9.3. SWOT Analysis
- 18.2.9.4. Recent Developments
- 18.2.9.5. Financials (Based on Availability)
- 18.2.10 Board International
- 18.2.10.1. Overview
- 18.2.10.2. Products
- 18.2.10.3. SWOT Analysis
- 18.2.10.4. Recent Developments
- 18.2.10.5. Financials (Based on Availability)
- 18.2.11 Axiom Softwar
- 18.2.11.1. Overview
- 18.2.11.2. Products
- 18.2.11.3. SWOT Analysis
- 18.2.11.4. Recent Developments
- 18.2.11.5. Financials (Based on Availability)
- 18.2.12 SAP SE
- 18.2.12.1. Overview
- 18.2.12.2. Products
- 18.2.12.3. SWOT Analysis
- 18.2.12.4. Recent Developments
- 18.2.12.5. Financials (Based on Availability)
- 18.2.1 Longview Solutions
List of Figures
- Figure 1: Global Corporate Performance Management Market Revenue Breakdown (Million, %) by Region 2024 & 2032
- Figure 2: North America Corporate Performance Management Market Revenue (Million), by Country 2024 & 2032
- Figure 3: North America Corporate Performance Management Market Revenue Share (%), by Country 2024 & 2032
- Figure 4: Europe Corporate Performance Management Market Revenue (Million), by Country 2024 & 2032
- Figure 5: Europe Corporate Performance Management Market Revenue Share (%), by Country 2024 & 2032
- Figure 6: Asia Corporate Performance Management Market Revenue (Million), by Country 2024 & 2032
- Figure 7: Asia Corporate Performance Management Market Revenue Share (%), by Country 2024 & 2032
- Figure 8: Australia and New Zealand Corporate Performance Management Market Revenue (Million), by Country 2024 & 2032
- Figure 9: Australia and New Zealand Corporate Performance Management Market Revenue Share (%), by Country 2024 & 2032
- Figure 10: Latin America Corporate Performance Management Market Revenue (Million), by Country 2024 & 2032
- Figure 11: Latin America Corporate Performance Management Market Revenue Share (%), by Country 2024 & 2032
- Figure 12: Middle East and Africa Corporate Performance Management Market Revenue (Million), by Country 2024 & 2032
- Figure 13: Middle East and Africa Corporate Performance Management Market Revenue Share (%), by Country 2024 & 2032
- Figure 14: North America Corporate Performance Management Market Revenue (Million), by Mode of Deployment 2024 & 2032
- Figure 15: North America Corporate Performance Management Market Revenue Share (%), by Mode of Deployment 2024 & 2032
- Figure 16: North America Corporate Performance Management Market Revenue (Million), by Size of Organization 2024 & 2032
- Figure 17: North America Corporate Performance Management Market Revenue Share (%), by Size of Organization 2024 & 2032
- Figure 18: North America Corporate Performance Management Market Revenue (Million), by End-user Industry 2024 & 2032
- Figure 19: North America Corporate Performance Management Market Revenue Share (%), by End-user Industry 2024 & 2032
- Figure 20: North America Corporate Performance Management Market Revenue (Million), by Country 2024 & 2032
- Figure 21: North America Corporate Performance Management Market Revenue Share (%), by Country 2024 & 2032
- Figure 22: Europe Corporate Performance Management Market Revenue (Million), by Mode of Deployment 2024 & 2032
- Figure 23: Europe Corporate Performance Management Market Revenue Share (%), by Mode of Deployment 2024 & 2032
- Figure 24: Europe Corporate Performance Management Market Revenue (Million), by Size of Organization 2024 & 2032
- Figure 25: Europe Corporate Performance Management Market Revenue Share (%), by Size of Organization 2024 & 2032
- Figure 26: Europe Corporate Performance Management Market Revenue (Million), by End-user Industry 2024 & 2032
- Figure 27: Europe Corporate Performance Management Market Revenue Share (%), by End-user Industry 2024 & 2032
- Figure 28: Europe Corporate Performance Management Market Revenue (Million), by Country 2024 & 2032
- Figure 29: Europe Corporate Performance Management Market Revenue Share (%), by Country 2024 & 2032
- Figure 30: Asia Corporate Performance Management Market Revenue (Million), by Mode of Deployment 2024 & 2032
- Figure 31: Asia Corporate Performance Management Market Revenue Share (%), by Mode of Deployment 2024 & 2032
- Figure 32: Asia Corporate Performance Management Market Revenue (Million), by Size of Organization 2024 & 2032
- Figure 33: Asia Corporate Performance Management Market Revenue Share (%), by Size of Organization 2024 & 2032
- Figure 34: Asia Corporate Performance Management Market Revenue (Million), by End-user Industry 2024 & 2032
- Figure 35: Asia Corporate Performance Management Market Revenue Share (%), by End-user Industry 2024 & 2032
- Figure 36: Asia Corporate Performance Management Market Revenue (Million), by Country 2024 & 2032
- Figure 37: Asia Corporate Performance Management Market Revenue Share (%), by Country 2024 & 2032
- Figure 38: Australia and New Zealand Corporate Performance Management Market Revenue (Million), by Mode of Deployment 2024 & 2032
- Figure 39: Australia and New Zealand Corporate Performance Management Market Revenue Share (%), by Mode of Deployment 2024 & 2032
- Figure 40: Australia and New Zealand Corporate Performance Management Market Revenue (Million), by Size of Organization 2024 & 2032
- Figure 41: Australia and New Zealand Corporate Performance Management Market Revenue Share (%), by Size of Organization 2024 & 2032
- Figure 42: Australia and New Zealand Corporate Performance Management Market Revenue (Million), by End-user Industry 2024 & 2032
- Figure 43: Australia and New Zealand Corporate Performance Management Market Revenue Share (%), by End-user Industry 2024 & 2032
- Figure 44: Australia and New Zealand Corporate Performance Management Market Revenue (Million), by Country 2024 & 2032
- Figure 45: Australia and New Zealand Corporate Performance Management Market Revenue Share (%), by Country 2024 & 2032
- Figure 46: Latin America Corporate Performance Management Market Revenue (Million), by Mode of Deployment 2024 & 2032
- Figure 47: Latin America Corporate Performance Management Market Revenue Share (%), by Mode of Deployment 2024 & 2032
- Figure 48: Latin America Corporate Performance Management Market Revenue (Million), by Size of Organization 2024 & 2032
- Figure 49: Latin America Corporate Performance Management Market Revenue Share (%), by Size of Organization 2024 & 2032
- Figure 50: Latin America Corporate Performance Management Market Revenue (Million), by End-user Industry 2024 & 2032
- Figure 51: Latin America Corporate Performance Management Market Revenue Share (%), by End-user Industry 2024 & 2032
- Figure 52: Latin America Corporate Performance Management Market Revenue (Million), by Country 2024 & 2032
- Figure 53: Latin America Corporate Performance Management Market Revenue Share (%), by Country 2024 & 2032
- Figure 54: Middle East and Africa Corporate Performance Management Market Revenue (Million), by Mode of Deployment 2024 & 2032
- Figure 55: Middle East and Africa Corporate Performance Management Market Revenue Share (%), by Mode of Deployment 2024 & 2032
- Figure 56: Middle East and Africa Corporate Performance Management Market Revenue (Million), by Size of Organization 2024 & 2032
- Figure 57: Middle East and Africa Corporate Performance Management Market Revenue Share (%), by Size of Organization 2024 & 2032
- Figure 58: Middle East and Africa Corporate Performance Management Market Revenue (Million), by End-user Industry 2024 & 2032
- Figure 59: Middle East and Africa Corporate Performance Management Market Revenue Share (%), by End-user Industry 2024 & 2032
- Figure 60: Middle East and Africa Corporate Performance Management Market Revenue (Million), by Country 2024 & 2032
- Figure 61: Middle East and Africa Corporate Performance Management Market Revenue Share (%), by Country 2024 & 2032
List of Tables
- Table 1: Global Corporate Performance Management Market Revenue Million Forecast, by Region 2019 & 2032
- Table 2: Global Corporate Performance Management Market Revenue Million Forecast, by Mode of Deployment 2019 & 2032
- Table 3: Global Corporate Performance Management Market Revenue Million Forecast, by Size of Organization 2019 & 2032
- Table 4: Global Corporate Performance Management Market Revenue Million Forecast, by End-user Industry 2019 & 2032
- Table 5: Global Corporate Performance Management Market Revenue Million Forecast, by Region 2019 & 2032
- Table 6: Global Corporate Performance Management Market Revenue Million Forecast, by Country 2019 & 2032
- Table 7: Corporate Performance Management Market Revenue (Million) Forecast, by Application 2019 & 2032
- Table 8: Global Corporate Performance Management Market Revenue Million Forecast, by Country 2019 & 2032
- Table 9: Corporate Performance Management Market Revenue (Million) Forecast, by Application 2019 & 2032
- Table 10: Global Corporate Performance Management Market Revenue Million Forecast, by Country 2019 & 2032
- Table 11: Corporate Performance Management Market Revenue (Million) Forecast, by Application 2019 & 2032
- Table 12: Global Corporate Performance Management Market Revenue Million Forecast, by Country 2019 & 2032
- Table 13: Corporate Performance Management Market Revenue (Million) Forecast, by Application 2019 & 2032
- Table 14: Global Corporate Performance Management Market Revenue Million Forecast, by Country 2019 & 2032
- Table 15: Corporate Performance Management Market Revenue (Million) Forecast, by Application 2019 & 2032
- Table 16: Global Corporate Performance Management Market Revenue Million Forecast, by Country 2019 & 2032
- Table 17: Corporate Performance Management Market Revenue (Million) Forecast, by Application 2019 & 2032
- Table 18: Global Corporate Performance Management Market Revenue Million Forecast, by Mode of Deployment 2019 & 2032
- Table 19: Global Corporate Performance Management Market Revenue Million Forecast, by Size of Organization 2019 & 2032
- Table 20: Global Corporate Performance Management Market Revenue Million Forecast, by End-user Industry 2019 & 2032
- Table 21: Global Corporate Performance Management Market Revenue Million Forecast, by Country 2019 & 2032
- Table 22: Global Corporate Performance Management Market Revenue Million Forecast, by Mode of Deployment 2019 & 2032
- Table 23: Global Corporate Performance Management Market Revenue Million Forecast, by Size of Organization 2019 & 2032
- Table 24: Global Corporate Performance Management Market Revenue Million Forecast, by End-user Industry 2019 & 2032
- Table 25: Global Corporate Performance Management Market Revenue Million Forecast, by Country 2019 & 2032
- Table 26: Global Corporate Performance Management Market Revenue Million Forecast, by Mode of Deployment 2019 & 2032
- Table 27: Global Corporate Performance Management Market Revenue Million Forecast, by Size of Organization 2019 & 2032
- Table 28: Global Corporate Performance Management Market Revenue Million Forecast, by End-user Industry 2019 & 2032
- Table 29: Global Corporate Performance Management Market Revenue Million Forecast, by Country 2019 & 2032
- Table 30: Global Corporate Performance Management Market Revenue Million Forecast, by Mode of Deployment 2019 & 2032
- Table 31: Global Corporate Performance Management Market Revenue Million Forecast, by Size of Organization 2019 & 2032
- Table 32: Global Corporate Performance Management Market Revenue Million Forecast, by End-user Industry 2019 & 2032
- Table 33: Global Corporate Performance Management Market Revenue Million Forecast, by Country 2019 & 2032
- Table 34: Global Corporate Performance Management Market Revenue Million Forecast, by Mode of Deployment 2019 & 2032
- Table 35: Global Corporate Performance Management Market Revenue Million Forecast, by Size of Organization 2019 & 2032
- Table 36: Global Corporate Performance Management Market Revenue Million Forecast, by End-user Industry 2019 & 2032
- Table 37: Global Corporate Performance Management Market Revenue Million Forecast, by Country 2019 & 2032
- Table 38: Global Corporate Performance Management Market Revenue Million Forecast, by Mode of Deployment 2019 & 2032
- Table 39: Global Corporate Performance Management Market Revenue Million Forecast, by Size of Organization 2019 & 2032
- Table 40: Global Corporate Performance Management Market Revenue Million Forecast, by End-user Industry 2019 & 2032
- Table 41: Global Corporate Performance Management Market Revenue Million Forecast, by Country 2019 & 2032
Frequently Asked Questions
1. What is the projected Compound Annual Growth Rate (CAGR) of the Corporate Performance Management Market?
The projected CAGR is approximately 6.40%.
2. Which companies are prominent players in the Corporate Performance Management Market?
Key companies in the market include Longview Solutions, IBM Corporation, Adaptive Insights, SAS Institue Inc, Prophix Software Inc, Anaplan Inc, Oracle Corporation, Tagetik Software S r l, Host Analytics, Board International, Axiom Softwar, SAP SE.
3. What are the main segments of the Corporate Performance Management Market?
The market segments include Mode of Deployment, Size of Organization, End-user Industry.
4. Can you provide details about the market size?
The market size is estimated to be USD 6.70 Million as of 2022.
5. What are some drivers contributing to market growth?
Proliferation of Data Driven Decision Making; Growing Focus on Organizational Compliance.
6. What are the notable trends driving market growth?
Cloud Segment is Expected to Hold a Significant Share of the Market.
7. Are there any restraints impacting market growth?
Rise of Cloud-based Cyber Threats.
8. Can you provide examples of recent developments in the market?
N/A
9. What pricing options are available for accessing the report?
Pricing options include single-user, multi-user, and enterprise licenses priced at USD 4750, USD 5250, and USD 8750 respectively.
10. Is the market size provided in terms of value or volume?
The market size is provided in terms of value, measured in Million.
11. Are there any specific market keywords associated with the report?
Yes, the market keyword associated with the report is "Corporate Performance Management Market," which aids in identifying and referencing the specific market segment covered.
12. How do I determine which pricing option suits my needs best?
The pricing options vary based on user requirements and access needs. Individual users may opt for single-user licenses, while businesses requiring broader access may choose multi-user or enterprise licenses for cost-effective access to the report.
13. Are there any additional resources or data provided in the Corporate Performance Management Market report?
While the report offers comprehensive insights, it's advisable to review the specific contents or supplementary materials provided to ascertain if additional resources or data are available.
14. How can I stay updated on further developments or reports in the Corporate Performance Management Market?
To stay informed about further developments, trends, and reports in the Corporate Performance Management Market, consider subscribing to industry newsletters, following relevant companies and organizations, or regularly checking reputable industry news sources and publications.
Methodology
Step 1 - Identification of Relevant Samples Size from Population Database


Step 2 - Approaches for Defining Global Market Size (Value, Volume* & Price*)

Note*: In applicable scenarios
Step 3 - Data Sources
Primary Research
- Web Analytics
- Survey Reports
- Research Institute
- Latest Research Reports
- Opinion Leaders
Secondary Research
- Annual Reports
- White Paper
- Latest Press Release
- Industry Association
- Paid Database
- Investor Presentations

Step 4 - Data Triangulation
Involves using different sources of information in order to increase the validity of a study
These sources are likely to be stakeholders in a program - participants, other researchers, program staff, other community members, and so on.
Then we put all data in single framework & apply various statistical tools to find out the dynamic on the market.
During the analysis stage, feedback from the stakeholder groups would be compared to determine areas of agreement as well as areas of divergence
