

Key Insights
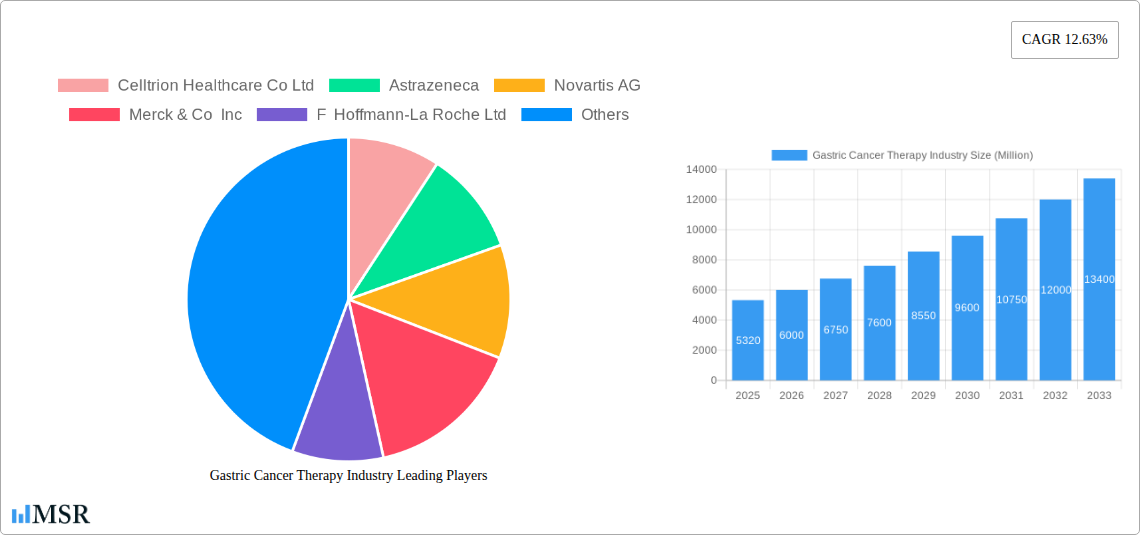
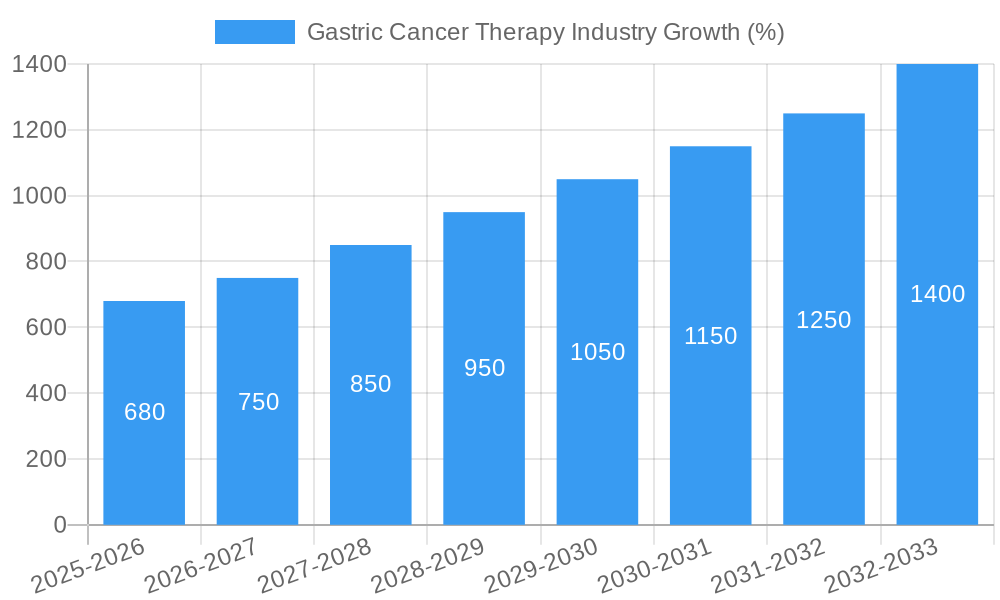
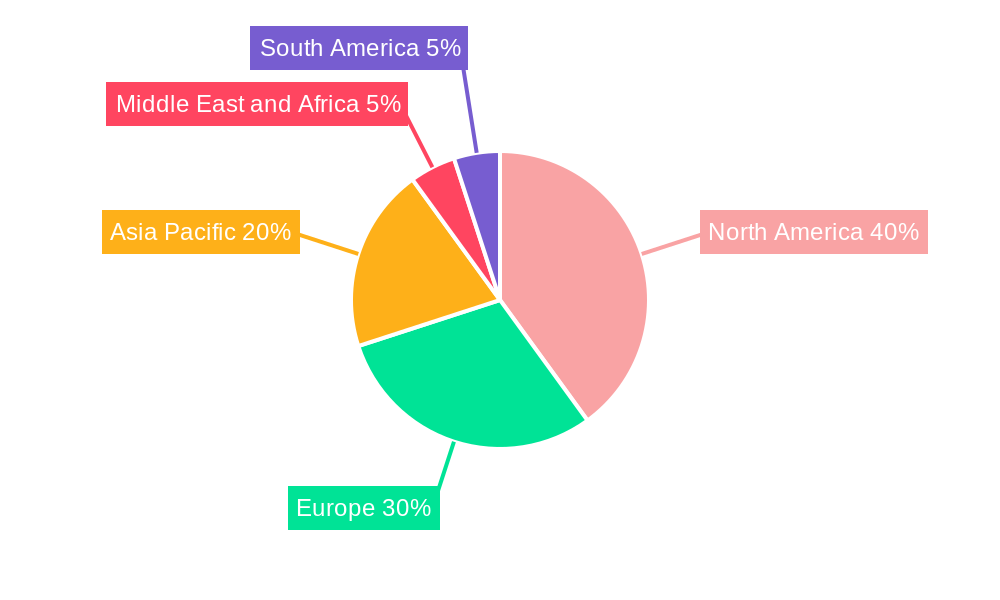
The global gastric cancer therapy market, valued at $5.32 billion in 2025, is projected to experience robust growth, driven by rising incidence rates of gastric cancer, particularly in developing nations, and advancements in therapeutic approaches. The market's Compound Annual Growth Rate (CAGR) of 12.63% from 2025 to 2033 indicates significant expansion. Key drivers include the increasing adoption of targeted therapies and immunotherapies, offering improved efficacy and reduced side effects compared to traditional chemotherapy. The rising prevalence of Helicobacter pylori infection, a significant risk factor for gastric cancer, further fuels market growth. While advancements in early detection and screening contribute positively, challenges remain, including the high cost of novel therapies, access limitations in low- and middle-income countries, and the development of drug resistance. The market is segmented by therapy type (chemotherapy, targeted therapy, immunotherapy, radiation therapy, surgery) and end-user (ambulatory surgery centers, hospitals and specialty clinics). Major players like Celltrion Healthcare, AstraZeneca, Novartis, Merck, Roche, Amgen, Eli Lilly, Otsuka, GSK, Imugene, Bristol-Myers Squibb, Sanofi, and Pfizer are actively involved in research and development, contributing to the market's dynamism. The North American market holds a substantial share due to high healthcare expenditure and advanced infrastructure, while Asia-Pacific is expected to witness rapid growth driven by a large patient pool and increasing healthcare awareness.
The segmentation of the market allows for a more granular understanding of growth opportunities. Immunotherapy and targeted therapy segments are expected to exhibit higher growth rates compared to traditional chemotherapy, driven by their improved efficacy and patient tolerance profiles. The hospital and specialty clinic segment dominates the end-user landscape due to the complexity of gastric cancer treatment. However, the ambulatory surgery centers segment is likely to expand due to a rising preference for minimally invasive procedures and cost-effectiveness. Future market growth will likely depend on the continued development of innovative therapies, improvements in early detection methods, and efforts to increase access to treatment in underserved populations. Furthermore, collaborations between pharmaceutical companies and research institutions will play a crucial role in accelerating the pace of innovation and delivering improved treatment outcomes.
Gastric Cancer Therapy Market: A Comprehensive Report (2019-2033)
This comprehensive report provides a detailed analysis of the global gastric cancer therapy market, offering actionable insights for stakeholders across the industry. With a focus on market dynamics, leading players, and future trends, this report is an essential resource for strategic decision-making. The study period covers 2019-2033, with 2025 as the base and estimated year, and a forecast period of 2025-2033. The historical period analyzed is 2019-2024. The market size is estimated at xx Million in 2025 and is projected to reach xx Million by 2033, exhibiting a CAGR of xx%.
Gastric Cancer Therapy Industry Market Concentration & Dynamics
The global gastric cancer therapy market is characterized by a moderately concentrated landscape, with key players holding significant market share. While precise market share figures for each company are unavailable publicly (xx%), the leading companies, including AstraZeneca, Novartis AG, Merck & Co Inc, F Hoffmann-La Roche Ltd, Amgen, Celltrion Healthcare Co Ltd, Eli Lilly and Company, Otsuka Holdings Co Ltd, GSK plc, Imugene Limited, Bristol-Myers Squibb Company, Sanofi S A, and Pfizer Inc., drive much of the innovation and competition. The market is influenced by a dynamic interplay of factors:
- Innovation Ecosystems: Significant R&D investments are fueling the development of novel therapies, including immunotherapies and targeted therapies. The collaborative efforts between pharmaceutical companies, research institutions, and regulatory bodies are accelerating the pace of innovation.
- Regulatory Frameworks: Stringent regulatory approvals for new drugs and therapies impact market entry and growth. Variations in regulatory pathways across different regions contribute to market complexities.
- Substitute Products: The availability of alternative treatment options, such as surgery and radiation therapy, influences the market share of specific therapies.
- End-User Trends: Increasing awareness about gastric cancer and improved access to healthcare facilities are driving market growth. The shift towards minimally invasive procedures is influencing the demand for ambulatory surgery centers.
- M&A Activities: The gastric cancer therapy market witnesses frequent mergers and acquisitions, as larger pharmaceutical companies seek to expand their product portfolios and market presence. The number of M&A deals in the last five years has averaged xx per year.
Gastric Cancer Therapy Industry Insights & Trends
The gastric cancer therapy market is experiencing robust growth, driven by several key factors. The rising incidence of gastric cancer globally, particularly in developing economies, is a primary driver. Technological advancements in treatment modalities, such as the development of more effective and targeted therapies (immunotherapies, targeted therapies, and combination therapies), have significantly improved patient outcomes and increased the market demand. Furthermore, increased healthcare expenditure and improved access to advanced medical facilities in several regions are contributing factors. The aging global population, increased risk factors associated with lifestyle changes (smoking, poor diet), and improved diagnostic capabilities also fuel the market expansion. The market is witnessing a transition towards personalized medicine, with a growing focus on tailoring treatments to individual patients' genetic profiles and disease characteristics. This trend is expected to further drive innovation and market growth in the coming years. The market has seen a growth of xx Million from 2019 to 2024, indicating its strong upward trend.
Key Markets & Segments Leading Gastric Cancer Therapy Industry
The North American region currently holds a dominant position in the gastric cancer therapy market, driven by factors such as high healthcare expenditure, advanced healthcare infrastructure, and a substantial patient population. However, the Asia-Pacific region is expected to witness significant growth in the coming years, fueled by rising healthcare spending and increasing awareness.
Dominant Segments:
- By Therapy Type: Chemotherapy continues to hold a significant market share due to its widespread use and established efficacy. However, the demand for targeted therapies and immunotherapies is rapidly increasing due to their improved efficacy and reduced side effects. Immunotherapy is expected to show significant growth in the forecast period due to its innovative mechanism of action.
- By End-User: Hospitals and specialty clinics remain the dominant end-users, followed by ambulatory surgery centers.
Drivers:
- North America: High healthcare expenditure, robust healthcare infrastructure, advanced medical technologies, and a large patient population drive market growth.
- Asia-Pacific: Rising healthcare expenditure, growing awareness of gastric cancer, and increasing adoption of advanced treatment modalities propel market growth.
- Europe: Stringent regulatory environment coupled with a substantial patient population drives growth, despite comparatively lower per capita spending.
Gastric Cancer Therapy Industry Product Developments
Recent advancements in gastric cancer therapy include the development of novel targeted therapies and immunotherapies that offer improved efficacy and reduced side effects compared to traditional chemotherapy. The development of monoclonal antibodies, such as trastuzumab and ramucirumab, has revolutionized the treatment landscape, leading to better outcomes for patients with specific types of gastric cancer. Furthermore, research into immunotherapy, including checkpoint inhibitors, holds immense promise for the future, offering the potential for long-term disease control and improved survival rates. These advancements contribute to a highly competitive market where innovation and technological superiority are key differentiators.
Challenges in the Gastric Cancer Therapy Industry Market
The gastric cancer therapy market faces several challenges, including high drug development costs, stringent regulatory approvals, the complexity of the disease, and the emergence of drug resistance. The lack of awareness and late diagnosis in many parts of the world limit timely access to treatment. Supply chain disruptions, especially prevalent in recent years, can impact the availability and affordability of therapies. The competitive landscape, with several established pharmaceutical companies and emerging biotech firms vying for market share, intensifies pricing pressures. These factors collectively affect the market's overall growth trajectory.
Forces Driving Gastric Cancer Therapy Industry Growth
Several key factors drive the growth of the gastric cancer therapy market. Technological advancements in treatment modalities, including targeted therapies and immunotherapies, significantly improve patient outcomes and market demand. The rising incidence of gastric cancer globally, particularly in developing countries, presents a substantial growth opportunity. Growing healthcare expenditure and improved access to advanced medical facilities are also significant contributors. Favorable regulatory policies and increased investment in research and development further fuel market expansion. For instance, the recent approval of cadonilimab by Akeso, Inc. highlights the potential for innovative therapies to accelerate market growth.
Long-Term Growth Catalysts in the Gastric Cancer Therapy Industry
Long-term growth in the gastric cancer therapy market will be propelled by continuous innovation in treatment modalities, strategic partnerships between pharmaceutical companies and research institutions, and expansion into emerging markets. The development of personalized medicine approaches will significantly improve treatment efficacy. Increased investments in R&D aimed at overcoming drug resistance and improving treatment outcomes are crucial for sustaining long-term market growth. The adoption of advanced technologies like artificial intelligence for drug discovery and personalized treatment plans will further support market expansion.
Emerging Opportunities in Gastric Cancer Therapy Industry
Emerging opportunities in the gastric cancer therapy market include the development of novel combination therapies, personalized medicine approaches tailored to specific genetic profiles, and the exploration of new therapeutic targets. The expansion into underserved markets, particularly in developing countries, presents substantial growth potential. The increasing adoption of digital technologies for remote patient monitoring and personalized treatment delivery will offer significant opportunities for market players. Investment in early detection and screening programs is expected to yield better patient outcomes and contribute to market growth.
Leading Players in the Gastric Cancer Therapy Industry Sector
- Celltrion Healthcare Co Ltd
- AstraZeneca
- Novartis AG
- Merck & Co Inc
- F Hoffmann-La Roche Ltd
- Amgen
- Eli Lilly and Company
- Otsuka Holdings Co Ltd
- GSK plc
- Imugene Limited
- Bristol-Myers Squibb Company
- Sanofi S A
- Pfizer Inc
Key Milestones in Gastric Cancer Therapy Industry
- March 2023: Akeso, Inc. completed patient enrollment for its pivotal Phase III clinical trial for cadonilimab (PD-1/CTLA-4 bi-specific antibody, AK104), a pioneering dual-immune checkpoint bi-specific antibody drug. This significantly advances the drug's potential for market launch following cervical cancer approval.
- January 2023: Eisai Co., Ltd. presented research on various gastrointestinal cancers at the 2023 American Society of Clinical Oncology (ASCO) gastrointestinal cancers symposium (#GI23). This showcases ongoing research and development efforts within the industry.
Strategic Outlook for Gastric Cancer Therapy Market
The gastric cancer therapy market exhibits significant growth potential driven by continuous innovation, increasing prevalence of the disease, and rising healthcare expenditures globally. Strategic opportunities exist for companies focused on developing novel therapies, personalized medicine approaches, and expanding into underserved markets. Partnerships and collaborations are essential for accelerating the development and commercialization of effective treatments. The long-term outlook remains positive, fueled by ongoing technological advancements and a growing need for improved therapies.
Gastric Cancer Therapy Industry Segmentation
-
1. Therapy Type
- 1.1. Chemotherapy
- 1.2. Targeted Therapy
- 1.3. Immunotherapy
- 1.4. Radiation Therapy
- 1.5. Surgery
-
2. End-User
- 2.1. Ambulatory Surgery Centers
- 2.2. Hospitals and Specialty Clinics
- 2.3. Other End-users
Gastric Cancer Therapy Industry Segmentation By Geography
-
1. North America
- 1.1. United States
- 1.2. Canada
- 1.3. Mexico
-
2. Europe
- 2.1. Germany
- 2.2. United Kingdom
- 2.3. France
- 2.4. Italy
- 2.5. Spain
- 2.6. Rest of Europe
-
3. Asia Pacific
- 3.1. China
- 3.2. Japan
- 3.3. India
- 3.4. Australia
- 3.5. South Korea
- 3.6. Rest of Asia Pacific
-
4. Middle East and Africa
- 4.1. GCC
- 4.2. South Africa
- 4.3. Rest of Middle East and Africa
-
5. South America
- 5.1. Brazil
- 5.2. Argentina
- 5.3. Rest of South America
Gastric Cancer Therapy Industry REPORT HIGHLIGHTS
| Aspects | Details |
|---|---|
| Study Period | 2019-2033 |
| Base Year | 2024 |
| Estimated Year | 2025 |
| Forecast Period | 2025-2033 |
| Historical Period | 2019-2024 |
| Growth Rate | CAGR of 12.63% from 2019-2033 |
| Segmentation |
|
Table of Contents
- 1. Introduction
- 1.1. Research Scope
- 1.2. Market Segmentation
- 1.3. Research Methodology
- 1.4. Definitions and Assumptions
- 2. Executive Summary
- 2.1. Introduction
- 3. Market Dynamics
- 3.1. Introduction
- 3.2. Market Drivers
- 3.2.1. Growing Burden of Gastric Cancer; Increase in Research and Development for Novel Therapies Coupled with Government Initiatives
- 3.3. Market Restrains
- 3.3.1. High Cost of Cancer Therapy and Side Effects of Cancer Drugs
- 3.4. Market Trends
- 3.4.1. Targeted Segment is Expected to Hold a Significant Share of the Market Over the Forecast Period
- 4. Market Factor Analysis
- 4.1. Porters Five Forces
- 4.2. Supply/Value Chain
- 4.3. PESTEL analysis
- 4.4. Market Entropy
- 4.5. Patent/Trademark Analysis
- 5. Global Gastric Cancer Therapy Industry Analysis, Insights and Forecast, 2019-2031
- 5.1. Market Analysis, Insights and Forecast - by Therapy Type
- 5.1.1. Chemotherapy
- 5.1.2. Targeted Therapy
- 5.1.3. Immunotherapy
- 5.1.4. Radiation Therapy
- 5.1.5. Surgery
- 5.2. Market Analysis, Insights and Forecast - by End-User
- 5.2.1. Ambulatory Surgery Centers
- 5.2.2. Hospitals and Specialty Clinics
- 5.2.3. Other End-users
- 5.3. Market Analysis, Insights and Forecast - by Region
- 5.3.1. North America
- 5.3.2. Europe
- 5.3.3. Asia Pacific
- 5.3.4. Middle East and Africa
- 5.3.5. South America
- 5.1. Market Analysis, Insights and Forecast - by Therapy Type
- 6. North America Gastric Cancer Therapy Industry Analysis, Insights and Forecast, 2019-2031
- 6.1. Market Analysis, Insights and Forecast - by Therapy Type
- 6.1.1. Chemotherapy
- 6.1.2. Targeted Therapy
- 6.1.3. Immunotherapy
- 6.1.4. Radiation Therapy
- 6.1.5. Surgery
- 6.2. Market Analysis, Insights and Forecast - by End-User
- 6.2.1. Ambulatory Surgery Centers
- 6.2.2. Hospitals and Specialty Clinics
- 6.2.3. Other End-users
- 6.1. Market Analysis, Insights and Forecast - by Therapy Type
- 7. Europe Gastric Cancer Therapy Industry Analysis, Insights and Forecast, 2019-2031
- 7.1. Market Analysis, Insights and Forecast - by Therapy Type
- 7.1.1. Chemotherapy
- 7.1.2. Targeted Therapy
- 7.1.3. Immunotherapy
- 7.1.4. Radiation Therapy
- 7.1.5. Surgery
- 7.2. Market Analysis, Insights and Forecast - by End-User
- 7.2.1. Ambulatory Surgery Centers
- 7.2.2. Hospitals and Specialty Clinics
- 7.2.3. Other End-users
- 7.1. Market Analysis, Insights and Forecast - by Therapy Type
- 8. Asia Pacific Gastric Cancer Therapy Industry Analysis, Insights and Forecast, 2019-2031
- 8.1. Market Analysis, Insights and Forecast - by Therapy Type
- 8.1.1. Chemotherapy
- 8.1.2. Targeted Therapy
- 8.1.3. Immunotherapy
- 8.1.4. Radiation Therapy
- 8.1.5. Surgery
- 8.2. Market Analysis, Insights and Forecast - by End-User
- 8.2.1. Ambulatory Surgery Centers
- 8.2.2. Hospitals and Specialty Clinics
- 8.2.3. Other End-users
- 8.1. Market Analysis, Insights and Forecast - by Therapy Type
- 9. Middle East and Africa Gastric Cancer Therapy Industry Analysis, Insights and Forecast, 2019-2031
- 9.1. Market Analysis, Insights and Forecast - by Therapy Type
- 9.1.1. Chemotherapy
- 9.1.2. Targeted Therapy
- 9.1.3. Immunotherapy
- 9.1.4. Radiation Therapy
- 9.1.5. Surgery
- 9.2. Market Analysis, Insights and Forecast - by End-User
- 9.2.1. Ambulatory Surgery Centers
- 9.2.2. Hospitals and Specialty Clinics
- 9.2.3. Other End-users
- 9.1. Market Analysis, Insights and Forecast - by Therapy Type
- 10. South America Gastric Cancer Therapy Industry Analysis, Insights and Forecast, 2019-2031
- 10.1. Market Analysis, Insights and Forecast - by Therapy Type
- 10.1.1. Chemotherapy
- 10.1.2. Targeted Therapy
- 10.1.3. Immunotherapy
- 10.1.4. Radiation Therapy
- 10.1.5. Surgery
- 10.2. Market Analysis, Insights and Forecast - by End-User
- 10.2.1. Ambulatory Surgery Centers
- 10.2.2. Hospitals and Specialty Clinics
- 10.2.3. Other End-users
- 10.1. Market Analysis, Insights and Forecast - by Therapy Type
- 11. North America Gastric Cancer Therapy Industry Analysis, Insights and Forecast, 2019-2031
- 11.1. Market Analysis, Insights and Forecast - By Country/Sub-region
- 11.1.1 United States
- 11.1.2 Canada
- 11.1.3 Mexico
- 12. Europe Gastric Cancer Therapy Industry Analysis, Insights and Forecast, 2019-2031
- 12.1. Market Analysis, Insights and Forecast - By Country/Sub-region
- 12.1.1 Germany
- 12.1.2 United Kingdom
- 12.1.3 France
- 12.1.4 Italy
- 12.1.5 Spain
- 12.1.6 Rest of Europe
- 13. Asia Pacific Gastric Cancer Therapy Industry Analysis, Insights and Forecast, 2019-2031
- 13.1. Market Analysis, Insights and Forecast - By Country/Sub-region
- 13.1.1 China
- 13.1.2 Japan
- 13.1.3 India
- 13.1.4 Australia
- 13.1.5 South Korea
- 13.1.6 Rest of Asia Pacific
- 14. Middle East and Africa Gastric Cancer Therapy Industry Analysis, Insights and Forecast, 2019-2031
- 14.1. Market Analysis, Insights and Forecast - By Country/Sub-region
- 14.1.1 GCC
- 14.1.2 South Africa
- 14.1.3 Rest of Middle East and Africa
- 15. South America Gastric Cancer Therapy Industry Analysis, Insights and Forecast, 2019-2031
- 15.1. Market Analysis, Insights and Forecast - By Country/Sub-region
- 15.1.1 Brazil
- 15.1.2 Argentina
- 15.1.3 Rest of South America
- 16. Competitive Analysis
- 16.1. Global Market Share Analysis 2024
- 16.2. Company Profiles
- 16.2.1 Celltrion Healthcare Co Ltd
- 16.2.1.1. Overview
- 16.2.1.2. Products
- 16.2.1.3. SWOT Analysis
- 16.2.1.4. Recent Developments
- 16.2.1.5. Financials (Based on Availability)
- 16.2.2 Astrazeneca
- 16.2.2.1. Overview
- 16.2.2.2. Products
- 16.2.2.3. SWOT Analysis
- 16.2.2.4. Recent Developments
- 16.2.2.5. Financials (Based on Availability)
- 16.2.3 Novartis AG
- 16.2.3.1. Overview
- 16.2.3.2. Products
- 16.2.3.3. SWOT Analysis
- 16.2.3.4. Recent Developments
- 16.2.3.5. Financials (Based on Availability)
- 16.2.4 Merck & Co Inc
- 16.2.4.1. Overview
- 16.2.4.2. Products
- 16.2.4.3. SWOT Analysis
- 16.2.4.4. Recent Developments
- 16.2.4.5. Financials (Based on Availability)
- 16.2.5 F Hoffmann-La Roche Ltd
- 16.2.5.1. Overview
- 16.2.5.2. Products
- 16.2.5.3. SWOT Analysis
- 16.2.5.4. Recent Developments
- 16.2.5.5. Financials (Based on Availability)
- 16.2.6 Amgen*List Not Exhaustive
- 16.2.6.1. Overview
- 16.2.6.2. Products
- 16.2.6.3. SWOT Analysis
- 16.2.6.4. Recent Developments
- 16.2.6.5. Financials (Based on Availability)
- 16.2.7 Eli Lilly and Company
- 16.2.7.1. Overview
- 16.2.7.2. Products
- 16.2.7.3. SWOT Analysis
- 16.2.7.4. Recent Developments
- 16.2.7.5. Financials (Based on Availability)
- 16.2.8 Otsuka Holdings Co Ltd
- 16.2.8.1. Overview
- 16.2.8.2. Products
- 16.2.8.3. SWOT Analysis
- 16.2.8.4. Recent Developments
- 16.2.8.5. Financials (Based on Availability)
- 16.2.9 GSK plc
- 16.2.9.1. Overview
- 16.2.9.2. Products
- 16.2.9.3. SWOT Analysis
- 16.2.9.4. Recent Developments
- 16.2.9.5. Financials (Based on Availability)
- 16.2.10 Imugene Limited
- 16.2.10.1. Overview
- 16.2.10.2. Products
- 16.2.10.3. SWOT Analysis
- 16.2.10.4. Recent Developments
- 16.2.10.5. Financials (Based on Availability)
- 16.2.11 Bristol-Myers Squibb Company
- 16.2.11.1. Overview
- 16.2.11.2. Products
- 16.2.11.3. SWOT Analysis
- 16.2.11.4. Recent Developments
- 16.2.11.5. Financials (Based on Availability)
- 16.2.12 Sanofi S A
- 16.2.12.1. Overview
- 16.2.12.2. Products
- 16.2.12.3. SWOT Analysis
- 16.2.12.4. Recent Developments
- 16.2.12.5. Financials (Based on Availability)
- 16.2.13 Pfizer Inc
- 16.2.13.1. Overview
- 16.2.13.2. Products
- 16.2.13.3. SWOT Analysis
- 16.2.13.4. Recent Developments
- 16.2.13.5. Financials (Based on Availability)
- 16.2.1 Celltrion Healthcare Co Ltd
List of Figures
- Figure 1: Global Gastric Cancer Therapy Industry Revenue Breakdown (Million, %) by Region 2024 & 2032
- Figure 2: North America Gastric Cancer Therapy Industry Revenue (Million), by Country 2024 & 2032
- Figure 3: North America Gastric Cancer Therapy Industry Revenue Share (%), by Country 2024 & 2032
- Figure 4: Europe Gastric Cancer Therapy Industry Revenue (Million), by Country 2024 & 2032
- Figure 5: Europe Gastric Cancer Therapy Industry Revenue Share (%), by Country 2024 & 2032
- Figure 6: Asia Pacific Gastric Cancer Therapy Industry Revenue (Million), by Country 2024 & 2032
- Figure 7: Asia Pacific Gastric Cancer Therapy Industry Revenue Share (%), by Country 2024 & 2032
- Figure 8: Middle East and Africa Gastric Cancer Therapy Industry Revenue (Million), by Country 2024 & 2032
- Figure 9: Middle East and Africa Gastric Cancer Therapy Industry Revenue Share (%), by Country 2024 & 2032
- Figure 10: South America Gastric Cancer Therapy Industry Revenue (Million), by Country 2024 & 2032
- Figure 11: South America Gastric Cancer Therapy Industry Revenue Share (%), by Country 2024 & 2032
- Figure 12: North America Gastric Cancer Therapy Industry Revenue (Million), by Therapy Type 2024 & 2032
- Figure 13: North America Gastric Cancer Therapy Industry Revenue Share (%), by Therapy Type 2024 & 2032
- Figure 14: North America Gastric Cancer Therapy Industry Revenue (Million), by End-User 2024 & 2032
- Figure 15: North America Gastric Cancer Therapy Industry Revenue Share (%), by End-User 2024 & 2032
- Figure 16: North America Gastric Cancer Therapy Industry Revenue (Million), by Country 2024 & 2032
- Figure 17: North America Gastric Cancer Therapy Industry Revenue Share (%), by Country 2024 & 2032
- Figure 18: Europe Gastric Cancer Therapy Industry Revenue (Million), by Therapy Type 2024 & 2032
- Figure 19: Europe Gastric Cancer Therapy Industry Revenue Share (%), by Therapy Type 2024 & 2032
- Figure 20: Europe Gastric Cancer Therapy Industry Revenue (Million), by End-User 2024 & 2032
- Figure 21: Europe Gastric Cancer Therapy Industry Revenue Share (%), by End-User 2024 & 2032
- Figure 22: Europe Gastric Cancer Therapy Industry Revenue (Million), by Country 2024 & 2032
- Figure 23: Europe Gastric Cancer Therapy Industry Revenue Share (%), by Country 2024 & 2032
- Figure 24: Asia Pacific Gastric Cancer Therapy Industry Revenue (Million), by Therapy Type 2024 & 2032
- Figure 25: Asia Pacific Gastric Cancer Therapy Industry Revenue Share (%), by Therapy Type 2024 & 2032
- Figure 26: Asia Pacific Gastric Cancer Therapy Industry Revenue (Million), by End-User 2024 & 2032
- Figure 27: Asia Pacific Gastric Cancer Therapy Industry Revenue Share (%), by End-User 2024 & 2032
- Figure 28: Asia Pacific Gastric Cancer Therapy Industry Revenue (Million), by Country 2024 & 2032
- Figure 29: Asia Pacific Gastric Cancer Therapy Industry Revenue Share (%), by Country 2024 & 2032
- Figure 30: Middle East and Africa Gastric Cancer Therapy Industry Revenue (Million), by Therapy Type 2024 & 2032
- Figure 31: Middle East and Africa Gastric Cancer Therapy Industry Revenue Share (%), by Therapy Type 2024 & 2032
- Figure 32: Middle East and Africa Gastric Cancer Therapy Industry Revenue (Million), by End-User 2024 & 2032
- Figure 33: Middle East and Africa Gastric Cancer Therapy Industry Revenue Share (%), by End-User 2024 & 2032
- Figure 34: Middle East and Africa Gastric Cancer Therapy Industry Revenue (Million), by Country 2024 & 2032
- Figure 35: Middle East and Africa Gastric Cancer Therapy Industry Revenue Share (%), by Country 2024 & 2032
- Figure 36: South America Gastric Cancer Therapy Industry Revenue (Million), by Therapy Type 2024 & 2032
- Figure 37: South America Gastric Cancer Therapy Industry Revenue Share (%), by Therapy Type 2024 & 2032
- Figure 38: South America Gastric Cancer Therapy Industry Revenue (Million), by End-User 2024 & 2032
- Figure 39: South America Gastric Cancer Therapy Industry Revenue Share (%), by End-User 2024 & 2032
- Figure 40: South America Gastric Cancer Therapy Industry Revenue (Million), by Country 2024 & 2032
- Figure 41: South America Gastric Cancer Therapy Industry Revenue Share (%), by Country 2024 & 2032
List of Tables
- Table 1: Global Gastric Cancer Therapy Industry Revenue Million Forecast, by Region 2019 & 2032
- Table 2: Global Gastric Cancer Therapy Industry Revenue Million Forecast, by Therapy Type 2019 & 2032
- Table 3: Global Gastric Cancer Therapy Industry Revenue Million Forecast, by End-User 2019 & 2032
- Table 4: Global Gastric Cancer Therapy Industry Revenue Million Forecast, by Region 2019 & 2032
- Table 5: Global Gastric Cancer Therapy Industry Revenue Million Forecast, by Country 2019 & 2032
- Table 6: United States Gastric Cancer Therapy Industry Revenue (Million) Forecast, by Application 2019 & 2032
- Table 7: Canada Gastric Cancer Therapy Industry Revenue (Million) Forecast, by Application 2019 & 2032
- Table 8: Mexico Gastric Cancer Therapy Industry Revenue (Million) Forecast, by Application 2019 & 2032
- Table 9: Global Gastric Cancer Therapy Industry Revenue Million Forecast, by Country 2019 & 2032
- Table 10: Germany Gastric Cancer Therapy Industry Revenue (Million) Forecast, by Application 2019 & 2032
- Table 11: United Kingdom Gastric Cancer Therapy Industry Revenue (Million) Forecast, by Application 2019 & 2032
- Table 12: France Gastric Cancer Therapy Industry Revenue (Million) Forecast, by Application 2019 & 2032
- Table 13: Italy Gastric Cancer Therapy Industry Revenue (Million) Forecast, by Application 2019 & 2032
- Table 14: Spain Gastric Cancer Therapy Industry Revenue (Million) Forecast, by Application 2019 & 2032
- Table 15: Rest of Europe Gastric Cancer Therapy Industry Revenue (Million) Forecast, by Application 2019 & 2032
- Table 16: Global Gastric Cancer Therapy Industry Revenue Million Forecast, by Country 2019 & 2032
- Table 17: China Gastric Cancer Therapy Industry Revenue (Million) Forecast, by Application 2019 & 2032
- Table 18: Japan Gastric Cancer Therapy Industry Revenue (Million) Forecast, by Application 2019 & 2032
- Table 19: India Gastric Cancer Therapy Industry Revenue (Million) Forecast, by Application 2019 & 2032
- Table 20: Australia Gastric Cancer Therapy Industry Revenue (Million) Forecast, by Application 2019 & 2032
- Table 21: South Korea Gastric Cancer Therapy Industry Revenue (Million) Forecast, by Application 2019 & 2032
- Table 22: Rest of Asia Pacific Gastric Cancer Therapy Industry Revenue (Million) Forecast, by Application 2019 & 2032
- Table 23: Global Gastric Cancer Therapy Industry Revenue Million Forecast, by Country 2019 & 2032
- Table 24: GCC Gastric Cancer Therapy Industry Revenue (Million) Forecast, by Application 2019 & 2032
- Table 25: South Africa Gastric Cancer Therapy Industry Revenue (Million) Forecast, by Application 2019 & 2032
- Table 26: Rest of Middle East and Africa Gastric Cancer Therapy Industry Revenue (Million) Forecast, by Application 2019 & 2032
- Table 27: Global Gastric Cancer Therapy Industry Revenue Million Forecast, by Country 2019 & 2032
- Table 28: Brazil Gastric Cancer Therapy Industry Revenue (Million) Forecast, by Application 2019 & 2032
- Table 29: Argentina Gastric Cancer Therapy Industry Revenue (Million) Forecast, by Application 2019 & 2032
- Table 30: Rest of South America Gastric Cancer Therapy Industry Revenue (Million) Forecast, by Application 2019 & 2032
- Table 31: Global Gastric Cancer Therapy Industry Revenue Million Forecast, by Therapy Type 2019 & 2032
- Table 32: Global Gastric Cancer Therapy Industry Revenue Million Forecast, by End-User 2019 & 2032
- Table 33: Global Gastric Cancer Therapy Industry Revenue Million Forecast, by Country 2019 & 2032
- Table 34: United States Gastric Cancer Therapy Industry Revenue (Million) Forecast, by Application 2019 & 2032
- Table 35: Canada Gastric Cancer Therapy Industry Revenue (Million) Forecast, by Application 2019 & 2032
- Table 36: Mexico Gastric Cancer Therapy Industry Revenue (Million) Forecast, by Application 2019 & 2032
- Table 37: Global Gastric Cancer Therapy Industry Revenue Million Forecast, by Therapy Type 2019 & 2032
- Table 38: Global Gastric Cancer Therapy Industry Revenue Million Forecast, by End-User 2019 & 2032
- Table 39: Global Gastric Cancer Therapy Industry Revenue Million Forecast, by Country 2019 & 2032
- Table 40: Germany Gastric Cancer Therapy Industry Revenue (Million) Forecast, by Application 2019 & 2032
- Table 41: United Kingdom Gastric Cancer Therapy Industry Revenue (Million) Forecast, by Application 2019 & 2032
- Table 42: France Gastric Cancer Therapy Industry Revenue (Million) Forecast, by Application 2019 & 2032
- Table 43: Italy Gastric Cancer Therapy Industry Revenue (Million) Forecast, by Application 2019 & 2032
- Table 44: Spain Gastric Cancer Therapy Industry Revenue (Million) Forecast, by Application 2019 & 2032
- Table 45: Rest of Europe Gastric Cancer Therapy Industry Revenue (Million) Forecast, by Application 2019 & 2032
- Table 46: Global Gastric Cancer Therapy Industry Revenue Million Forecast, by Therapy Type 2019 & 2032
- Table 47: Global Gastric Cancer Therapy Industry Revenue Million Forecast, by End-User 2019 & 2032
- Table 48: Global Gastric Cancer Therapy Industry Revenue Million Forecast, by Country 2019 & 2032
- Table 49: China Gastric Cancer Therapy Industry Revenue (Million) Forecast, by Application 2019 & 2032
- Table 50: Japan Gastric Cancer Therapy Industry Revenue (Million) Forecast, by Application 2019 & 2032
- Table 51: India Gastric Cancer Therapy Industry Revenue (Million) Forecast, by Application 2019 & 2032
- Table 52: Australia Gastric Cancer Therapy Industry Revenue (Million) Forecast, by Application 2019 & 2032
- Table 53: South Korea Gastric Cancer Therapy Industry Revenue (Million) Forecast, by Application 2019 & 2032
- Table 54: Rest of Asia Pacific Gastric Cancer Therapy Industry Revenue (Million) Forecast, by Application 2019 & 2032
- Table 55: Global Gastric Cancer Therapy Industry Revenue Million Forecast, by Therapy Type 2019 & 2032
- Table 56: Global Gastric Cancer Therapy Industry Revenue Million Forecast, by End-User 2019 & 2032
- Table 57: Global Gastric Cancer Therapy Industry Revenue Million Forecast, by Country 2019 & 2032
- Table 58: GCC Gastric Cancer Therapy Industry Revenue (Million) Forecast, by Application 2019 & 2032
- Table 59: South Africa Gastric Cancer Therapy Industry Revenue (Million) Forecast, by Application 2019 & 2032
- Table 60: Rest of Middle East and Africa Gastric Cancer Therapy Industry Revenue (Million) Forecast, by Application 2019 & 2032
- Table 61: Global Gastric Cancer Therapy Industry Revenue Million Forecast, by Therapy Type 2019 & 2032
- Table 62: Global Gastric Cancer Therapy Industry Revenue Million Forecast, by End-User 2019 & 2032
- Table 63: Global Gastric Cancer Therapy Industry Revenue Million Forecast, by Country 2019 & 2032
- Table 64: Brazil Gastric Cancer Therapy Industry Revenue (Million) Forecast, by Application 2019 & 2032
- Table 65: Argentina Gastric Cancer Therapy Industry Revenue (Million) Forecast, by Application 2019 & 2032
- Table 66: Rest of South America Gastric Cancer Therapy Industry Revenue (Million) Forecast, by Application 2019 & 2032
Frequently Asked Questions
1. What is the projected Compound Annual Growth Rate (CAGR) of the Gastric Cancer Therapy Industry?
The projected CAGR is approximately 12.63%.
2. Which companies are prominent players in the Gastric Cancer Therapy Industry?
Key companies in the market include Celltrion Healthcare Co Ltd, Astrazeneca, Novartis AG, Merck & Co Inc, F Hoffmann-La Roche Ltd, Amgen*List Not Exhaustive, Eli Lilly and Company, Otsuka Holdings Co Ltd, GSK plc, Imugene Limited, Bristol-Myers Squibb Company, Sanofi S A, Pfizer Inc.
3. What are the main segments of the Gastric Cancer Therapy Industry?
The market segments include Therapy Type, End-User.
4. Can you provide details about the market size?
The market size is estimated to be USD 5.32 Million as of 2022.
5. What are some drivers contributing to market growth?
Growing Burden of Gastric Cancer; Increase in Research and Development for Novel Therapies Coupled with Government Initiatives.
6. What are the notable trends driving market growth?
Targeted Segment is Expected to Hold a Significant Share of the Market Over the Forecast Period.
7. Are there any restraints impacting market growth?
High Cost of Cancer Therapy and Side Effects of Cancer Drugs.
8. Can you provide examples of recent developments in the market?
March 2023: Akeso, Inc., completed the patient enrollment for its pivotal Phase III clinical trial involving cadonilimab (PD-1/CTLA-4 bi-specific antibody, AK104), which stands as the world's pioneering dual-immune checkpoint bi-specific antibody drug to be approved and brought to market. This marks a step closer to the launch of cadonilimab for a major indication after the indication for treatment of cervical cancer has been approved.
9. What pricing options are available for accessing the report?
Pricing options include single-user, multi-user, and enterprise licenses priced at USD 4750, USD 5250, and USD 8750 respectively.
10. Is the market size provided in terms of value or volume?
The market size is provided in terms of value, measured in Million.
11. Are there any specific market keywords associated with the report?
Yes, the market keyword associated with the report is "Gastric Cancer Therapy Industry," which aids in identifying and referencing the specific market segment covered.
12. How do I determine which pricing option suits my needs best?
The pricing options vary based on user requirements and access needs. Individual users may opt for single-user licenses, while businesses requiring broader access may choose multi-user or enterprise licenses for cost-effective access to the report.
13. Are there any additional resources or data provided in the Gastric Cancer Therapy Industry report?
While the report offers comprehensive insights, it's advisable to review the specific contents or supplementary materials provided to ascertain if additional resources or data are available.
14. How can I stay updated on further developments or reports in the Gastric Cancer Therapy Industry?
To stay informed about further developments, trends, and reports in the Gastric Cancer Therapy Industry, consider subscribing to industry newsletters, following relevant companies and organizations, or regularly checking reputable industry news sources and publications.
Methodology
Step 1 - Identification of Relevant Samples Size from Population Database


Step 2 - Approaches for Defining Global Market Size (Value, Volume* & Price*)

Note*: In applicable scenarios
Step 3 - Data Sources
Primary Research
- Web Analytics
- Survey Reports
- Research Institute
- Latest Research Reports
- Opinion Leaders
Secondary Research
- Annual Reports
- White Paper
- Latest Press Release
- Industry Association
- Paid Database
- Investor Presentations

Step 4 - Data Triangulation
Involves using different sources of information in order to increase the validity of a study
These sources are likely to be stakeholders in a program - participants, other researchers, program staff, other community members, and so on.
Then we put all data in single framework & apply various statistical tools to find out the dynamic on the market.
During the analysis stage, feedback from the stakeholder groups would be compared to determine areas of agreement as well as areas of divergence
