

Key Insights
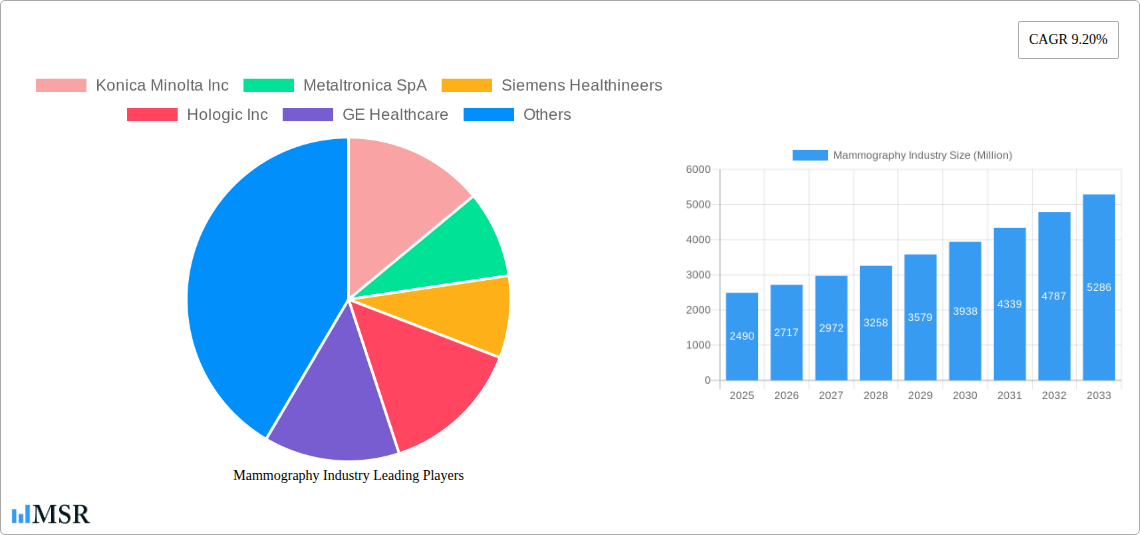
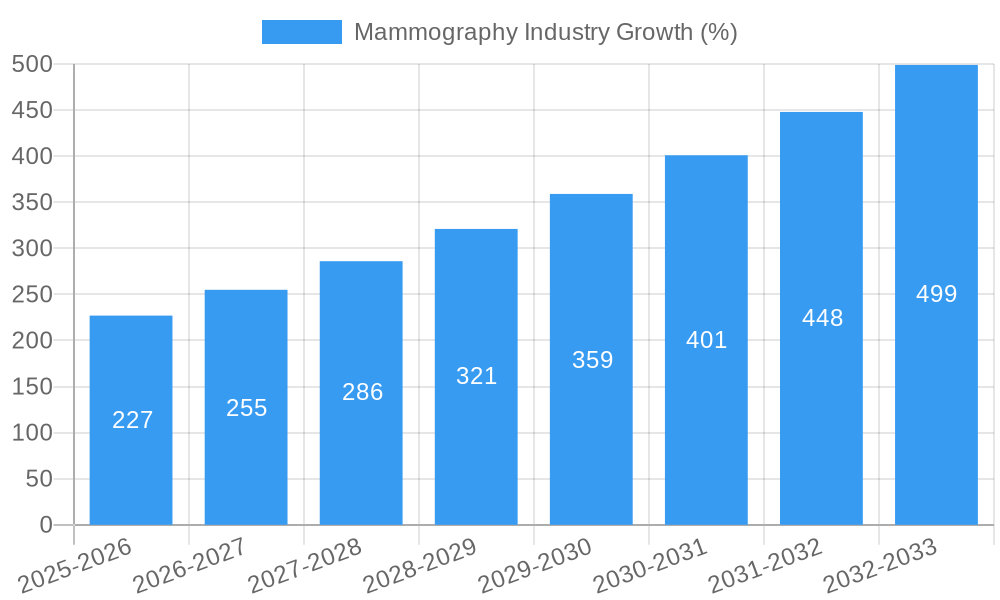
The global mammography market, valued at $2.49 billion in 2025, is projected to experience robust growth, driven by a compound annual growth rate (CAGR) of 9.20% from 2025 to 2033. This expansion is fueled by several key factors. Rising prevalence of breast cancer globally necessitates increased screening and diagnostic procedures, significantly boosting demand for mammography systems. Technological advancements, including the introduction of digital mammography, breast tomosynthesis (3D mammography) offering improved image quality and reduced false positives, and AI-powered image analysis tools enhancing diagnostic accuracy, are key drivers. Furthermore, the increasing geriatric population, a demographic at higher risk of breast cancer, contributes to market growth. Growth is also spurred by government initiatives promoting breast cancer awareness and screening programs, alongside expanding healthcare infrastructure in developing economies.
However, market growth faces certain challenges. High initial investment costs associated with advanced mammography systems, particularly tomosynthesis units, can restrict adoption, especially in resource-constrained healthcare settings. Strict regulatory approvals and reimbursement policies in various regions also pose hurdles. Despite these constraints, the market is poised for significant expansion, particularly in regions with burgeoning healthcare sectors and rising healthcare expenditure. The market segmentation reveals strong growth potential in digital mammography and breast tomosynthesis, primarily driven by improved diagnostic capabilities and patient comfort. Hospitals and specialty clinics remain the largest end-users, reflecting the concentration of mammography services within established healthcare infrastructure. Key players in the market, including Konica Minolta, Siemens Healthineers, Hologic, and GE Healthcare, are continuously investing in research and development to enhance their product offerings and expand their market share.
Mammography Industry Market Report: 2019-2033
This comprehensive report provides a detailed analysis of the global mammography industry, offering valuable insights for stakeholders, investors, and industry professionals. Covering the period 2019-2033, with a base year of 2025, this report projects a robust market expansion, driven by technological advancements and increasing demand for breast cancer screening. The report values the market at $XX Million in 2025 and projects a CAGR of XX% during the forecast period (2025-2033). Key players analyzed include Konica Minolta Inc, Metaltronica SpA, Siemens Healthineers, Hologic Inc, GE Healthcare, Carestream Health, Koninklijke Philips NV, General Medical Merate SpA, Planmed Oy, Fujifilm Holdings Corporation, and Canon Medical Systems. The report segments the market by product type (Digital Systems, Analog Systems, Breast Tomosynthesis, Other Product Types) and end-users (Hospitals, Specialty Clinics, Diagnostic Centers).
Mammography Industry Market Concentration & Dynamics
The global mammography market exhibits a moderately concentrated landscape, with a few major players holding significant market share. Market share data indicates that the top five companies account for approximately XX% of the global revenue in 2025. This concentration is driven by substantial investments in R&D, technological advancements, and strategic acquisitions. The industry is characterized by a dynamic innovation ecosystem, with continuous developments in AI-powered image analysis, 3D mammography, and personalized breast care solutions.
Regulatory frameworks, particularly those concerning medical device approvals and data privacy, significantly impact market dynamics. The presence of substitute technologies, while limited, remains a factor to consider. End-user trends show a growing preference for digital systems and advanced imaging techniques. Furthermore, M&A activities, with an estimated XX deals in the historical period (2019-2024), have played a crucial role in shaping the competitive landscape. Key M&A trends observed include:
- Consolidation among smaller players.
- Strategic acquisitions to expand product portfolios.
- Geographic expansion through partnerships and acquisitions.
Mammography Industry Industry Insights & Trends
The global mammography market experienced substantial growth in the historical period (2019-2024), reaching an estimated $XX Million in 2024. This growth is primarily attributed to several key drivers: the rising prevalence of breast cancer, increasing awareness about early detection, technological advancements leading to improved diagnostic accuracy, and expanding healthcare infrastructure, especially in developing economies. Technological disruptions, such as the integration of AI and machine learning in image analysis, are revolutionizing the industry, enhancing diagnostic capabilities and efficiency. Evolving consumer behaviors, characterized by a greater demand for personalized and convenient healthcare services, are also shaping market trends. The projected market size for 2025 is $XX Million, reflecting a continued upward trajectory fueled by these factors.
Key Markets & Segments Leading Mammography Industry
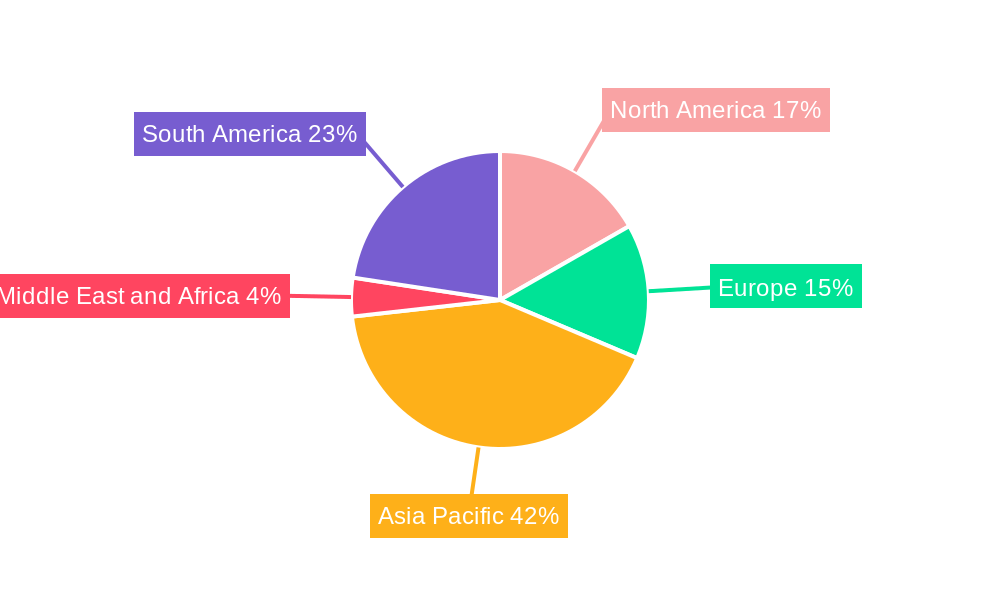
The North American region holds a dominant position in the global mammography market, driven by factors such as high breast cancer incidence rates, advanced healthcare infrastructure, and high adoption of advanced imaging technologies. Within this region, the United States is the largest market.
Product Type Dominance: Digital mammography systems hold the largest market share, owing to their superior image quality, ease of use, and potential for integration with other diagnostic tools. Breast tomosynthesis is witnessing rapid growth, driven by its enhanced cancer detection capabilities.
End-User Segment: Hospitals dominate the end-user segment, followed by specialty clinics and diagnostic centers. This dominance is influenced by factors like their established infrastructure, technical expertise, and high patient volumes.
Growth Drivers: The primary drivers for market growth in these segments include:
- Robust economic growth, enabling higher healthcare spending.
- Increased government funding for cancer screening programs.
- Growing healthcare infrastructure and investment in advanced imaging equipment.
- Improved access to healthcare services and higher awareness about breast cancer screening.
Mammography Industry Product Developments
Recent years have witnessed significant product innovations, particularly in the areas of digital mammography, tomosynthesis, and AI-powered image analysis. Manufacturers are increasingly focusing on developing systems with improved image quality, reduced radiation exposure, and enhanced diagnostic accuracy. The integration of AI is enabling automated image analysis, assisting radiologists in identifying suspicious lesions and reducing the risk of false positives or negatives. These advancements enhance the efficiency and efficacy of breast cancer screening, creating a competitive edge for manufacturers.
Challenges in the Mammography Industry Market
The mammography industry faces several challenges, including stringent regulatory hurdles for new product approvals, complex supply chain dynamics impacting the availability and cost of components, and intense competitive pressures from established players and emerging technology providers. These factors collectively constrain market growth and profitability. The impact is estimated to reduce market growth by approximately XX% annually.
Forces Driving Mammography Industry Growth
Several factors are driving the growth of the mammography industry. Technological advancements, particularly in AI-powered image analysis and 3D mammography, are improving diagnostic accuracy and efficiency. The increasing prevalence of breast cancer globally necessitates widespread screening, fueling market demand. Government initiatives promoting breast cancer awareness and screening programs also stimulate growth. Furthermore, favorable reimbursement policies in many countries make mammography more accessible.
Long-Term Growth Catalysts in the Mammography Industry
Long-term growth in the mammography market hinges on sustained innovation, strategic partnerships, and expansion into emerging markets. The development of more sophisticated AI algorithms for improved image analysis and personalized treatment plans will be crucial. Collaborations between technology companies and healthcare providers will facilitate the widespread adoption of advanced technologies. Expanding market penetration in underserved regions will further unlock growth potential.
Emerging Opportunities in Mammography Industry
Emerging opportunities in the mammography market include the integration of advanced imaging techniques with AI-driven analytics for personalized breast care, the development of portable and point-of-care mammography systems to improve accessibility in remote areas, and expansion into new markets with high prevalence rates of breast cancer and rising healthcare expenditure. The increasing demand for telemammography and remote diagnostics also presents significant growth prospects.
Leading Players in the Mammography Industry Sector
- Konica Minolta Inc
- Metaltronica SpA
- Siemens Healthineers
- Hologic Inc
- GE Healthcare
- Carestream Health
- Koninklijke Philips NV
- General Medical Merate SpA
- Planmed Oy
- Fujifilm Holdings Corporation
- Canon Medical Systems
Key Milestones in Mammography Industry Industry
- May 2022: Volpara Health launched updated products for its AI-driven breast care platform at the SBI/ACR Breast Imaging Symposium 2022, enhancing mammography quality, reporting, and risk assessment.
- January 2022: ScreenPoint Medical expanded its reach to the United States and 30 countries with the launch of Transpara, an AI-powered breast care system.
Strategic Outlook for Mammography Industry Market
The mammography market is poised for continued growth, driven by ongoing technological advancements, increased awareness of breast cancer, and expanding healthcare infrastructure. Strategic opportunities exist in developing AI-powered diagnostic tools, expanding into emerging markets, and fostering collaborations to optimize workflow efficiency and improve patient care. The market's future hinges on innovation, strategic partnerships, and a focus on personalized and efficient breast cancer screening solutions.
Mammography Industry Segmentation
-
1. Product Type
- 1.1. Digital Systems
- 1.2. Analog Systems
- 1.3. Breast Tomosynthesis
- 1.4. Other Product Types
-
2. End Users
- 2.1. Hospitals
- 2.2. Specialty Clinics
- 2.3. Diagnostic Centers
Mammography Industry Segmentation By Geography
-
1. North America
- 1.1. United States
- 1.2. Canada
- 1.3. Mexico
-
2. Europe
- 2.1. Germany
- 2.2. United Kingdom
- 2.3. France
- 2.4. Italy
- 2.5. Spain
- 2.6. Rest of Europe
-
3. Asia Pacific
- 3.1. China
- 3.2. Japan
- 3.3. India
- 3.4. Australia
- 3.5. South Korea
- 3.6. Rest of Asia Pacific
-
4. Middle East and Africa
- 4.1. GCC
- 4.2. South Africa
- 4.3. Rest of Middle East and Africa
-
5. South America
- 5.1. Brazil
- 5.2. Argentina
- 5.3. Rest of South America
Mammography Industry REPORT HIGHLIGHTS
| Aspects | Details |
|---|---|
| Study Period | 2019-2033 |
| Base Year | 2024 |
| Estimated Year | 2025 |
| Forecast Period | 2025-2033 |
| Historical Period | 2019-2024 |
| Growth Rate | CAGR of 9.20% from 2019-2033 |
| Segmentation |
|
Table of Contents
- 1. Introduction
- 1.1. Research Scope
- 1.2. Market Segmentation
- 1.3. Research Methodology
- 1.4. Definitions and Assumptions
- 2. Executive Summary
- 2.1. Introduction
- 3. Market Dynamics
- 3.1. Introduction
- 3.2. Market Drivers
- 3.2.1. Growing Burden of Breast Cancer; Technological Advancements in the Field of Breast Imaging; Investment from Various Organizations in Breast Cancer Screening Campaigns
- 3.3. Market Restrains
- 3.3.1. Risk of Adverse Effects from Radiation Exposure; Reduction in Reimbursement
- 3.4. Market Trends
- 3.4.1. The Digital Mammography Segment is Expected to Account for the Large Market Share During the Forecast Period
- 4. Market Factor Analysis
- 4.1. Porters Five Forces
- 4.2. Supply/Value Chain
- 4.3. PESTEL analysis
- 4.4. Market Entropy
- 4.5. Patent/Trademark Analysis
- 5. Global Mammography Industry Analysis, Insights and Forecast, 2019-2031
- 5.1. Market Analysis, Insights and Forecast - by Product Type
- 5.1.1. Digital Systems
- 5.1.2. Analog Systems
- 5.1.3. Breast Tomosynthesis
- 5.1.4. Other Product Types
- 5.2. Market Analysis, Insights and Forecast - by End Users
- 5.2.1. Hospitals
- 5.2.2. Specialty Clinics
- 5.2.3. Diagnostic Centers
- 5.3. Market Analysis, Insights and Forecast - by Region
- 5.3.1. North America
- 5.3.2. Europe
- 5.3.3. Asia Pacific
- 5.3.4. Middle East and Africa
- 5.3.5. South America
- 5.1. Market Analysis, Insights and Forecast - by Product Type
- 6. North America Mammography Industry Analysis, Insights and Forecast, 2019-2031
- 6.1. Market Analysis, Insights and Forecast - by Product Type
- 6.1.1. Digital Systems
- 6.1.2. Analog Systems
- 6.1.3. Breast Tomosynthesis
- 6.1.4. Other Product Types
- 6.2. Market Analysis, Insights and Forecast - by End Users
- 6.2.1. Hospitals
- 6.2.2. Specialty Clinics
- 6.2.3. Diagnostic Centers
- 6.1. Market Analysis, Insights and Forecast - by Product Type
- 7. Europe Mammography Industry Analysis, Insights and Forecast, 2019-2031
- 7.1. Market Analysis, Insights and Forecast - by Product Type
- 7.1.1. Digital Systems
- 7.1.2. Analog Systems
- 7.1.3. Breast Tomosynthesis
- 7.1.4. Other Product Types
- 7.2. Market Analysis, Insights and Forecast - by End Users
- 7.2.1. Hospitals
- 7.2.2. Specialty Clinics
- 7.2.3. Diagnostic Centers
- 7.1. Market Analysis, Insights and Forecast - by Product Type
- 8. Asia Pacific Mammography Industry Analysis, Insights and Forecast, 2019-2031
- 8.1. Market Analysis, Insights and Forecast - by Product Type
- 8.1.1. Digital Systems
- 8.1.2. Analog Systems
- 8.1.3. Breast Tomosynthesis
- 8.1.4. Other Product Types
- 8.2. Market Analysis, Insights and Forecast - by End Users
- 8.2.1. Hospitals
- 8.2.2. Specialty Clinics
- 8.2.3. Diagnostic Centers
- 8.1. Market Analysis, Insights and Forecast - by Product Type
- 9. Middle East and Africa Mammography Industry Analysis, Insights and Forecast, 2019-2031
- 9.1. Market Analysis, Insights and Forecast - by Product Type
- 9.1.1. Digital Systems
- 9.1.2. Analog Systems
- 9.1.3. Breast Tomosynthesis
- 9.1.4. Other Product Types
- 9.2. Market Analysis, Insights and Forecast - by End Users
- 9.2.1. Hospitals
- 9.2.2. Specialty Clinics
- 9.2.3. Diagnostic Centers
- 9.1. Market Analysis, Insights and Forecast - by Product Type
- 10. South America Mammography Industry Analysis, Insights and Forecast, 2019-2031
- 10.1. Market Analysis, Insights and Forecast - by Product Type
- 10.1.1. Digital Systems
- 10.1.2. Analog Systems
- 10.1.3. Breast Tomosynthesis
- 10.1.4. Other Product Types
- 10.2. Market Analysis, Insights and Forecast - by End Users
- 10.2.1. Hospitals
- 10.2.2. Specialty Clinics
- 10.2.3. Diagnostic Centers
- 10.1. Market Analysis, Insights and Forecast - by Product Type
- 11. North America Mammography Industry Analysis, Insights and Forecast, 2019-2031
- 11.1. Market Analysis, Insights and Forecast - By Country/Sub-region
- 11.1.1 United States
- 11.1.2 Canada
- 11.1.3 Mexico
- 12. Europe Mammography Industry Analysis, Insights and Forecast, 2019-2031
- 12.1. Market Analysis, Insights and Forecast - By Country/Sub-region
- 12.1.1 Germany
- 12.1.2 United Kingdom
- 12.1.3 France
- 12.1.4 Italy
- 12.1.5 Spain
- 12.1.6 Rest of Europe
- 13. Asia Pacific Mammography Industry Analysis, Insights and Forecast, 2019-2031
- 13.1. Market Analysis, Insights and Forecast - By Country/Sub-region
- 13.1.1 China
- 13.1.2 Japan
- 13.1.3 India
- 13.1.4 Australia
- 13.1.5 South Korea
- 13.1.6 Rest of Asia Pacific
- 14. Middle East and Africa Mammography Industry Analysis, Insights and Forecast, 2019-2031
- 14.1. Market Analysis, Insights and Forecast - By Country/Sub-region
- 14.1.1 GCC
- 14.1.2 South Africa
- 14.1.3 Rest of Middle East and Africa
- 15. South America Mammography Industry Analysis, Insights and Forecast, 2019-2031
- 15.1. Market Analysis, Insights and Forecast - By Country/Sub-region
- 15.1.1 Brazil
- 15.1.2 Argentina
- 15.1.3 Rest of South America
- 16. Competitive Analysis
- 16.1. Global Market Share Analysis 2024
- 16.2. Company Profiles
- 16.2.1 Konica Minolta Inc
- 16.2.1.1. Overview
- 16.2.1.2. Products
- 16.2.1.3. SWOT Analysis
- 16.2.1.4. Recent Developments
- 16.2.1.5. Financials (Based on Availability)
- 16.2.2 Metaltronica SpA
- 16.2.2.1. Overview
- 16.2.2.2. Products
- 16.2.2.3. SWOT Analysis
- 16.2.2.4. Recent Developments
- 16.2.2.5. Financials (Based on Availability)
- 16.2.3 Siemens Healthineers
- 16.2.3.1. Overview
- 16.2.3.2. Products
- 16.2.3.3. SWOT Analysis
- 16.2.3.4. Recent Developments
- 16.2.3.5. Financials (Based on Availability)
- 16.2.4 Hologic Inc
- 16.2.4.1. Overview
- 16.2.4.2. Products
- 16.2.4.3. SWOT Analysis
- 16.2.4.4. Recent Developments
- 16.2.4.5. Financials (Based on Availability)
- 16.2.5 GE Healthcare
- 16.2.5.1. Overview
- 16.2.5.2. Products
- 16.2.5.3. SWOT Analysis
- 16.2.5.4. Recent Developments
- 16.2.5.5. Financials (Based on Availability)
- 16.2.6 Carestream Health
- 16.2.6.1. Overview
- 16.2.6.2. Products
- 16.2.6.3. SWOT Analysis
- 16.2.6.4. Recent Developments
- 16.2.6.5. Financials (Based on Availability)
- 16.2.7 Koninklijke Philips NV
- 16.2.7.1. Overview
- 16.2.7.2. Products
- 16.2.7.3. SWOT Analysis
- 16.2.7.4. Recent Developments
- 16.2.7.5. Financials (Based on Availability)
- 16.2.8 General Medical Merate SpA
- 16.2.8.1. Overview
- 16.2.8.2. Products
- 16.2.8.3. SWOT Analysis
- 16.2.8.4. Recent Developments
- 16.2.8.5. Financials (Based on Availability)
- 16.2.9 Planmed Oy
- 16.2.9.1. Overview
- 16.2.9.2. Products
- 16.2.9.3. SWOT Analysis
- 16.2.9.4. Recent Developments
- 16.2.9.5. Financials (Based on Availability)
- 16.2.10 Fujifilm Holdings Corporation
- 16.2.10.1. Overview
- 16.2.10.2. Products
- 16.2.10.3. SWOT Analysis
- 16.2.10.4. Recent Developments
- 16.2.10.5. Financials (Based on Availability)
- 16.2.11 Canon Medical Systems
- 16.2.11.1. Overview
- 16.2.11.2. Products
- 16.2.11.3. SWOT Analysis
- 16.2.11.4. Recent Developments
- 16.2.11.5. Financials (Based on Availability)
- 16.2.1 Konica Minolta Inc
List of Figures
- Figure 1: Global Mammography Industry Revenue Breakdown (Million, %) by Region 2024 & 2032
- Figure 2: North America Mammography Industry Revenue (Million), by Country 2024 & 2032
- Figure 3: North America Mammography Industry Revenue Share (%), by Country 2024 & 2032
- Figure 4: Europe Mammography Industry Revenue (Million), by Country 2024 & 2032
- Figure 5: Europe Mammography Industry Revenue Share (%), by Country 2024 & 2032
- Figure 6: Asia Pacific Mammography Industry Revenue (Million), by Country 2024 & 2032
- Figure 7: Asia Pacific Mammography Industry Revenue Share (%), by Country 2024 & 2032
- Figure 8: Middle East and Africa Mammography Industry Revenue (Million), by Country 2024 & 2032
- Figure 9: Middle East and Africa Mammography Industry Revenue Share (%), by Country 2024 & 2032
- Figure 10: South America Mammography Industry Revenue (Million), by Country 2024 & 2032
- Figure 11: South America Mammography Industry Revenue Share (%), by Country 2024 & 2032
- Figure 12: North America Mammography Industry Revenue (Million), by Product Type 2024 & 2032
- Figure 13: North America Mammography Industry Revenue Share (%), by Product Type 2024 & 2032
- Figure 14: North America Mammography Industry Revenue (Million), by End Users 2024 & 2032
- Figure 15: North America Mammography Industry Revenue Share (%), by End Users 2024 & 2032
- Figure 16: North America Mammography Industry Revenue (Million), by Country 2024 & 2032
- Figure 17: North America Mammography Industry Revenue Share (%), by Country 2024 & 2032
- Figure 18: Europe Mammography Industry Revenue (Million), by Product Type 2024 & 2032
- Figure 19: Europe Mammography Industry Revenue Share (%), by Product Type 2024 & 2032
- Figure 20: Europe Mammography Industry Revenue (Million), by End Users 2024 & 2032
- Figure 21: Europe Mammography Industry Revenue Share (%), by End Users 2024 & 2032
- Figure 22: Europe Mammography Industry Revenue (Million), by Country 2024 & 2032
- Figure 23: Europe Mammography Industry Revenue Share (%), by Country 2024 & 2032
- Figure 24: Asia Pacific Mammography Industry Revenue (Million), by Product Type 2024 & 2032
- Figure 25: Asia Pacific Mammography Industry Revenue Share (%), by Product Type 2024 & 2032
- Figure 26: Asia Pacific Mammography Industry Revenue (Million), by End Users 2024 & 2032
- Figure 27: Asia Pacific Mammography Industry Revenue Share (%), by End Users 2024 & 2032
- Figure 28: Asia Pacific Mammography Industry Revenue (Million), by Country 2024 & 2032
- Figure 29: Asia Pacific Mammography Industry Revenue Share (%), by Country 2024 & 2032
- Figure 30: Middle East and Africa Mammography Industry Revenue (Million), by Product Type 2024 & 2032
- Figure 31: Middle East and Africa Mammography Industry Revenue Share (%), by Product Type 2024 & 2032
- Figure 32: Middle East and Africa Mammography Industry Revenue (Million), by End Users 2024 & 2032
- Figure 33: Middle East and Africa Mammography Industry Revenue Share (%), by End Users 2024 & 2032
- Figure 34: Middle East and Africa Mammography Industry Revenue (Million), by Country 2024 & 2032
- Figure 35: Middle East and Africa Mammography Industry Revenue Share (%), by Country 2024 & 2032
- Figure 36: South America Mammography Industry Revenue (Million), by Product Type 2024 & 2032
- Figure 37: South America Mammography Industry Revenue Share (%), by Product Type 2024 & 2032
- Figure 38: South America Mammography Industry Revenue (Million), by End Users 2024 & 2032
- Figure 39: South America Mammography Industry Revenue Share (%), by End Users 2024 & 2032
- Figure 40: South America Mammography Industry Revenue (Million), by Country 2024 & 2032
- Figure 41: South America Mammography Industry Revenue Share (%), by Country 2024 & 2032
List of Tables
- Table 1: Global Mammography Industry Revenue Million Forecast, by Region 2019 & 2032
- Table 2: Global Mammography Industry Revenue Million Forecast, by Product Type 2019 & 2032
- Table 3: Global Mammography Industry Revenue Million Forecast, by End Users 2019 & 2032
- Table 4: Global Mammography Industry Revenue Million Forecast, by Region 2019 & 2032
- Table 5: Global Mammography Industry Revenue Million Forecast, by Country 2019 & 2032
- Table 6: United States Mammography Industry Revenue (Million) Forecast, by Application 2019 & 2032
- Table 7: Canada Mammography Industry Revenue (Million) Forecast, by Application 2019 & 2032
- Table 8: Mexico Mammography Industry Revenue (Million) Forecast, by Application 2019 & 2032
- Table 9: Global Mammography Industry Revenue Million Forecast, by Country 2019 & 2032
- Table 10: Germany Mammography Industry Revenue (Million) Forecast, by Application 2019 & 2032
- Table 11: United Kingdom Mammography Industry Revenue (Million) Forecast, by Application 2019 & 2032
- Table 12: France Mammography Industry Revenue (Million) Forecast, by Application 2019 & 2032
- Table 13: Italy Mammography Industry Revenue (Million) Forecast, by Application 2019 & 2032
- Table 14: Spain Mammography Industry Revenue (Million) Forecast, by Application 2019 & 2032
- Table 15: Rest of Europe Mammography Industry Revenue (Million) Forecast, by Application 2019 & 2032
- Table 16: Global Mammography Industry Revenue Million Forecast, by Country 2019 & 2032
- Table 17: China Mammography Industry Revenue (Million) Forecast, by Application 2019 & 2032
- Table 18: Japan Mammography Industry Revenue (Million) Forecast, by Application 2019 & 2032
- Table 19: India Mammography Industry Revenue (Million) Forecast, by Application 2019 & 2032
- Table 20: Australia Mammography Industry Revenue (Million) Forecast, by Application 2019 & 2032
- Table 21: South Korea Mammography Industry Revenue (Million) Forecast, by Application 2019 & 2032
- Table 22: Rest of Asia Pacific Mammography Industry Revenue (Million) Forecast, by Application 2019 & 2032
- Table 23: Global Mammography Industry Revenue Million Forecast, by Country 2019 & 2032
- Table 24: GCC Mammography Industry Revenue (Million) Forecast, by Application 2019 & 2032
- Table 25: South Africa Mammography Industry Revenue (Million) Forecast, by Application 2019 & 2032
- Table 26: Rest of Middle East and Africa Mammography Industry Revenue (Million) Forecast, by Application 2019 & 2032
- Table 27: Global Mammography Industry Revenue Million Forecast, by Country 2019 & 2032
- Table 28: Brazil Mammography Industry Revenue (Million) Forecast, by Application 2019 & 2032
- Table 29: Argentina Mammography Industry Revenue (Million) Forecast, by Application 2019 & 2032
- Table 30: Rest of South America Mammography Industry Revenue (Million) Forecast, by Application 2019 & 2032
- Table 31: Global Mammography Industry Revenue Million Forecast, by Product Type 2019 & 2032
- Table 32: Global Mammography Industry Revenue Million Forecast, by End Users 2019 & 2032
- Table 33: Global Mammography Industry Revenue Million Forecast, by Country 2019 & 2032
- Table 34: United States Mammography Industry Revenue (Million) Forecast, by Application 2019 & 2032
- Table 35: Canada Mammography Industry Revenue (Million) Forecast, by Application 2019 & 2032
- Table 36: Mexico Mammography Industry Revenue (Million) Forecast, by Application 2019 & 2032
- Table 37: Global Mammography Industry Revenue Million Forecast, by Product Type 2019 & 2032
- Table 38: Global Mammography Industry Revenue Million Forecast, by End Users 2019 & 2032
- Table 39: Global Mammography Industry Revenue Million Forecast, by Country 2019 & 2032
- Table 40: Germany Mammography Industry Revenue (Million) Forecast, by Application 2019 & 2032
- Table 41: United Kingdom Mammography Industry Revenue (Million) Forecast, by Application 2019 & 2032
- Table 42: France Mammography Industry Revenue (Million) Forecast, by Application 2019 & 2032
- Table 43: Italy Mammography Industry Revenue (Million) Forecast, by Application 2019 & 2032
- Table 44: Spain Mammography Industry Revenue (Million) Forecast, by Application 2019 & 2032
- Table 45: Rest of Europe Mammography Industry Revenue (Million) Forecast, by Application 2019 & 2032
- Table 46: Global Mammography Industry Revenue Million Forecast, by Product Type 2019 & 2032
- Table 47: Global Mammography Industry Revenue Million Forecast, by End Users 2019 & 2032
- Table 48: Global Mammography Industry Revenue Million Forecast, by Country 2019 & 2032
- Table 49: China Mammography Industry Revenue (Million) Forecast, by Application 2019 & 2032
- Table 50: Japan Mammography Industry Revenue (Million) Forecast, by Application 2019 & 2032
- Table 51: India Mammography Industry Revenue (Million) Forecast, by Application 2019 & 2032
- Table 52: Australia Mammography Industry Revenue (Million) Forecast, by Application 2019 & 2032
- Table 53: South Korea Mammography Industry Revenue (Million) Forecast, by Application 2019 & 2032
- Table 54: Rest of Asia Pacific Mammography Industry Revenue (Million) Forecast, by Application 2019 & 2032
- Table 55: Global Mammography Industry Revenue Million Forecast, by Product Type 2019 & 2032
- Table 56: Global Mammography Industry Revenue Million Forecast, by End Users 2019 & 2032
- Table 57: Global Mammography Industry Revenue Million Forecast, by Country 2019 & 2032
- Table 58: GCC Mammography Industry Revenue (Million) Forecast, by Application 2019 & 2032
- Table 59: South Africa Mammography Industry Revenue (Million) Forecast, by Application 2019 & 2032
- Table 60: Rest of Middle East and Africa Mammography Industry Revenue (Million) Forecast, by Application 2019 & 2032
- Table 61: Global Mammography Industry Revenue Million Forecast, by Product Type 2019 & 2032
- Table 62: Global Mammography Industry Revenue Million Forecast, by End Users 2019 & 2032
- Table 63: Global Mammography Industry Revenue Million Forecast, by Country 2019 & 2032
- Table 64: Brazil Mammography Industry Revenue (Million) Forecast, by Application 2019 & 2032
- Table 65: Argentina Mammography Industry Revenue (Million) Forecast, by Application 2019 & 2032
- Table 66: Rest of South America Mammography Industry Revenue (Million) Forecast, by Application 2019 & 2032
Frequently Asked Questions
1. What is the projected Compound Annual Growth Rate (CAGR) of the Mammography Industry?
The projected CAGR is approximately 9.20%.
2. Which companies are prominent players in the Mammography Industry?
Key companies in the market include Konica Minolta Inc, Metaltronica SpA, Siemens Healthineers, Hologic Inc, GE Healthcare, Carestream Health, Koninklijke Philips NV, General Medical Merate SpA, Planmed Oy, Fujifilm Holdings Corporation, Canon Medical Systems.
3. What are the main segments of the Mammography Industry?
The market segments include Product Type, End Users.
4. Can you provide details about the market size?
The market size is estimated to be USD 2.49 Million as of 2022.
5. What are some drivers contributing to market growth?
Growing Burden of Breast Cancer; Technological Advancements in the Field of Breast Imaging; Investment from Various Organizations in Breast Cancer Screening Campaigns.
6. What are the notable trends driving market growth?
The Digital Mammography Segment is Expected to Account for the Large Market Share During the Forecast Period.
7. Are there any restraints impacting market growth?
Risk of Adverse Effects from Radiation Exposure; Reduction in Reimbursement.
8. Can you provide examples of recent developments in the market?
In May 2022, Volpara Health introduced updated products for its integrated platform for the delivery of personalized breast care at the SBI/ACR Breast Imaging Symposium 2022. Volpara's AI-driven breast software tools provide mammography quality and reporting, volumetric breast density measurements, and cancer risk assessment.
9. What pricing options are available for accessing the report?
Pricing options include single-user, multi-user, and enterprise licenses priced at USD 4750, USD 5250, and USD 8750 respectively.
10. Is the market size provided in terms of value or volume?
The market size is provided in terms of value, measured in Million.
11. Are there any specific market keywords associated with the report?
Yes, the market keyword associated with the report is "Mammography Industry," which aids in identifying and referencing the specific market segment covered.
12. How do I determine which pricing option suits my needs best?
The pricing options vary based on user requirements and access needs. Individual users may opt for single-user licenses, while businesses requiring broader access may choose multi-user or enterprise licenses for cost-effective access to the report.
13. Are there any additional resources or data provided in the Mammography Industry report?
While the report offers comprehensive insights, it's advisable to review the specific contents or supplementary materials provided to ascertain if additional resources or data are available.
14. How can I stay updated on further developments or reports in the Mammography Industry?
To stay informed about further developments, trends, and reports in the Mammography Industry, consider subscribing to industry newsletters, following relevant companies and organizations, or regularly checking reputable industry news sources and publications.
Methodology
Step 1 - Identification of Relevant Samples Size from Population Database


Step 2 - Approaches for Defining Global Market Size (Value, Volume* & Price*)

Note*: In applicable scenarios
Step 3 - Data Sources
Primary Research
- Web Analytics
- Survey Reports
- Research Institute
- Latest Research Reports
- Opinion Leaders
Secondary Research
- Annual Reports
- White Paper
- Latest Press Release
- Industry Association
- Paid Database
- Investor Presentations

Step 4 - Data Triangulation
Involves using different sources of information in order to increase the validity of a study
These sources are likely to be stakeholders in a program - participants, other researchers, program staff, other community members, and so on.
Then we put all data in single framework & apply various statistical tools to find out the dynamic on the market.
During the analysis stage, feedback from the stakeholder groups would be compared to determine areas of agreement as well as areas of divergence
