

Key Insights
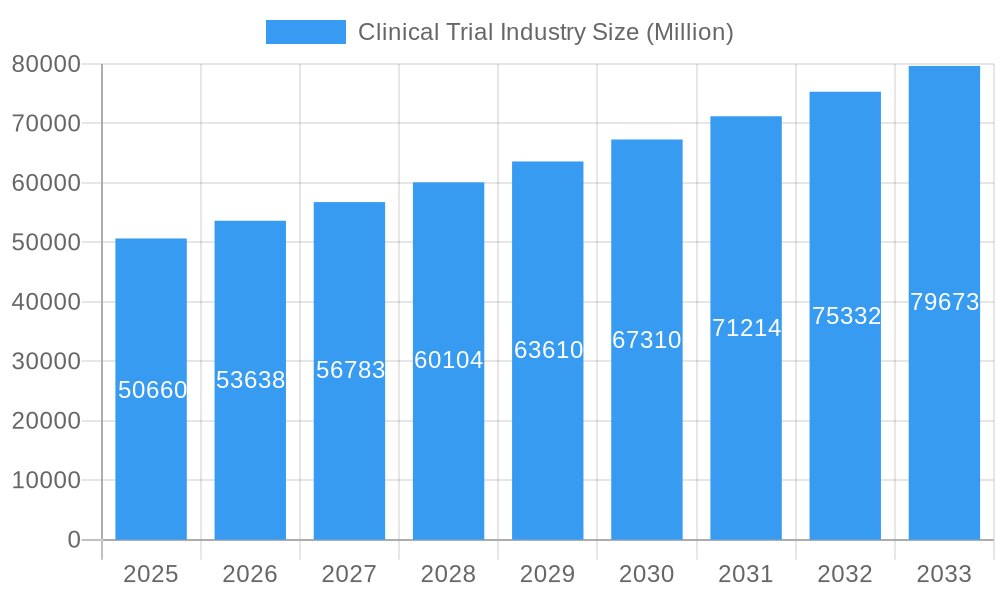
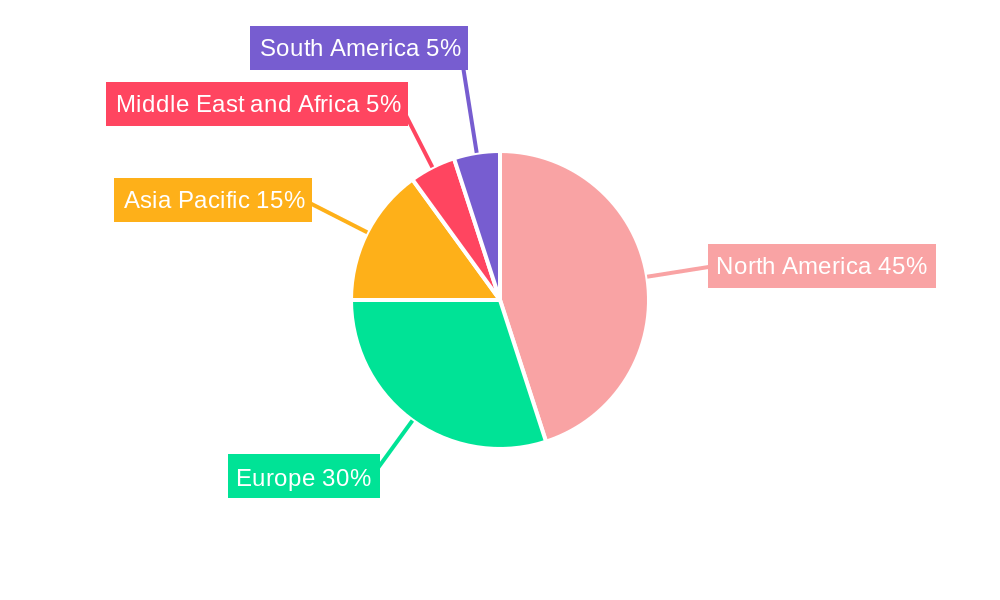
The global clinical trial industry, valued at $50.66 billion in 2025, is projected to experience robust growth, driven by several key factors. The increasing prevalence of chronic diseases like cancer, diabetes, and cardiovascular conditions fuels the demand for novel therapies, directly impacting the number of clinical trials conducted. Technological advancements, such as AI and machine learning in trial design and patient recruitment, are streamlining processes and accelerating drug development timelines. Furthermore, the growing adoption of decentralized clinical trials (DCTs) expands geographical reach and enhances patient participation, boosting market growth. Regulatory approvals for innovative therapies also contribute significantly to this upward trajectory. The industry is segmented by design (randomized controlled trials and observational studies), phase (I-IV), and geographic location, with North America currently holding a substantial market share due to the presence of major pharmaceutical companies and robust regulatory frameworks. However, challenges remain, including high costs associated with conducting trials, stringent regulatory requirements, and the complexities of patient recruitment and data management.
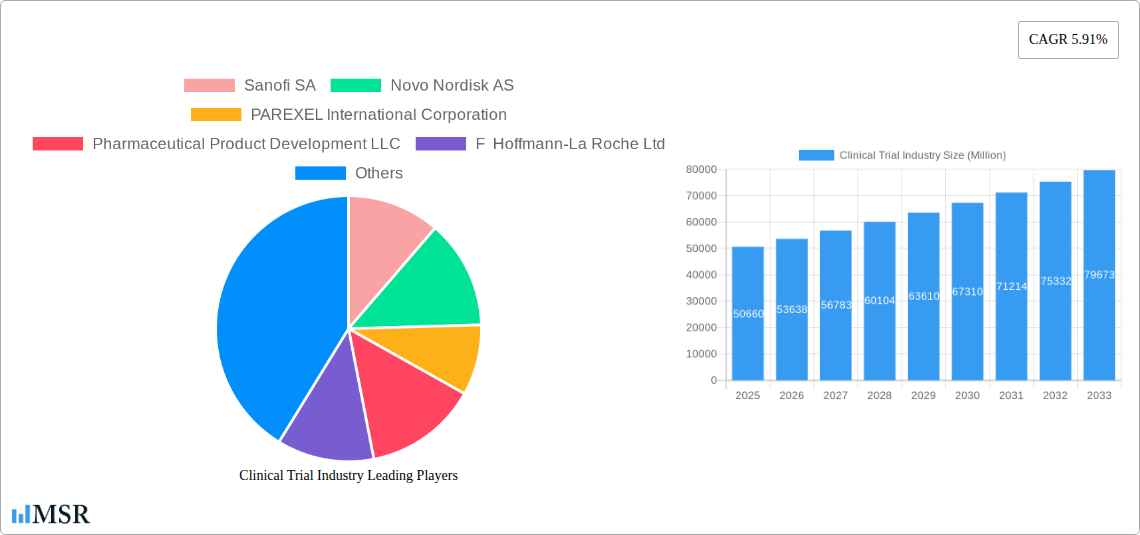
Clinical Trial Industry Market Size (In Billion)
Despite these challenges, the market's positive outlook persists. The 5.91% CAGR projected through 2033 suggests a continuous expansion. Emerging markets in Asia-Pacific and other developing regions present significant opportunities for growth. Companies like Sanofi, Novo Nordisk, and Pfizer are actively involved in shaping the landscape through investments in research and development, partnerships, and acquisitions. The increasing focus on personalized medicine and advancements in genomic research further fuel the demand for specialized clinical trials, driving market segmentation and specialization within the industry. Competition among Contract Research Organizations (CROs) is expected to remain fierce, necessitating continuous innovation and efficiency improvements to maintain a competitive edge.
Clinical Trial Industry Company Market Share
Clinical Trial Industry Market Report: 2019-2033
This comprehensive report provides a detailed analysis of the Clinical Trial Industry, projecting a market value of $XX Million by 2033. This in-depth study covers market dynamics, key players, emerging trends, and future growth opportunities, offering actionable insights for industry stakeholders. The report covers the period 2019-2033, with a base year of 2025 and a forecast period of 2025-2033. We examine key segments including Treatment Studies, Observational Studies, and Phases I-IV trials.
Clinical Trial Industry Market Concentration & Dynamics
The global clinical trial market exhibits a moderately concentrated landscape, with key players like Sanofi SA, Novo Nordisk AS, PAREXEL International Corporation, Pharmaceutical Product Development LLC, F Hoffmann-La Roche Ltd, Syneos Health, ICON PLC, Eli Lilly and Company, and IQVIA holding significant market share. The combined market share of the top 10 companies is estimated at 60% in 2025.
- Market Share: Top 10 players hold an estimated 60% market share in 2025.
- M&A Activity: The period 2019-2024 witnessed approximately 150 major M&A deals, driven by strategic expansions and technological integration.
- Innovation Ecosystems: Significant investments in AI, big data analytics, and digital technologies are transforming clinical trial design and execution.
- Regulatory Frameworks: Stringent regulatory compliance and evolving guidelines impact market growth and operational costs.
- Substitute Products: The absence of readily available substitutes reinforces the market's resilience.
- End-User Trends: Increasing demand for personalized medicine and advanced therapies drives market growth.
Clinical Trial Industry Industry Insights & Trends
The global clinical trial market is projected to experience robust growth, with a CAGR of xx% from 2025 to 2033, reaching an estimated value of $XX Million by 2033. This growth is fueled by several key factors: the rising prevalence of chronic diseases, escalating R&D investments by pharmaceutical and biotechnology companies, technological advancements enabling more efficient and cost-effective trials, and increasing government funding for clinical research. The growing adoption of decentralized clinical trials (DCTs) is disrupting the traditional clinical trial model, improving patient engagement and trial efficiency. The market is also experiencing a shift towards outcome-based pricing models and an increased focus on real-world evidence generation.
Key Markets & Segments Leading Clinical Trial Industry
The North American region dominates the clinical trial market, driven by robust R&D investments, advanced healthcare infrastructure, and a large patient pool. Europe holds the second largest market share. Within segments:
- Dominant Regions: North America and Europe
Segment Analysis:
- Design: Treatment studies represent a larger segment compared to observational studies due to high demand for new therapies.
- Phase: Phase III clinical trials dominate due to the pivotal nature of data collected during this stage. However, there is substantial growth in Phase I trials related to the influx of novel drug candidates.
Drivers:
- Economic Growth: Increased healthcare spending in developed and emerging economies fuels market growth.
- Technological Advancements: Adoption of AI, big data, and DCTs enhances efficiency and reduces costs.
- Favorable Regulatory Environment: Supportive regulatory frameworks in key markets facilitate research and development.
Clinical Trial Industry Product Developments
Significant advancements in clinical trial technologies are revolutionizing the industry. The integration of AI and machine learning improves patient recruitment, data analysis, and trial design. The rise of DCTs enhances patient accessibility and participation. These innovations improve trial efficiency, reduce costs, and accelerate drug development timelines, giving companies a competitive edge.
Challenges in the Clinical Trial Industry Market
The clinical trial industry faces several challenges, including high regulatory hurdles, increasing operational complexities, and stringent compliance requirements. Supply chain disruptions can affect timelines and budgets. Intense competition and pricing pressures also pose significant hurdles. The average cost for running a phase III clinical trial is approximately $XX Million.
Forces Driving Clinical Trial Industry Growth
Technological advancements, such as AI-powered analytics and decentralized clinical trials (DCTs), are significantly accelerating the pace of drug development. Increased government funding for research and development across many countries is providing a major impetus for growth. Furthermore, the rise of personalized medicine is driving a substantial expansion in the clinical trials sector.
Challenges in the Clinical Trial Industry Market
Long-term growth requires overcoming persistent regulatory hurdles, streamlining operational complexities, and reducing development timelines through innovative technologies. Strategic partnerships and global market expansions will play a pivotal role in enhancing resilience and driving sustainable growth.
Emerging Opportunities in Clinical Trial Industry
Emerging opportunities lie in the expansion of DCTs, the application of AI and machine learning for improved trial design and efficiency, and the growth of personalized medicine. The application of blockchain technology for secure data management also holds considerable potential. New markets in emerging economies present further opportunities for growth.
Leading Players in the Clinical Trial Industry Sector
- Sanofi SA
- Novo Nordisk AS
- PAREXEL International Corporation
- Pharmaceutical Product Development LLC
- F Hoffmann-La Roche Ltd
- Syneos Health
- ICON PLC
- Eli Lilly and Company
- ClinDatrix Inc
- Charles River Laboratory
- Clinipace
- IQVIA
- Laboratory Corporation of America
- Pfizer Inc
Key Milestones in Clinical Trial Industry Industry
- July 2022: NIAID initiates an early-stage clinical trial for a Nipah virus vaccine, highlighting a focus on emerging infectious diseases.
- May 2022: IAVI and Moderna launch a Phase I clinical trial for an mRNA vaccine antigen in Africa, demonstrating advancements in vaccine technology and global collaboration.
Strategic Outlook for Clinical Trial Industry Market
The clinical trial industry is poised for sustained growth driven by technological advancements, increased R&D investments, and a growing need for effective therapies. Strategic partnerships, expansion into new markets, and embracing innovative technologies will be key to realizing the significant growth potential of this dynamic sector.
Clinical Trial Industry Segmentation
-
1. Phase
- 1.1. Phase I
- 1.2. Phase II
- 1.3. Phase III
- 1.4. Phase IV
-
2. Design
-
2.1. Treatment Studies
- 2.1.1. Randomized Control Trial
- 2.1.2. Adaptive Clinical Trial
- 2.1.3. Non-randomized Control Trial
-
2.2. Observational Studies
- 2.2.1. Cohort Study
- 2.2.2. Case Control Study
- 2.2.3. Cross Sectional Study
- 2.2.4. Ecological Study
-
2.1. Treatment Studies
Clinical Trial Industry Segmentation By Geography
-
1. North America
- 1.1. United States
- 1.2. Canada
- 1.3. Mexico
-
2. Europe
- 2.1. Germany
- 2.2. United Kingdom
- 2.3. France
- 2.4. Italy
- 2.5. Spain
- 2.6. Rest of Europe
-
3. Asia Pacific
- 3.1. China
- 3.2. Japan
- 3.3. India
- 3.4. Australia
- 3.5. South Korea
- 3.6. Rest of Asia Pacific
-
4. Middle East and Africa
- 4.1. GCC
- 4.2. South Africa
- 4.3. Rest of Middle East and Africa
-
5. South America
- 5.1. Brazil
- 5.2. Argentina
- 5.3. Rest of South America
Clinical Trial Industry Regional Market Share
Geographic Coverage of Clinical Trial Industry
Clinical Trial Industry REPORT HIGHLIGHTS
| Aspects | Details |
|---|---|
| Study Period | 2020-2034 |
| Base Year | 2025 |
| Estimated Year | 2026 |
| Forecast Period | 2026-2034 |
| Historical Period | 2020-2025 |
| Growth Rate | CAGR of 5.91% from 2020-2034 |
| Segmentation |
|
Table of Contents
- 1. Introduction
- 1.1. Research Scope
- 1.2. Market Segmentation
- 1.3. Research Objective
- 1.4. Definitions and Assumptions
- 2. Executive Summary
- 2.1. Market Snapshot
- 3. Market Dynamics
- 3.1. Market Drivers
- 3.2. Market Restrains
- 3.3. Market Trends
- 3.4. Market Opportunities
- 4. Market Factor Analysis
- 4.1. Porters Five Forces
- 4.1.1. Bargaining Power of Suppliers
- 4.1.2. Bargaining Power of Buyers
- 4.1.3. Threat of New Entrants
- 4.1.4. Threat of Substitutes
- 4.1.5. Competitive Rivalry
- 4.2. PESTEL analysis
- 4.3. BCG Analysis
- 4.3.1. Stars (High Growth, High Market Share)
- 4.3.2. Cash Cows (Low Growth, High Market Share)
- 4.3.3. Question Mark (High Growth, Low Market Share)
- 4.3.4. Dogs (Low Growth, Low Market Share)
- 4.4. Ansoff Matrix Analysis
- 4.5. Supply Chain Analysis
- 4.6. Regulatory Landscape
- 4.7. Current Market Potential and Opportunity Assessment (TAM–SAM–SOM Framework)
- 4.8. MSR Analyst Note
- 4.1. Porters Five Forces
- 5. Market Analysis, Insights and Forecast 2021-2033
- 5.1. Market Analysis, Insights and Forecast - by Phase
- 5.1.1. Phase I
- 5.1.2. Phase II
- 5.1.3. Phase III
- 5.1.4. Phase IV
- 5.2. Market Analysis, Insights and Forecast - by Design
- 5.2.1. Treatment Studies
- 5.2.1.1. Randomized Control Trial
- 5.2.1.2. Adaptive Clinical Trial
- 5.2.1.3. Non-randomized Control Trial
- 5.2.2. Observational Studies
- 5.2.2.1. Cohort Study
- 5.2.2.2. Case Control Study
- 5.2.2.3. Cross Sectional Study
- 5.2.2.4. Ecological Study
- 5.2.1. Treatment Studies
- 5.3. Market Analysis, Insights and Forecast - by Region
- 5.3.1. North America
- 5.3.2. Europe
- 5.3.3. Asia Pacific
- 5.3.4. Middle East and Africa
- 5.3.5. South America
- 5.1. Market Analysis, Insights and Forecast - by Phase
- 6. Global Clinical Trial Industry Analysis, Insights and Forecast, 2021-2033
- 6.1. Market Analysis, Insights and Forecast - by Phase
- 6.1.1. Phase I
- 6.1.2. Phase II
- 6.1.3. Phase III
- 6.1.4. Phase IV
- 6.2. Market Analysis, Insights and Forecast - by Design
- 6.2.1. Treatment Studies
- 6.2.1.1. Randomized Control Trial
- 6.2.1.2. Adaptive Clinical Trial
- 6.2.1.3. Non-randomized Control Trial
- 6.2.2. Observational Studies
- 6.2.2.1. Cohort Study
- 6.2.2.2. Case Control Study
- 6.2.2.3. Cross Sectional Study
- 6.2.2.4. Ecological Study
- 6.2.1. Treatment Studies
- 6.1. Market Analysis, Insights and Forecast - by Phase
- 7. North America Clinical Trial Industry Analysis, Insights and Forecast, 2020-2032
- 7.1. Market Analysis, Insights and Forecast - by Phase
- 7.1.1. Phase I
- 7.1.2. Phase II
- 7.1.3. Phase III
- 7.1.4. Phase IV
- 7.2. Market Analysis, Insights and Forecast - by Design
- 7.2.1. Treatment Studies
- 7.2.1.1. Randomized Control Trial
- 7.2.1.2. Adaptive Clinical Trial
- 7.2.1.3. Non-randomized Control Trial
- 7.2.2. Observational Studies
- 7.2.2.1. Cohort Study
- 7.2.2.2. Case Control Study
- 7.2.2.3. Cross Sectional Study
- 7.2.2.4. Ecological Study
- 7.2.1. Treatment Studies
- 7.1. Market Analysis, Insights and Forecast - by Phase
- 8. Europe Clinical Trial Industry Analysis, Insights and Forecast, 2020-2032
- 8.1. Market Analysis, Insights and Forecast - by Phase
- 8.1.1. Phase I
- 8.1.2. Phase II
- 8.1.3. Phase III
- 8.1.4. Phase IV
- 8.2. Market Analysis, Insights and Forecast - by Design
- 8.2.1. Treatment Studies
- 8.2.1.1. Randomized Control Trial
- 8.2.1.2. Adaptive Clinical Trial
- 8.2.1.3. Non-randomized Control Trial
- 8.2.2. Observational Studies
- 8.2.2.1. Cohort Study
- 8.2.2.2. Case Control Study
- 8.2.2.3. Cross Sectional Study
- 8.2.2.4. Ecological Study
- 8.2.1. Treatment Studies
- 8.1. Market Analysis, Insights and Forecast - by Phase
- 9. Asia Pacific Clinical Trial Industry Analysis, Insights and Forecast, 2020-2032
- 9.1. Market Analysis, Insights and Forecast - by Phase
- 9.1.1. Phase I
- 9.1.2. Phase II
- 9.1.3. Phase III
- 9.1.4. Phase IV
- 9.2. Market Analysis, Insights and Forecast - by Design
- 9.2.1. Treatment Studies
- 9.2.1.1. Randomized Control Trial
- 9.2.1.2. Adaptive Clinical Trial
- 9.2.1.3. Non-randomized Control Trial
- 9.2.2. Observational Studies
- 9.2.2.1. Cohort Study
- 9.2.2.2. Case Control Study
- 9.2.2.3. Cross Sectional Study
- 9.2.2.4. Ecological Study
- 9.2.1. Treatment Studies
- 9.1. Market Analysis, Insights and Forecast - by Phase
- 10. Middle East and Africa Clinical Trial Industry Analysis, Insights and Forecast, 2020-2032
- 10.1. Market Analysis, Insights and Forecast - by Phase
- 10.1.1. Phase I
- 10.1.2. Phase II
- 10.1.3. Phase III
- 10.1.4. Phase IV
- 10.2. Market Analysis, Insights and Forecast - by Design
- 10.2.1. Treatment Studies
- 10.2.1.1. Randomized Control Trial
- 10.2.1.2. Adaptive Clinical Trial
- 10.2.1.3. Non-randomized Control Trial
- 10.2.2. Observational Studies
- 10.2.2.1. Cohort Study
- 10.2.2.2. Case Control Study
- 10.2.2.3. Cross Sectional Study
- 10.2.2.4. Ecological Study
- 10.2.1. Treatment Studies
- 10.1. Market Analysis, Insights and Forecast - by Phase
- 11. South America Clinical Trial Industry Analysis, Insights and Forecast, 2020-2032
- 11.1. Market Analysis, Insights and Forecast - by Phase
- 11.1.1. Phase I
- 11.1.2. Phase II
- 11.1.3. Phase III
- 11.1.4. Phase IV
- 11.2. Market Analysis, Insights and Forecast - by Design
- 11.2.1. Treatment Studies
- 11.2.1.1. Randomized Control Trial
- 11.2.1.2. Adaptive Clinical Trial
- 11.2.1.3. Non-randomized Control Trial
- 11.2.2. Observational Studies
- 11.2.2.1. Cohort Study
- 11.2.2.2. Case Control Study
- 11.2.2.3. Cross Sectional Study
- 11.2.2.4. Ecological Study
- 11.2.1. Treatment Studies
- 11.1. Market Analysis, Insights and Forecast - by Phase
- 12. Competitive Analysis
- 12.1. Company Profiles
- 12.1.1 Sanofi SA
- 12.1.1.1. Company Overview
- 12.1.1.2. Products
- 12.1.1.3. Company Financials
- 12.1.1.4. SWOT Analysis
- 12.1.2 Novo Nordisk AS
- 12.1.2.1. Company Overview
- 12.1.2.2. Products
- 12.1.2.3. Company Financials
- 12.1.2.4. SWOT Analysis
- 12.1.3 PAREXEL International Corporation
- 12.1.3.1. Company Overview
- 12.1.3.2. Products
- 12.1.3.3. Company Financials
- 12.1.3.4. SWOT Analysis
- 12.1.4 Pharmaceutical Product Development LLC
- 12.1.4.1. Company Overview
- 12.1.4.2. Products
- 12.1.4.3. Company Financials
- 12.1.4.4. SWOT Analysis
- 12.1.5 F Hoffmann-La Roche Ltd
- 12.1.5.1. Company Overview
- 12.1.5.2. Products
- 12.1.5.3. Company Financials
- 12.1.5.4. SWOT Analysis
- 12.1.6 Syneos Health
- 12.1.6.1. Company Overview
- 12.1.6.2. Products
- 12.1.6.3. Company Financials
- 12.1.6.4. SWOT Analysis
- 12.1.7 ICON PLC
- 12.1.7.1. Company Overview
- 12.1.7.2. Products
- 12.1.7.3. Company Financials
- 12.1.7.4. SWOT Analysis
- 12.1.8 Eli Lilly and Company
- 12.1.8.1. Company Overview
- 12.1.8.2. Products
- 12.1.8.3. Company Financials
- 12.1.8.4. SWOT Analysis
- 12.1.9 ClinDatrix Inc
- 12.1.9.1. Company Overview
- 12.1.9.2. Products
- 12.1.9.3. Company Financials
- 12.1.9.4. SWOT Analysis
- 12.1.10 Charles River Laboratory
- 12.1.10.1. Company Overview
- 12.1.10.2. Products
- 12.1.10.3. Company Financials
- 12.1.10.4. SWOT Analysis
- 12.1.11 Clinipace
- 12.1.11.1. Company Overview
- 12.1.11.2. Products
- 12.1.11.3. Company Financials
- 12.1.11.4. SWOT Analysis
- 12.1.12 IQVIA
- 12.1.12.1. Company Overview
- 12.1.12.2. Products
- 12.1.12.3. Company Financials
- 12.1.12.4. SWOT Analysis
- 12.1.13 Laboratory Corporation of America
- 12.1.13.1. Company Overview
- 12.1.13.2. Products
- 12.1.13.3. Company Financials
- 12.1.13.4. SWOT Analysis
- 12.1.14 Pfizer Inc
- 12.1.14.1. Company Overview
- 12.1.14.2. Products
- 12.1.14.3. Company Financials
- 12.1.14.4. SWOT Analysis
- 12.1.1 Sanofi SA
- 12.2. Market Entropy
- 12.2.1 Company's Key Areas Served
- 12.2.2 Recent Developments
- 12.3. Company Market Share Analysis 2025
- 12.3.1 Top 5 Companies Market Share Analysis
- 12.3.2 Top 3 Companies Market Share Analysis
- 12.4. List of Potential Customers
- 13. Research Methodology
List of Figures
- Figure 1: Global Clinical Trial Industry Revenue Breakdown (Million, %) by Region 2025 & 2033
- Figure 2: North America Clinical Trial Industry Revenue (Million), by Phase 2025 & 2033
- Figure 3: North America Clinical Trial Industry Revenue Share (%), by Phase 2025 & 2033
- Figure 4: North America Clinical Trial Industry Revenue (Million), by Design 2025 & 2033
- Figure 5: North America Clinical Trial Industry Revenue Share (%), by Design 2025 & 2033
- Figure 6: North America Clinical Trial Industry Revenue (Million), by Country 2025 & 2033
- Figure 7: North America Clinical Trial Industry Revenue Share (%), by Country 2025 & 2033
- Figure 8: Europe Clinical Trial Industry Revenue (Million), by Phase 2025 & 2033
- Figure 9: Europe Clinical Trial Industry Revenue Share (%), by Phase 2025 & 2033
- Figure 10: Europe Clinical Trial Industry Revenue (Million), by Design 2025 & 2033
- Figure 11: Europe Clinical Trial Industry Revenue Share (%), by Design 2025 & 2033
- Figure 12: Europe Clinical Trial Industry Revenue (Million), by Country 2025 & 2033
- Figure 13: Europe Clinical Trial Industry Revenue Share (%), by Country 2025 & 2033
- Figure 14: Asia Pacific Clinical Trial Industry Revenue (Million), by Phase 2025 & 2033
- Figure 15: Asia Pacific Clinical Trial Industry Revenue Share (%), by Phase 2025 & 2033
- Figure 16: Asia Pacific Clinical Trial Industry Revenue (Million), by Design 2025 & 2033
- Figure 17: Asia Pacific Clinical Trial Industry Revenue Share (%), by Design 2025 & 2033
- Figure 18: Asia Pacific Clinical Trial Industry Revenue (Million), by Country 2025 & 2033
- Figure 19: Asia Pacific Clinical Trial Industry Revenue Share (%), by Country 2025 & 2033
- Figure 20: Middle East and Africa Clinical Trial Industry Revenue (Million), by Phase 2025 & 2033
- Figure 21: Middle East and Africa Clinical Trial Industry Revenue Share (%), by Phase 2025 & 2033
- Figure 22: Middle East and Africa Clinical Trial Industry Revenue (Million), by Design 2025 & 2033
- Figure 23: Middle East and Africa Clinical Trial Industry Revenue Share (%), by Design 2025 & 2033
- Figure 24: Middle East and Africa Clinical Trial Industry Revenue (Million), by Country 2025 & 2033
- Figure 25: Middle East and Africa Clinical Trial Industry Revenue Share (%), by Country 2025 & 2033
- Figure 26: South America Clinical Trial Industry Revenue (Million), by Phase 2025 & 2033
- Figure 27: South America Clinical Trial Industry Revenue Share (%), by Phase 2025 & 2033
- Figure 28: South America Clinical Trial Industry Revenue (Million), by Design 2025 & 2033
- Figure 29: South America Clinical Trial Industry Revenue Share (%), by Design 2025 & 2033
- Figure 30: South America Clinical Trial Industry Revenue (Million), by Country 2025 & 2033
- Figure 31: South America Clinical Trial Industry Revenue Share (%), by Country 2025 & 2033
List of Tables
- Table 1: Global Clinical Trial Industry Revenue Million Forecast, by Phase 2020 & 2033
- Table 2: Global Clinical Trial Industry Revenue Million Forecast, by Design 2020 & 2033
- Table 3: Global Clinical Trial Industry Revenue Million Forecast, by Region 2020 & 2033
- Table 4: Global Clinical Trial Industry Revenue Million Forecast, by Phase 2020 & 2033
- Table 5: Global Clinical Trial Industry Revenue Million Forecast, by Design 2020 & 2033
- Table 6: Global Clinical Trial Industry Revenue Million Forecast, by Country 2020 & 2033
- Table 7: United States Clinical Trial Industry Revenue (Million) Forecast, by Application 2020 & 2033
- Table 8: Canada Clinical Trial Industry Revenue (Million) Forecast, by Application 2020 & 2033
- Table 9: Mexico Clinical Trial Industry Revenue (Million) Forecast, by Application 2020 & 2033
- Table 10: Global Clinical Trial Industry Revenue Million Forecast, by Phase 2020 & 2033
- Table 11: Global Clinical Trial Industry Revenue Million Forecast, by Design 2020 & 2033
- Table 12: Global Clinical Trial Industry Revenue Million Forecast, by Country 2020 & 2033
- Table 13: Germany Clinical Trial Industry Revenue (Million) Forecast, by Application 2020 & 2033
- Table 14: United Kingdom Clinical Trial Industry Revenue (Million) Forecast, by Application 2020 & 2033
- Table 15: France Clinical Trial Industry Revenue (Million) Forecast, by Application 2020 & 2033
- Table 16: Italy Clinical Trial Industry Revenue (Million) Forecast, by Application 2020 & 2033
- Table 17: Spain Clinical Trial Industry Revenue (Million) Forecast, by Application 2020 & 2033
- Table 18: Rest of Europe Clinical Trial Industry Revenue (Million) Forecast, by Application 2020 & 2033
- Table 19: Global Clinical Trial Industry Revenue Million Forecast, by Phase 2020 & 2033
- Table 20: Global Clinical Trial Industry Revenue Million Forecast, by Design 2020 & 2033
- Table 21: Global Clinical Trial Industry Revenue Million Forecast, by Country 2020 & 2033
- Table 22: China Clinical Trial Industry Revenue (Million) Forecast, by Application 2020 & 2033
- Table 23: Japan Clinical Trial Industry Revenue (Million) Forecast, by Application 2020 & 2033
- Table 24: India Clinical Trial Industry Revenue (Million) Forecast, by Application 2020 & 2033
- Table 25: Australia Clinical Trial Industry Revenue (Million) Forecast, by Application 2020 & 2033
- Table 26: South Korea Clinical Trial Industry Revenue (Million) Forecast, by Application 2020 & 2033
- Table 27: Rest of Asia Pacific Clinical Trial Industry Revenue (Million) Forecast, by Application 2020 & 2033
- Table 28: Global Clinical Trial Industry Revenue Million Forecast, by Phase 2020 & 2033
- Table 29: Global Clinical Trial Industry Revenue Million Forecast, by Design 2020 & 2033
- Table 30: Global Clinical Trial Industry Revenue Million Forecast, by Country 2020 & 2033
- Table 31: GCC Clinical Trial Industry Revenue (Million) Forecast, by Application 2020 & 2033
- Table 32: South Africa Clinical Trial Industry Revenue (Million) Forecast, by Application 2020 & 2033
- Table 33: Rest of Middle East and Africa Clinical Trial Industry Revenue (Million) Forecast, by Application 2020 & 2033
- Table 34: Global Clinical Trial Industry Revenue Million Forecast, by Phase 2020 & 2033
- Table 35: Global Clinical Trial Industry Revenue Million Forecast, by Design 2020 & 2033
- Table 36: Global Clinical Trial Industry Revenue Million Forecast, by Country 2020 & 2033
- Table 37: Brazil Clinical Trial Industry Revenue (Million) Forecast, by Application 2020 & 2033
- Table 38: Argentina Clinical Trial Industry Revenue (Million) Forecast, by Application 2020 & 2033
- Table 39: Rest of South America Clinical Trial Industry Revenue (Million) Forecast, by Application 2020 & 2033
Frequently Asked Questions
1. What is the projected Compound Annual Growth Rate (CAGR) of the Clinical Trial Industry?
The projected CAGR is approximately 5.91%.
2. Which companies are prominent players in the Clinical Trial Industry?
Key companies in the market include Sanofi SA, Novo Nordisk AS, PAREXEL International Corporation, Pharmaceutical Product Development LLC, F Hoffmann-La Roche Ltd, Syneos Health, ICON PLC, Eli Lilly and Company, ClinDatrix Inc, Charles River Laboratory, Clinipace, IQVIA, Laboratory Corporation of America, Pfizer Inc.
3. What are the main segments of the Clinical Trial Industry?
The market segments include Phase, Design.
4. Can you provide details about the market size?
The market size is estimated to be USD 50.66 Million as of 2022.
5. What are some drivers contributing to market growth?
Demand for Clinical Trials in the Emerging Markets; High R&D Expenditure of the Pharmaceutical Industry; Rising Prevalence of Diseases.
6. What are the notable trends driving market growth?
Phase III by Phase Segment is Expected to Grow Over the Forecast Period.
7. Are there any restraints impacting market growth?
Lack of Skilled Workforce in Clinical Research; Stringent Regulations for Patient Enrollment.
8. Can you provide examples of recent developments in the market?
July 2022: An early-stage clinical trial investigating an investigational vaccine to stave off Nipah virus infection was started by the National Institute of Allergy and Infectious Diseases (NIAID), a division of the National Institutes of Health (NIH) of the United States.
9. What pricing options are available for accessing the report?
Pricing options include single-user, multi-user, and enterprise licenses priced at USD 4750, USD 5250, and USD 8750 respectively.
10. Is the market size provided in terms of value or volume?
The market size is provided in terms of value, measured in Million.
11. Are there any specific market keywords associated with the report?
Yes, the market keyword associated with the report is "Clinical Trial Industry," which aids in identifying and referencing the specific market segment covered.
12. How do I determine which pricing option suits my needs best?
The pricing options vary based on user requirements and access needs. Individual users may opt for single-user licenses, while businesses requiring broader access may choose multi-user or enterprise licenses for cost-effective access to the report.
13. Are there any additional resources or data provided in the Clinical Trial Industry report?
While the report offers comprehensive insights, it's advisable to review the specific contents or supplementary materials provided to ascertain if additional resources or data are available.
14. How can I stay updated on further developments or reports in the Clinical Trial Industry?
To stay informed about further developments, trends, and reports in the Clinical Trial Industry, consider subscribing to industry newsletters, following relevant companies and organizations, or regularly checking reputable industry news sources and publications.
Methodology
Step 1 - Identification of Relevant Samples Size from Population Database


Step 2 - Approaches for Defining Global Market Size (Value, Volume* & Price*)

Note*: In applicable scenarios
Step 3 - Data Sources
Primary Research
- Web Analytics
- Survey Reports
- Research Institute
- Latest Research Reports
- Opinion Leaders
Secondary Research
- Annual Reports
- White Paper
- Latest Press Release
- Industry Association
- Paid Database
- Investor Presentations

Step 4 - Data Triangulation
Involves using different sources of information in order to increase the validity of a study
These sources are likely to be stakeholders in a program - participants, other researchers, program staff, other community members, and so on.
Then we put all data in single framework & apply various statistical tools to find out the dynamic on the market.
During the analysis stage, feedback from the stakeholder groups would be compared to determine areas of agreement as well as areas of divergence