

Key Insights
The Niobium Pentoxide market, valued at approximately $XX million in 2025, is projected to experience robust growth, exhibiting a compound annual growth rate (CAGR) of 10.09% from 2025 to 2033. This expansion is driven by the increasing demand for niobium pentoxide in diverse high-tech applications. The burgeoning supercapacitor industry, fueled by the growing adoption of electric vehicles and renewable energy storage solutions, significantly contributes to market growth. Similarly, the expanding optical glass and superalloy sectors are key drivers, demanding high-purity niobium pentoxide for enhanced performance characteristics. The market is segmented by grade (industrial grade encompassing 3N and 4N purities) and application (niobium metal, optical glass, supercapacitors, superalloys, ceramics, and other applications). The Asia-Pacific region, particularly China and India, is expected to dominate the market due to their rapid industrialization and growing technological advancements. However, price fluctuations in raw materials and potential supply chain disruptions pose challenges to market growth.
While the industrial grade segment currently holds a larger market share, the demand for higher-purity niobium pentoxide (4N and above) is anticipated to increase substantially in the coming years, driven by the stringent requirements of advanced applications like high-performance electronics and specialized optics. Competition among major players like Solikamsk Magnesium Plant OJSC, Taki Chemical Co Ltd, MPIL, AMG, and others is intense, focusing on product innovation, technological advancements, and strategic partnerships to secure market share. The North American and European markets, while mature, are expected to maintain steady growth, driven by continuous technological upgrades and adoption of niobium pentoxide in niche applications. Future growth will hinge on further technological advancements, particularly in improving production efficiency and reducing the environmental impact of niobium pentoxide extraction and processing.

Niobium Pentoxide Market Report: A Comprehensive Analysis (2019-2033)
This comprehensive report provides an in-depth analysis of the Niobium Pentoxide market, offering valuable insights for industry stakeholders, investors, and strategic decision-makers. Covering the period from 2019 to 2033, with a base year of 2025, this study unveils the market's dynamics, trends, and future growth potential. The report meticulously examines market size, CAGR, key segments (by grade and application), leading players, and emerging opportunities, providing actionable intelligence for navigating this evolving landscape.
Niobium Pentoxide Market Concentration & Dynamics
The global Niobium Pentoxide market exhibits a moderately concentrated structure, with a handful of major players holding significant market share. Market concentration is influenced by factors such as economies of scale in production, access to raw materials, and technological advancements. The innovation ecosystem is characterized by ongoing R&D efforts focused on enhancing product purity, exploring new applications, and improving production efficiency. Regulatory frameworks, while generally supportive of responsible mining and environmental protection, vary across different regions, impacting production costs and market access. Substitute products, while limited, present some competitive pressure, particularly from alternative materials in specific niche applications. End-user trends are driving demand, particularly in the growing electronics and energy sectors. M&A activities have been relatively modest in recent years but are expected to increase as companies seek to consolidate their market positions and access new technologies. The report includes a detailed analysis of market share distribution among major players and a quantitative assessment of recent M&A activity (xx deals in the last 5 years).
Niobium Pentoxide Market Industry Insights & Trends
The Niobium Pentoxide market is experiencing robust growth, driven primarily by increasing demand from various industries, including electronics, aerospace, and energy. The market size is estimated to reach USD xx Million in 2025, with a projected CAGR of xx% during the forecast period (2025-2033). Several factors contribute to this growth: the expanding electronics sector, particularly in supercapacitors and other energy storage devices; the growing adoption of niobium alloys in aerospace applications; and the increasing demand for high-purity niobium pentoxide in advanced optical technologies. Technological advancements in production processes are leading to increased efficiency and lower costs, making niobium pentoxide more accessible to a wider range of applications. Evolving consumer behaviors, particularly a growing preference for sustainable and high-performance products, further bolster market growth.

Key Markets & Segments Leading Niobium Pentoxide Market
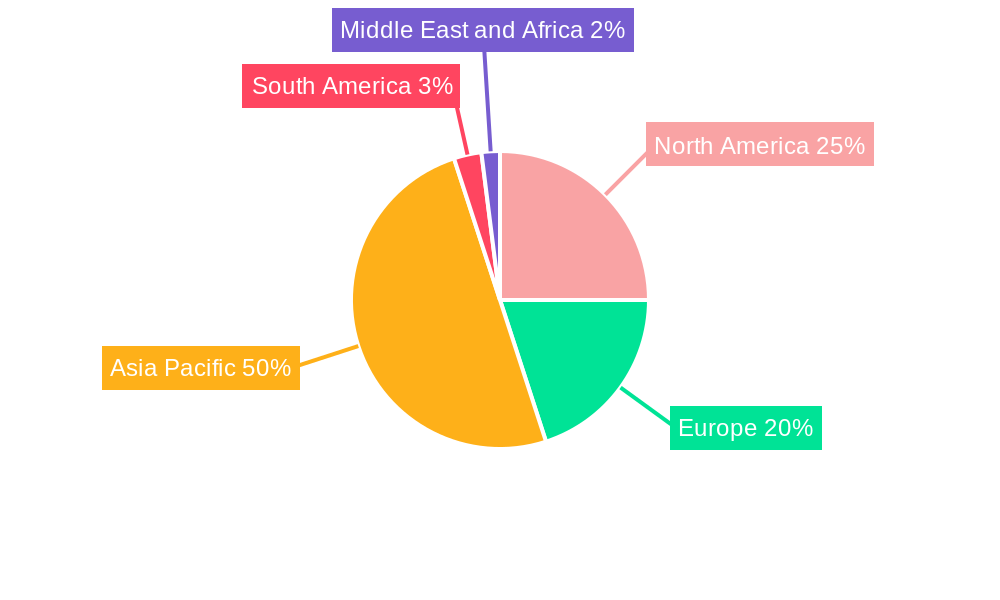
The Asia-Pacific region currently holds the dominant position in the global Niobium Pentoxide market, driven by rapid industrialization, economic growth, and substantial infrastructure development. Within the market segments:
- By Grade: High-purity grades (4N and above) command premium prices and are experiencing faster growth due to demand from sophisticated applications. The industrial grade segment (3N) continues to hold a significant market share, particularly in traditional applications.
- By Application: The superalloys segment is the largest application area, driven by the aerospace and energy industries. The burgeoning electric vehicle market is driving increased demand for niobium pentoxide in supercapacitors and lithium-ion batteries. Other applications, including optical glass and ceramics, contribute significantly to overall market growth.
Drivers for Market Dominance:
- Strong economic growth across the region
- Rapid industrialization and urbanization
- Increased infrastructure spending
- Growing adoption of advanced technologies
- Favorable government policies promoting industrial development.
Niobium Pentoxide Market Product Developments
Recent product innovations focus on enhancing purity levels, improving particle size distribution, and developing new formulations tailored to specific applications. This includes the development of advanced production techniques, leading to superior product quality and consistency. These advancements provide a significant competitive edge in this market and drive demand.
Challenges in the Niobium Pentoxide Market Market
Challenges include the relatively high production costs and limited supply of high-purity niobium pentoxide. Price volatility and fluctuating supply chain dynamics pose significant challenges. Furthermore, increasing regulatory scrutiny on mining activities and environmental concerns related to niobium extraction add to production costs and operational complexity. This translates to price volatility and production challenges. These issues impact market growth and the overall competitive landscape.
Forces Driving Niobium Pentoxide Market Growth
Technological advancements in processing and applications are primary growth catalysts. The rising demand for high-performance materials in various industries, coupled with supportive government policies in key markets, is fostering rapid market expansion. Growing environmental awareness also fuels demand for eco-friendly materials, presenting opportunities for niobium pentoxide in sustainable applications. The global push toward decarbonization also boosts the market.
Long-Term Growth Catalysts in the Niobium Pentoxide Market
Long-term growth hinges on continued innovation, strategic partnerships, and market expansions. The development of new applications, especially in emerging technologies like renewable energy and advanced electronics, will fuel long-term demand. Collaborations between producers and end-users to improve material properties and explore new uses are crucial. Expanding into new markets, particularly in developing economies, also presents significant growth potential.
Emerging Opportunities in Niobium Pentoxide Market
Emerging opportunities are abundant in specialized applications, including advanced electronics, aerospace composites, and biomedical devices. The rising demand for sustainable materials and the development of new technologies like solid-state batteries present exciting prospects. Growing adoption in the green energy sector, along with advancements in 3D printing, further expands the market's potential.
Leading Players in the Niobium Pentoxide Market Sector
- Solikamsk Magnesium Plant OJSC
- Taki Chemical Co Ltd
- MPIL
- AMG
- Mitsui Mining & Smelting Co Ltd
- JX Nippon Mining & Metals Corporation
- F&X Electro-Materials Limited
- King-Tan Tantalum Industry Ltd
- XIMEI Resources Holding Limited
- CBMM
Key Milestones in Niobium Pentoxide Market Industry
- December 2022: CBMM announced an USD 80 Million investment to expand niobium oxide capacity from 500 tons to 3,000 tons by 2024, indicating significant growth plans and influencing market supply. This expansion demonstrates a strong commitment to meet the increasing demand. Their collaboration with Echion Technologies for a new niobium oxide facility underscores strategic partnerships and technological advancements. The broader goal of reaching 40,000 tons by 2030 showcases ambitious long-term market projections.
- March 2022: CBMM's partnership with Horwin Brasil to incorporate niobium into electric motorcycle batteries highlights the material's growing role in the electric vehicle market and signals a significant move into the burgeoning clean energy sector. This BRL 70 million (USD 13.8 Million) investment and projected sales of 500 tons of niobium oxide in 2022, with a target of 50,000 tons by 2030, demonstrate confidence in market growth and future demand.
Strategic Outlook for Niobium Pentoxide Market Market
The Niobium Pentoxide market is poised for significant growth, driven by robust demand from diverse sectors and technological innovations. Strategic opportunities include focusing on high-purity products, expanding into emerging applications, and forging strategic partnerships to secure raw materials and enhance market access. Companies adopting sustainable production practices and investing in R&D will be well-positioned to capture significant market share in the years to come.
Niobium Pentoxide Market Segmentation
-
1. Grade
- 1.1. Industrial Grade (purity: 99.0% to 99.8%)
- 1.2. 3N
- 1.3. 4N
-
2. Application
- 2.1. Niobium Metal
- 2.2. Optical Glass
- 2.3. Supercapacitors
- 2.4. Superalloys
- 2.5. Ceramics
- 2.6. Other Applications
Niobium Pentoxide Market Segmentation By Geography
-
1. Asia Pacific
- 1.1. China
- 1.2. India
- 1.3. Japan
- 1.4. South Korea
- 1.5. Rest of Asia Pacific
-
2. North America
- 2.1. United States
- 2.2. Canada
- 2.3. Mexico
-
3. Europe
- 3.1. Germany
- 3.2. United Kingdom
- 3.3. France
- 3.4. Italy
- 3.5. Rest of Europe
-
4. South America
- 4.1. Brazil
- 4.2. Argentina
- 4.3. Rest of South America
-
5. Middle East and Africa
- 5.1. Saudi Arabia
- 5.2. South Africa
- 5.3. Rest of Middle East and Africa
Niobium Pentoxide Market REPORT HIGHLIGHTS
| Aspects | Details |
|---|---|
| Study Period | 2019-2033 |
| Base Year | 2024 |
| Estimated Year | 2025 |
| Forecast Period | 2025-2033 |
| Historical Period | 2019-2024 |
| Growth Rate | CAGR of 10.09% from 2019-2033 |
| Segmentation |
|
Table of Contents
- 1. Introduction
- 1.1. Research Scope
- 1.2. Market Segmentation
- 1.3. Research Methodology
- 1.4. Definitions and Assumptions
- 2. Executive Summary
- 2.1. Introduction
- 3. Market Dynamics
- 3.1. Introduction
- 3.2. Market Drivers
- 3.2.1. Growing Demand from the Electric Vehicles Segment; Growing Demand for High-Quality Steel from the Manufacturing Sector
- 3.3. Market Restrains
- 3.3.1. Concerns About Health Issues on Acute Exposure
- 3.4. Market Trends
- 3.4.1. Increasing Usage in the Production of Niobium Metal
- 4. Market Factor Analysis
- 4.1. Porters Five Forces
- 4.2. Supply/Value Chain
- 4.3. PESTEL analysis
- 4.4. Market Entropy
- 4.5. Patent/Trademark Analysis
- 5. Global Niobium Pentoxide Market Analysis, Insights and Forecast, 2019-2031
- 5.1. Market Analysis, Insights and Forecast - by Grade
- 5.1.1. Industrial Grade (purity: 99.0% to 99.8%)
- 5.1.2. 3N
- 5.1.3. 4N
- 5.2. Market Analysis, Insights and Forecast - by Application
- 5.2.1. Niobium Metal
- 5.2.2. Optical Glass
- 5.2.3. Supercapacitors
- 5.2.4. Superalloys
- 5.2.5. Ceramics
- 5.2.6. Other Applications
- 5.3. Market Analysis, Insights and Forecast - by Region
- 5.3.1. Asia Pacific
- 5.3.2. North America
- 5.3.3. Europe
- 5.3.4. South America
- 5.3.5. Middle East and Africa
- 5.1. Market Analysis, Insights and Forecast - by Grade
- 6. Asia Pacific Niobium Pentoxide Market Analysis, Insights and Forecast, 2019-2031
- 6.1. Market Analysis, Insights and Forecast - by Grade
- 6.1.1. Industrial Grade (purity: 99.0% to 99.8%)
- 6.1.2. 3N
- 6.1.3. 4N
- 6.2. Market Analysis, Insights and Forecast - by Application
- 6.2.1. Niobium Metal
- 6.2.2. Optical Glass
- 6.2.3. Supercapacitors
- 6.2.4. Superalloys
- 6.2.5. Ceramics
- 6.2.6. Other Applications
- 6.1. Market Analysis, Insights and Forecast - by Grade
- 7. North America Niobium Pentoxide Market Analysis, Insights and Forecast, 2019-2031
- 7.1. Market Analysis, Insights and Forecast - by Grade
- 7.1.1. Industrial Grade (purity: 99.0% to 99.8%)
- 7.1.2. 3N
- 7.1.3. 4N
- 7.2. Market Analysis, Insights and Forecast - by Application
- 7.2.1. Niobium Metal
- 7.2.2. Optical Glass
- 7.2.3. Supercapacitors
- 7.2.4. Superalloys
- 7.2.5. Ceramics
- 7.2.6. Other Applications
- 7.1. Market Analysis, Insights and Forecast - by Grade
- 8. Europe Niobium Pentoxide Market Analysis, Insights and Forecast, 2019-2031
- 8.1. Market Analysis, Insights and Forecast - by Grade
- 8.1.1. Industrial Grade (purity: 99.0% to 99.8%)
- 8.1.2. 3N
- 8.1.3. 4N
- 8.2. Market Analysis, Insights and Forecast - by Application
- 8.2.1. Niobium Metal
- 8.2.2. Optical Glass
- 8.2.3. Supercapacitors
- 8.2.4. Superalloys
- 8.2.5. Ceramics
- 8.2.6. Other Applications
- 8.1. Market Analysis, Insights and Forecast - by Grade
- 9. South America Niobium Pentoxide Market Analysis, Insights and Forecast, 2019-2031
- 9.1. Market Analysis, Insights and Forecast - by Grade
- 9.1.1. Industrial Grade (purity: 99.0% to 99.8%)
- 9.1.2. 3N
- 9.1.3. 4N
- 9.2. Market Analysis, Insights and Forecast - by Application
- 9.2.1. Niobium Metal
- 9.2.2. Optical Glass
- 9.2.3. Supercapacitors
- 9.2.4. Superalloys
- 9.2.5. Ceramics
- 9.2.6. Other Applications
- 9.1. Market Analysis, Insights and Forecast - by Grade
- 10. Middle East and Africa Niobium Pentoxide Market Analysis, Insights and Forecast, 2019-2031
- 10.1. Market Analysis, Insights and Forecast - by Grade
- 10.1.1. Industrial Grade (purity: 99.0% to 99.8%)
- 10.1.2. 3N
- 10.1.3. 4N
- 10.2. Market Analysis, Insights and Forecast - by Application
- 10.2.1. Niobium Metal
- 10.2.2. Optical Glass
- 10.2.3. Supercapacitors
- 10.2.4. Superalloys
- 10.2.5. Ceramics
- 10.2.6. Other Applications
- 10.1. Market Analysis, Insights and Forecast - by Grade
- 11. Asia Pacific Niobium Pentoxide Market Analysis, Insights and Forecast, 2019-2031
- 11.1. Market Analysis, Insights and Forecast - By Country/Sub-region
- 11.1.1 China
- 11.1.2 India
- 11.1.3 Japan
- 11.1.4 South Korea
- 11.1.5 Rest of Asia Pacific
- 12. North America Niobium Pentoxide Market Analysis, Insights and Forecast, 2019-2031
- 12.1. Market Analysis, Insights and Forecast - By Country/Sub-region
- 12.1.1 United States
- 12.1.2 Canada
- 12.1.3 Mexico
- 13. Europe Niobium Pentoxide Market Analysis, Insights and Forecast, 2019-2031
- 13.1. Market Analysis, Insights and Forecast - By Country/Sub-region
- 13.1.1 Germany
- 13.1.2 United Kingdom
- 13.1.3 France
- 13.1.4 Italy
- 13.1.5 Rest of Europe
- 14. South America Niobium Pentoxide Market Analysis, Insights and Forecast, 2019-2031
- 14.1. Market Analysis, Insights and Forecast - By Country/Sub-region
- 14.1.1 Brazil
- 14.1.2 Argentina
- 14.1.3 Rest of South America
- 15. Middle East and Africa Niobium Pentoxide Market Analysis, Insights and Forecast, 2019-2031
- 15.1. Market Analysis, Insights and Forecast - By Country/Sub-region
- 15.1.1 Saudi Arabia
- 15.1.2 South Africa
- 15.1.3 Rest of Middle East and Africa
- 16. Competitive Analysis
- 16.1. Global Market Share Analysis 2024
- 16.2. Company Profiles
- 16.2.1 Solikamsk Magnesium Plant OJSC
- 16.2.1.1. Overview
- 16.2.1.2. Products
- 16.2.1.3. SWOT Analysis
- 16.2.1.4. Recent Developments
- 16.2.1.5. Financials (Based on Availability)
- 16.2.2 Taki Chemical Co Ltd
- 16.2.2.1. Overview
- 16.2.2.2. Products
- 16.2.2.3. SWOT Analysis
- 16.2.2.4. Recent Developments
- 16.2.2.5. Financials (Based on Availability)
- 16.2.3 MPIL
- 16.2.3.1. Overview
- 16.2.3.2. Products
- 16.2.3.3. SWOT Analysis
- 16.2.3.4. Recent Developments
- 16.2.3.5. Financials (Based on Availability)
- 16.2.4 AMG
- 16.2.4.1. Overview
- 16.2.4.2. Products
- 16.2.4.3. SWOT Analysis
- 16.2.4.4. Recent Developments
- 16.2.4.5. Financials (Based on Availability)
- 16.2.5 Mitsui Mining & Smelting Co Ltd
- 16.2.5.1. Overview
- 16.2.5.2. Products
- 16.2.5.3. SWOT Analysis
- 16.2.5.4. Recent Developments
- 16.2.5.5. Financials (Based on Availability)
- 16.2.6 JX Nippon Mining & Metals Corporation
- 16.2.6.1. Overview
- 16.2.6.2. Products
- 16.2.6.3. SWOT Analysis
- 16.2.6.4. Recent Developments
- 16.2.6.5. Financials (Based on Availability)
- 16.2.7 F&X Electro-Materials Limited
- 16.2.7.1. Overview
- 16.2.7.2. Products
- 16.2.7.3. SWOT Analysis
- 16.2.7.4. Recent Developments
- 16.2.7.5. Financials (Based on Availability)
- 16.2.8 King-Tan Tantalum Industry Ltd
- 16.2.8.1. Overview
- 16.2.8.2. Products
- 16.2.8.3. SWOT Analysis
- 16.2.8.4. Recent Developments
- 16.2.8.5. Financials (Based on Availability)
- 16.2.9 XIMEI Resources Holding Limited*List Not Exhaustive
- 16.2.9.1. Overview
- 16.2.9.2. Products
- 16.2.9.3. SWOT Analysis
- 16.2.9.4. Recent Developments
- 16.2.9.5. Financials (Based on Availability)
- 16.2.10 CBMM
- 16.2.10.1. Overview
- 16.2.10.2. Products
- 16.2.10.3. SWOT Analysis
- 16.2.10.4. Recent Developments
- 16.2.10.5. Financials (Based on Availability)
- 16.2.1 Solikamsk Magnesium Plant OJSC
List of Figures
- Figure 1: Global Niobium Pentoxide Market Revenue Breakdown (Million, %) by Region 2024 & 2032
- Figure 2: Asia Pacific Niobium Pentoxide Market Revenue (Million), by Country 2024 & 2032
- Figure 3: Asia Pacific Niobium Pentoxide Market Revenue Share (%), by Country 2024 & 2032
- Figure 4: North America Niobium Pentoxide Market Revenue (Million), by Country 2024 & 2032
- Figure 5: North America Niobium Pentoxide Market Revenue Share (%), by Country 2024 & 2032
- Figure 6: Europe Niobium Pentoxide Market Revenue (Million), by Country 2024 & 2032
- Figure 7: Europe Niobium Pentoxide Market Revenue Share (%), by Country 2024 & 2032
- Figure 8: South America Niobium Pentoxide Market Revenue (Million), by Country 2024 & 2032
- Figure 9: South America Niobium Pentoxide Market Revenue Share (%), by Country 2024 & 2032
- Figure 10: Middle East and Africa Niobium Pentoxide Market Revenue (Million), by Country 2024 & 2032
- Figure 11: Middle East and Africa Niobium Pentoxide Market Revenue Share (%), by Country 2024 & 2032
- Figure 12: Asia Pacific Niobium Pentoxide Market Revenue (Million), by Grade 2024 & 2032
- Figure 13: Asia Pacific Niobium Pentoxide Market Revenue Share (%), by Grade 2024 & 2032
- Figure 14: Asia Pacific Niobium Pentoxide Market Revenue (Million), by Application 2024 & 2032
- Figure 15: Asia Pacific Niobium Pentoxide Market Revenue Share (%), by Application 2024 & 2032
- Figure 16: Asia Pacific Niobium Pentoxide Market Revenue (Million), by Country 2024 & 2032
- Figure 17: Asia Pacific Niobium Pentoxide Market Revenue Share (%), by Country 2024 & 2032
- Figure 18: North America Niobium Pentoxide Market Revenue (Million), by Grade 2024 & 2032
- Figure 19: North America Niobium Pentoxide Market Revenue Share (%), by Grade 2024 & 2032
- Figure 20: North America Niobium Pentoxide Market Revenue (Million), by Application 2024 & 2032
- Figure 21: North America Niobium Pentoxide Market Revenue Share (%), by Application 2024 & 2032
- Figure 22: North America Niobium Pentoxide Market Revenue (Million), by Country 2024 & 2032
- Figure 23: North America Niobium Pentoxide Market Revenue Share (%), by Country 2024 & 2032
- Figure 24: Europe Niobium Pentoxide Market Revenue (Million), by Grade 2024 & 2032
- Figure 25: Europe Niobium Pentoxide Market Revenue Share (%), by Grade 2024 & 2032
- Figure 26: Europe Niobium Pentoxide Market Revenue (Million), by Application 2024 & 2032
- Figure 27: Europe Niobium Pentoxide Market Revenue Share (%), by Application 2024 & 2032
- Figure 28: Europe Niobium Pentoxide Market Revenue (Million), by Country 2024 & 2032
- Figure 29: Europe Niobium Pentoxide Market Revenue Share (%), by Country 2024 & 2032
- Figure 30: South America Niobium Pentoxide Market Revenue (Million), by Grade 2024 & 2032
- Figure 31: South America Niobium Pentoxide Market Revenue Share (%), by Grade 2024 & 2032
- Figure 32: South America Niobium Pentoxide Market Revenue (Million), by Application 2024 & 2032
- Figure 33: South America Niobium Pentoxide Market Revenue Share (%), by Application 2024 & 2032
- Figure 34: South America Niobium Pentoxide Market Revenue (Million), by Country 2024 & 2032
- Figure 35: South America Niobium Pentoxide Market Revenue Share (%), by Country 2024 & 2032
- Figure 36: Middle East and Africa Niobium Pentoxide Market Revenue (Million), by Grade 2024 & 2032
- Figure 37: Middle East and Africa Niobium Pentoxide Market Revenue Share (%), by Grade 2024 & 2032
- Figure 38: Middle East and Africa Niobium Pentoxide Market Revenue (Million), by Application 2024 & 2032
- Figure 39: Middle East and Africa Niobium Pentoxide Market Revenue Share (%), by Application 2024 & 2032
- Figure 40: Middle East and Africa Niobium Pentoxide Market Revenue (Million), by Country 2024 & 2032
- Figure 41: Middle East and Africa Niobium Pentoxide Market Revenue Share (%), by Country 2024 & 2032
List of Tables
- Table 1: Global Niobium Pentoxide Market Revenue Million Forecast, by Region 2019 & 2032
- Table 2: Global Niobium Pentoxide Market Revenue Million Forecast, by Grade 2019 & 2032
- Table 3: Global Niobium Pentoxide Market Revenue Million Forecast, by Application 2019 & 2032
- Table 4: Global Niobium Pentoxide Market Revenue Million Forecast, by Region 2019 & 2032
- Table 5: Global Niobium Pentoxide Market Revenue Million Forecast, by Country 2019 & 2032
- Table 6: China Niobium Pentoxide Market Revenue (Million) Forecast, by Application 2019 & 2032
- Table 7: India Niobium Pentoxide Market Revenue (Million) Forecast, by Application 2019 & 2032
- Table 8: Japan Niobium Pentoxide Market Revenue (Million) Forecast, by Application 2019 & 2032
- Table 9: South Korea Niobium Pentoxide Market Revenue (Million) Forecast, by Application 2019 & 2032
- Table 10: Rest of Asia Pacific Niobium Pentoxide Market Revenue (Million) Forecast, by Application 2019 & 2032
- Table 11: Global Niobium Pentoxide Market Revenue Million Forecast, by Country 2019 & 2032
- Table 12: United States Niobium Pentoxide Market Revenue (Million) Forecast, by Application 2019 & 2032
- Table 13: Canada Niobium Pentoxide Market Revenue (Million) Forecast, by Application 2019 & 2032
- Table 14: Mexico Niobium Pentoxide Market Revenue (Million) Forecast, by Application 2019 & 2032
- Table 15: Global Niobium Pentoxide Market Revenue Million Forecast, by Country 2019 & 2032
- Table 16: Germany Niobium Pentoxide Market Revenue (Million) Forecast, by Application 2019 & 2032
- Table 17: United Kingdom Niobium Pentoxide Market Revenue (Million) Forecast, by Application 2019 & 2032
- Table 18: France Niobium Pentoxide Market Revenue (Million) Forecast, by Application 2019 & 2032
- Table 19: Italy Niobium Pentoxide Market Revenue (Million) Forecast, by Application 2019 & 2032
- Table 20: Rest of Europe Niobium Pentoxide Market Revenue (Million) Forecast, by Application 2019 & 2032
- Table 21: Global Niobium Pentoxide Market Revenue Million Forecast, by Country 2019 & 2032
- Table 22: Brazil Niobium Pentoxide Market Revenue (Million) Forecast, by Application 2019 & 2032
- Table 23: Argentina Niobium Pentoxide Market Revenue (Million) Forecast, by Application 2019 & 2032
- Table 24: Rest of South America Niobium Pentoxide Market Revenue (Million) Forecast, by Application 2019 & 2032
- Table 25: Global Niobium Pentoxide Market Revenue Million Forecast, by Country 2019 & 2032
- Table 26: Saudi Arabia Niobium Pentoxide Market Revenue (Million) Forecast, by Application 2019 & 2032
- Table 27: South Africa Niobium Pentoxide Market Revenue (Million) Forecast, by Application 2019 & 2032
- Table 28: Rest of Middle East and Africa Niobium Pentoxide Market Revenue (Million) Forecast, by Application 2019 & 2032
- Table 29: Global Niobium Pentoxide Market Revenue Million Forecast, by Grade 2019 & 2032
- Table 30: Global Niobium Pentoxide Market Revenue Million Forecast, by Application 2019 & 2032
- Table 31: Global Niobium Pentoxide Market Revenue Million Forecast, by Country 2019 & 2032
- Table 32: China Niobium Pentoxide Market Revenue (Million) Forecast, by Application 2019 & 2032
- Table 33: India Niobium Pentoxide Market Revenue (Million) Forecast, by Application 2019 & 2032
- Table 34: Japan Niobium Pentoxide Market Revenue (Million) Forecast, by Application 2019 & 2032
- Table 35: South Korea Niobium Pentoxide Market Revenue (Million) Forecast, by Application 2019 & 2032
- Table 36: Rest of Asia Pacific Niobium Pentoxide Market Revenue (Million) Forecast, by Application 2019 & 2032
- Table 37: Global Niobium Pentoxide Market Revenue Million Forecast, by Grade 2019 & 2032
- Table 38: Global Niobium Pentoxide Market Revenue Million Forecast, by Application 2019 & 2032
- Table 39: Global Niobium Pentoxide Market Revenue Million Forecast, by Country 2019 & 2032
- Table 40: United States Niobium Pentoxide Market Revenue (Million) Forecast, by Application 2019 & 2032
- Table 41: Canada Niobium Pentoxide Market Revenue (Million) Forecast, by Application 2019 & 2032
- Table 42: Mexico Niobium Pentoxide Market Revenue (Million) Forecast, by Application 2019 & 2032
- Table 43: Global Niobium Pentoxide Market Revenue Million Forecast, by Grade 2019 & 2032
- Table 44: Global Niobium Pentoxide Market Revenue Million Forecast, by Application 2019 & 2032
- Table 45: Global Niobium Pentoxide Market Revenue Million Forecast, by Country 2019 & 2032
- Table 46: Germany Niobium Pentoxide Market Revenue (Million) Forecast, by Application 2019 & 2032
- Table 47: United Kingdom Niobium Pentoxide Market Revenue (Million) Forecast, by Application 2019 & 2032
- Table 48: France Niobium Pentoxide Market Revenue (Million) Forecast, by Application 2019 & 2032
- Table 49: Italy Niobium Pentoxide Market Revenue (Million) Forecast, by Application 2019 & 2032
- Table 50: Rest of Europe Niobium Pentoxide Market Revenue (Million) Forecast, by Application 2019 & 2032
- Table 51: Global Niobium Pentoxide Market Revenue Million Forecast, by Grade 2019 & 2032
- Table 52: Global Niobium Pentoxide Market Revenue Million Forecast, by Application 2019 & 2032
- Table 53: Global Niobium Pentoxide Market Revenue Million Forecast, by Country 2019 & 2032
- Table 54: Brazil Niobium Pentoxide Market Revenue (Million) Forecast, by Application 2019 & 2032
- Table 55: Argentina Niobium Pentoxide Market Revenue (Million) Forecast, by Application 2019 & 2032
- Table 56: Rest of South America Niobium Pentoxide Market Revenue (Million) Forecast, by Application 2019 & 2032
- Table 57: Global Niobium Pentoxide Market Revenue Million Forecast, by Grade 2019 & 2032
- Table 58: Global Niobium Pentoxide Market Revenue Million Forecast, by Application 2019 & 2032
- Table 59: Global Niobium Pentoxide Market Revenue Million Forecast, by Country 2019 & 2032
- Table 60: Saudi Arabia Niobium Pentoxide Market Revenue (Million) Forecast, by Application 2019 & 2032
- Table 61: South Africa Niobium Pentoxide Market Revenue (Million) Forecast, by Application 2019 & 2032
- Table 62: Rest of Middle East and Africa Niobium Pentoxide Market Revenue (Million) Forecast, by Application 2019 & 2032
Frequently Asked Questions
1. What is the projected Compound Annual Growth Rate (CAGR) of the Niobium Pentoxide Market?
The projected CAGR is approximately 10.09%.
2. Which companies are prominent players in the Niobium Pentoxide Market?
Key companies in the market include Solikamsk Magnesium Plant OJSC, Taki Chemical Co Ltd, MPIL, AMG, Mitsui Mining & Smelting Co Ltd, JX Nippon Mining & Metals Corporation, F&X Electro-Materials Limited, King-Tan Tantalum Industry Ltd, XIMEI Resources Holding Limited*List Not Exhaustive, CBMM.
3. What are the main segments of the Niobium Pentoxide Market?
The market segments include Grade, Application.
4. Can you provide details about the market size?
The market size is estimated to be USD XX Million as of 2022.
5. What are some drivers contributing to market growth?
Growing Demand from the Electric Vehicles Segment; Growing Demand for High-Quality Steel from the Manufacturing Sector.
6. What are the notable trends driving market growth?
Increasing Usage in the Production of Niobium Metal.
7. Are there any restraints impacting market growth?
Concerns About Health Issues on Acute Exposure.
8. Can you provide examples of recent developments in the market?
December 2022: CBMM announced a USD 80 million investment to expand niobium oxide capacity from 500 tons to 3,000 tons by 2024. Through a collaboration with Echion Technologies, CBMM plans to establish a niobium oxide facility at its Araxá plant in Minas Gerais, Brazil, aligning with its goal of achieving a niobium oxide capacity of 40,000 t by 2030.
9. What pricing options are available for accessing the report?
Pricing options include single-user, multi-user, and enterprise licenses priced at USD 4750, USD 5250, and USD 8750 respectively.
10. Is the market size provided in terms of value or volume?
The market size is provided in terms of value, measured in Million.
11. Are there any specific market keywords associated with the report?
Yes, the market keyword associated with the report is "Niobium Pentoxide Market," which aids in identifying and referencing the specific market segment covered.
12. How do I determine which pricing option suits my needs best?
The pricing options vary based on user requirements and access needs. Individual users may opt for single-user licenses, while businesses requiring broader access may choose multi-user or enterprise licenses for cost-effective access to the report.
13. Are there any additional resources or data provided in the Niobium Pentoxide Market report?
While the report offers comprehensive insights, it's advisable to review the specific contents or supplementary materials provided to ascertain if additional resources or data are available.
14. How can I stay updated on further developments or reports in the Niobium Pentoxide Market?
To stay informed about further developments, trends, and reports in the Niobium Pentoxide Market, consider subscribing to industry newsletters, following relevant companies and organizations, or regularly checking reputable industry news sources and publications.
Methodology
Step 1 - Identification of Relevant Samples Size from Population Database


Step 2 - Approaches for Defining Global Market Size (Value, Volume* & Price*)

Note*: In applicable scenarios
Step 3 - Data Sources
Primary Research
- Web Analytics
- Survey Reports
- Research Institute
- Latest Research Reports
- Opinion Leaders
Secondary Research
- Annual Reports
- White Paper
- Latest Press Release
- Industry Association
- Paid Database
- Investor Presentations

Step 4 - Data Triangulation
Involves using different sources of information in order to increase the validity of a study
These sources are likely to be stakeholders in a program - participants, other researchers, program staff, other community members, and so on.
Then we put all data in single framework & apply various statistical tools to find out the dynamic on the market.
During the analysis stage, feedback from the stakeholder groups would be compared to determine areas of agreement as well as areas of divergence
