

Key Insights
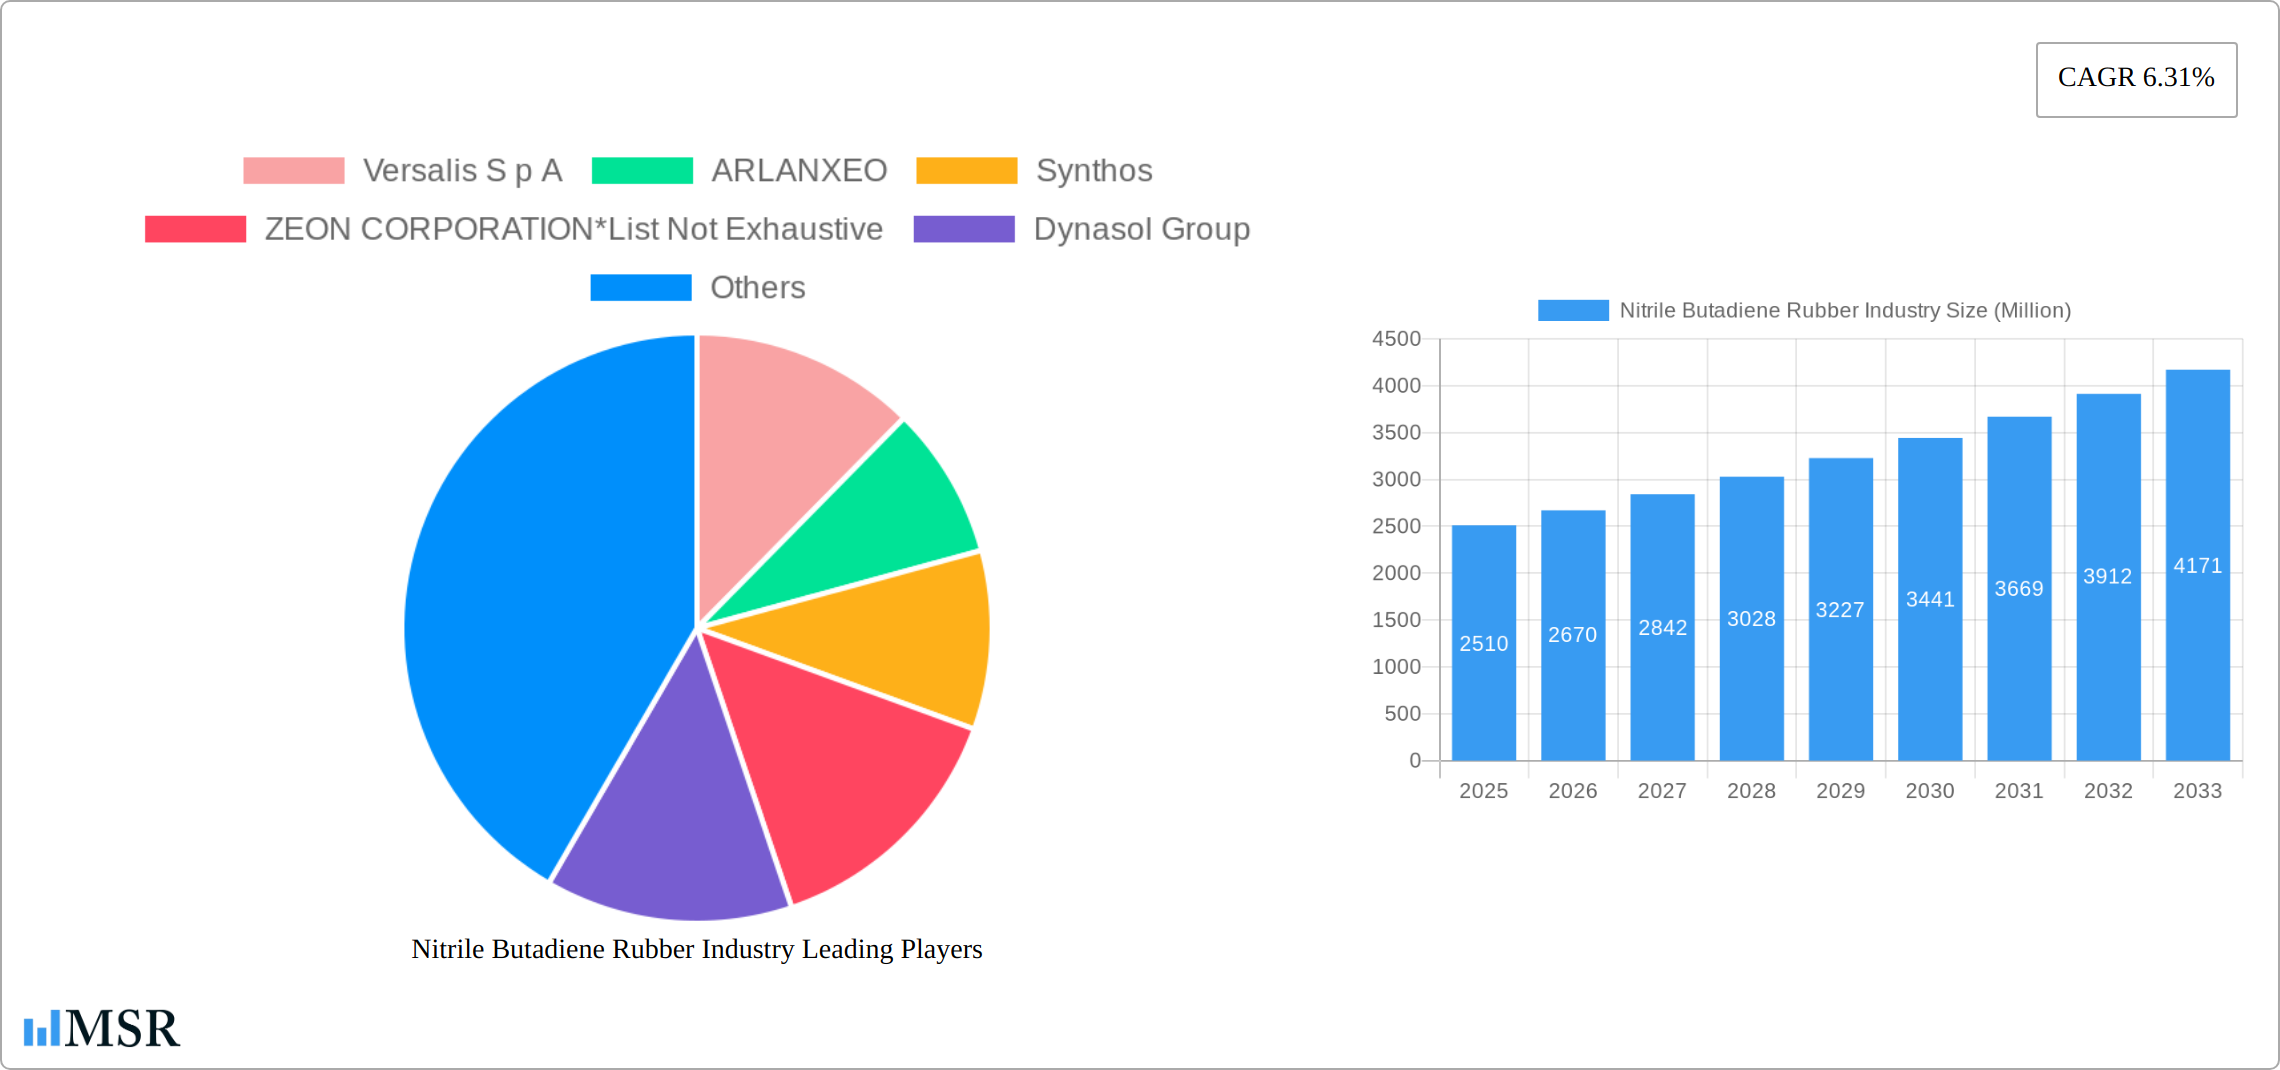
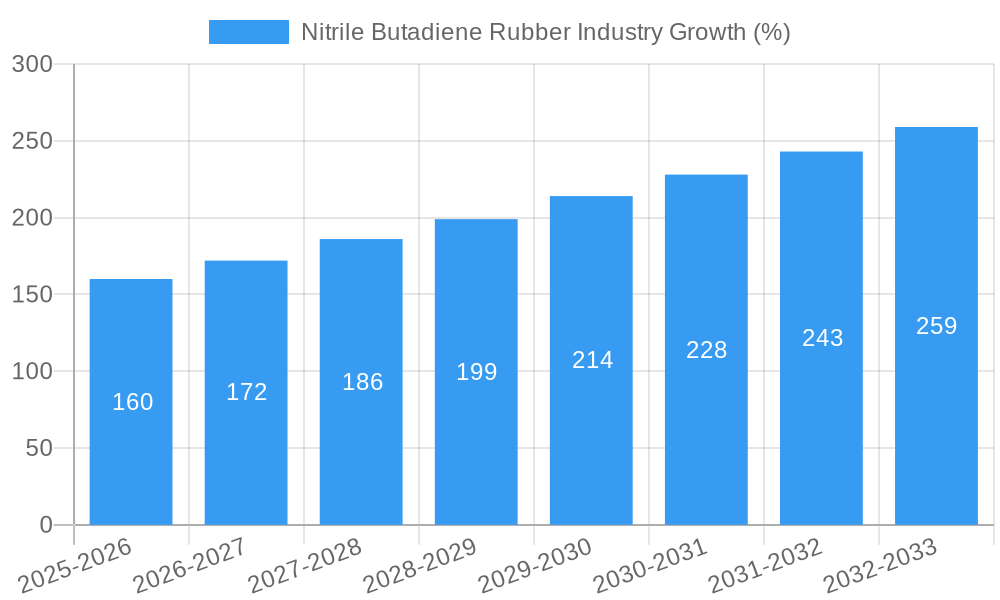
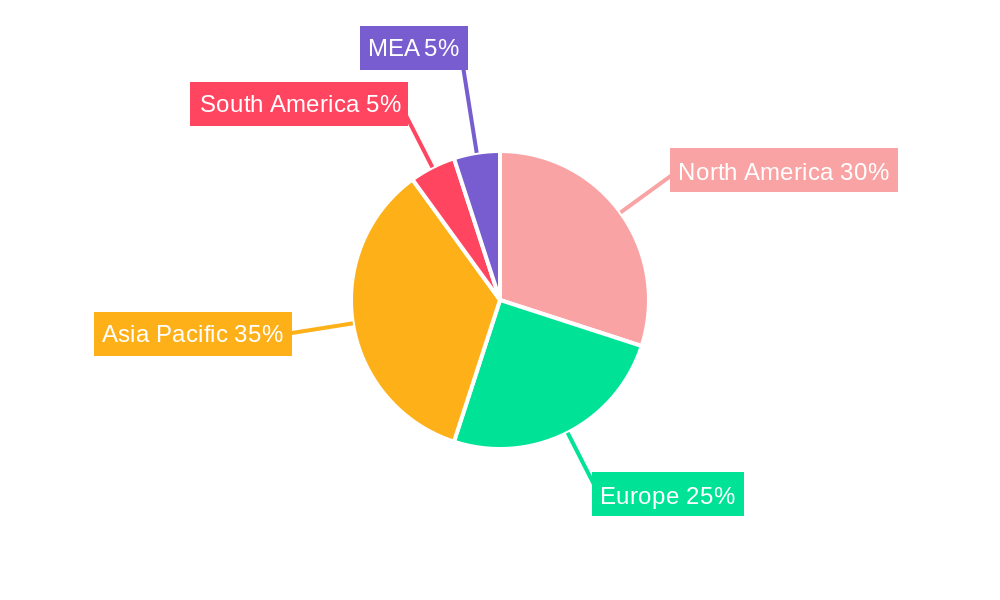
The Nitrile Butadiene Rubber (NBR) market, valued at $2.51 billion in 2025, is projected to experience robust growth, driven by increasing demand across diverse end-use industries. A compound annual growth rate (CAGR) of 6.31% from 2025 to 2033 indicates significant expansion potential. Key drivers include the automotive and transportation sector's reliance on NBR for seals, hoses, and belts due to its oil resistance and durability. The building and construction industry also contributes significantly, leveraging NBR's properties in gaskets and sealants for water resistance and longevity. Growth is further fueled by increasing applications in medical devices, particularly gloves and tubing, where biocompatibility is crucial. While specific restraining factors are not provided, potential challenges could include fluctuating raw material prices and the emergence of competing elastomers. The market is segmented by application (adhesives & sealants, belts & cables, gloves, hoses, gaskets & O-rings, consumer goods) and end-user industry (automotive, building & construction, industrial, medical, oil & gas, aerospace). Geographical analysis suggests North America and Asia-Pacific are major markets, benefiting from established manufacturing bases and substantial demand. The presence of key players like Versalis, ARLANXEO, and others indicates a competitive landscape, driving innovation and potentially leading to price optimization. The forecast period suggests continued expansion, driven by increasing industrialization, infrastructure development, and advancements in automotive and medical technologies.
The projected growth trajectory of the NBR market stems from several converging factors. The increasing focus on sustainable materials and environmentally friendly manufacturing processes within various industries contributes to the growing demand for NBR's robust and durable properties. Further technological advancements in NBR formulations, leading to enhanced performance characteristics like improved heat resistance and chemical compatibility, will also fuel market expansion. However, the market will need to navigate potential challenges such as supply chain disruptions and regulatory compliance changes. Geographical diversification strategies by major players will play a significant role in shaping the market dynamics over the forecast period. The competitive landscape, marked by the presence of both global and regional players, is expected to remain dynamic, with mergers, acquisitions, and strategic partnerships shaping future market consolidation.
Deep Dive into the Nitrile Butadiene Rubber (NBR) Industry: A Comprehensive Market Report (2019-2033)
This comprehensive report provides an in-depth analysis of the Nitrile Butadiene Rubber (NBR) industry, offering invaluable insights for stakeholders, investors, and industry professionals. Covering the period 2019-2033, with a focus on 2025, this report meticulously examines market dynamics, key players, emerging trends, and future growth prospects. The global NBR market is projected to reach xx Million by 2033, exhibiting a CAGR of xx% during the forecast period (2025-2033).
Nitrile Butadiene Rubber Industry Market Concentration & Dynamics
The NBR industry exhibits a moderately concentrated market structure, with several major players holding significant market share. The top players, including Versalis S.p.A, ARLANXEO, Synthos, ZEON CORPORATION, Dynasol Group, ENEOS Materials Corporation, KUMHO PETROCHEMICAL, SIBUR, Synthomer PLC, LG Chem, China Petrochemical Corporation (Sinopec), Apcotex, Lanxess, and TSRC, collectively account for approximately xx% of the global market. The industry is characterized by a dynamic competitive landscape, influenced by:
- Innovation Ecosystems: Continuous research and development efforts focused on improving NBR properties (e.g., heat resistance, oil resistance) and expanding applications.
- Regulatory Frameworks: Stringent environmental regulations impacting production processes and material composition.
- Substitute Products: Competition from alternative elastomers like EPDM and silicone rubber influences NBR market share.
- End-User Trends: Growth in automotive, medical, and construction sectors directly impacts NBR demand.
- M&A Activities: Consolidation within the industry through mergers and acquisitions, impacting market share distribution. In the past five years, there have been approximately xx M&A deals in the NBR sector.
Nitrile Butadiene Rubber Industry Insights & Trends
The NBR market is experiencing significant growth driven by several factors. The increasing demand from automotive and construction industries, propelled by infrastructural development and rising vehicle production, is a primary driver. The global market size reached xx Million in 2024. Technological advancements leading to improved NBR grades with enhanced properties are also contributing to market expansion. Evolving consumer preferences towards high-performance, durable materials in various applications further fuel market growth. Significant technological disruptions include the development of specialized NBR compounds for specific applications, like high-temperature resistance for aerospace components or biocompatibility for medical devices.
Key Markets & Segments Leading Nitrile Butadiene Rubber Industry
The Gloves segment within the Application category holds the largest market share, driven by the surging demand for disposable gloves in the healthcare and industrial sectors. The Automotive and Transportation end-user industry is the dominant segment, fueled by the robust growth of the automotive sector globally.
Key Drivers:
- Automotive and Transportation: Increasing vehicle production, stringent automotive regulations, and demand for high-performance parts.
- Medical: Growth in healthcare spending, rising demand for medical devices, and stringent hygiene standards.
- Building and Construction: Expanding infrastructure projects, increasing construction activities, and demand for durable sealing materials.
Dominance Analysis: Asia-Pacific is currently the leading region for NBR consumption due to its substantial automotive and construction industries, followed by North America and Europe.
Nitrile Butadiene Rubber Industry Product Developments
Recent advancements in NBR technology focus on developing specialized compounds with improved properties such as higher tensile strength, increased resistance to chemicals and oils, and better low-temperature flexibility. These innovations cater to the demands of various niche applications, granting manufacturers a competitive edge in the market. New formulations also emphasize environmentally friendly production methods, aligning with growing sustainability concerns.
Challenges in the Nitrile Butadiene Rubber Industry Market
The NBR industry faces several challenges, including volatile raw material prices (butadiene and acrylonitrile), fluctuating oil prices influencing production costs, and intense competition from substitute materials. Supply chain disruptions due to geopolitical instability can also significantly impact production and availability, leading to price volatility and potential shortages. Moreover, stringent environmental regulations increase compliance costs and operational complexities.
Forces Driving Nitrile Butadiene Rubber Industry Growth
Several factors contribute to the long-term growth of the NBR market. These include technological advancements in NBR formulations, expansion into new applications, and increasing demand from emerging economies. Economic growth in developing countries leads to higher construction and automotive production, boosting NBR demand. Favorable government policies supporting infrastructure development further contribute to the market's upward trajectory.
Long-Term Growth Catalysts in the Nitrile Butadiene Rubber Industry
The long-term growth of the NBR industry is fueled by continuous innovation, strategic partnerships, and market expansions into new applications like renewable energy and advanced electronics. Strategic collaborations between NBR manufacturers and end-users to develop customized solutions for specific applications pave the way for sustained market growth. The exploration of new markets and expansion into high-growth regions promise further expansion.
Emerging Opportunities in Nitrile Butadiene Rubber Industry
The NBR industry presents exciting opportunities in developing sustainable and biodegradable NBR compounds, catering to the growing environmental consciousness. Expanding into niche applications within the aerospace, renewable energy, and 3D printing sectors presents significant growth potential. Furthermore, leveraging advanced technologies such as nanotechnology to improve NBR properties can offer a significant competitive advantage.
Leading Players in the Nitrile Butadiene Rubber Industry Sector
- Versalis S.p.A
- ARLANXEO
- Synthos
- ZEON CORPORATION
- Dynasol Group
- ENEOS Materials Corporation
- KUMHO PETROCHEMICAL
- SIBUR
- Synthomer PLC
- LG Chem
- China Petrochemical Corporation (Sinopec)
- Apcotex
- Lanxess
- TSRC
Key Milestones in Nitrile Butadiene Rubber Industry Industry
- August 2022: Kumho Petrochemical announced a KRW 6,000 billion (~USD 5.10 billion) investment in existing and new businesses over the next five years, with a significant portion (KRW 3,300 billion or ~USD 2.81 billion) allocated to core business areas, including NB latex and SSBR manufacturing. This investment signifies a strong commitment to expanding NBR production capacity and enhancing market competitiveness.
Strategic Outlook for Nitrile Butadiene Rubber Industry Market
The future of the NBR market appears bright, driven by technological innovations, strategic collaborations, and sustainable product development. Companies focusing on developing high-performance, specialized NBR compounds tailored to specific applications will experience strong growth. Expanding into emerging markets and capitalizing on the growing demand for sustainable materials will be crucial for sustained success within this dynamic industry. The continued focus on technological advancements and sustainable practices positions the NBR industry for robust expansion in the coming decade.
Nitrile Butadiene Rubber Industry Segmentation
-
1. Application
- 1.1. Adhesives and Sealants
- 1.2. Belts and Cables
- 1.3. Gloves
- 1.4. Hoses
- 1.5. Gaskets and O-Rings
- 1.6. Other Applications (Consumer Goods)
-
2. End-user Industry
- 2.1. Automotive and Transportation
- 2.2. Building and Construction
- 2.3. Industrial
- 2.4. Medical
- 2.5. Other End-user Industries (Oil and Gas, Aerospace)
Nitrile Butadiene Rubber Industry Segmentation By Geography
-
1. Asia Pacific
- 1.1. China
- 1.2. India
- 1.3. Japan
- 1.4. South Korea
- 1.5. Malaysia
- 1.6. Thailand
- 1.7. Vietnam
- 1.8. Indonesia
- 1.9. Rest of Asia Pacific
-
2. North America
- 2.1. United States
- 2.2. Canada
- 2.3. Mexico
-
3. Europe
- 3.1. Germany
- 3.2. United Kingdom
- 3.3. Italy
- 3.4. France
- 3.5. Spain
- 3.6. Turkey
- 3.7. Russia
- 3.8. NORDIC
- 3.9. Rest of Europe
-
4. South America
- 4.1. Brazil
- 4.2. Argentina
- 4.3. Colombia
- 4.4. Rest of South America
-
5. Middle East and Africa
- 5.1. Saudi Arabia
- 5.2. South Africa
- 5.3. Nigeria
- 5.4. Egypt
- 5.5. Qatar
- 5.6. UAE
- 5.7. Rest of Middle East and Africa
Nitrile Butadiene Rubber Industry REPORT HIGHLIGHTS
| Aspects | Details |
|---|---|
| Study Period | 2019-2033 |
| Base Year | 2024 |
| Estimated Year | 2025 |
| Forecast Period | 2025-2033 |
| Historical Period | 2019-2024 |
| Growth Rate | CAGR of 6.31% from 2019-2033 |
| Segmentation |
|
Table of Contents
- 1. Introduction
- 1.1. Research Scope
- 1.2. Market Segmentation
- 1.3. Research Methodology
- 1.4. Definitions and Assumptions
- 2. Executive Summary
- 2.1. Introduction
- 3. Market Dynamics
- 3.1. Introduction
- 3.2. Market Drivers
- 3.2.1. Expanding Automotive Industry; Industrial and Infrastructure Development Projects
- 3.3. Market Restrains
- 3.3.1. Availability of Substitute Materials; Fluctuating Raw Material Prices
- 3.4. Market Trends
- 3.4.1. Automotive and Transportation Sector Dominates the Market
- 4. Market Factor Analysis
- 4.1. Porters Five Forces
- 4.2. Supply/Value Chain
- 4.3. PESTEL analysis
- 4.4. Market Entropy
- 4.5. Patent/Trademark Analysis
- 5. Global Nitrile Butadiene Rubber Industry Analysis, Insights and Forecast, 2019-2031
- 5.1. Market Analysis, Insights and Forecast - by Application
- 5.1.1. Adhesives and Sealants
- 5.1.2. Belts and Cables
- 5.1.3. Gloves
- 5.1.4. Hoses
- 5.1.5. Gaskets and O-Rings
- 5.1.6. Other Applications (Consumer Goods)
- 5.2. Market Analysis, Insights and Forecast - by End-user Industry
- 5.2.1. Automotive and Transportation
- 5.2.2. Building and Construction
- 5.2.3. Industrial
- 5.2.4. Medical
- 5.2.5. Other End-user Industries (Oil and Gas, Aerospace)
- 5.3. Market Analysis, Insights and Forecast - by Region
- 5.3.1. Asia Pacific
- 5.3.2. North America
- 5.3.3. Europe
- 5.3.4. South America
- 5.3.5. Middle East and Africa
- 5.1. Market Analysis, Insights and Forecast - by Application
- 6. Asia Pacific Nitrile Butadiene Rubber Industry Analysis, Insights and Forecast, 2019-2031
- 6.1. Market Analysis, Insights and Forecast - by Application
- 6.1.1. Adhesives and Sealants
- 6.1.2. Belts and Cables
- 6.1.3. Gloves
- 6.1.4. Hoses
- 6.1.5. Gaskets and O-Rings
- 6.1.6. Other Applications (Consumer Goods)
- 6.2. Market Analysis, Insights and Forecast - by End-user Industry
- 6.2.1. Automotive and Transportation
- 6.2.2. Building and Construction
- 6.2.3. Industrial
- 6.2.4. Medical
- 6.2.5. Other End-user Industries (Oil and Gas, Aerospace)
- 6.1. Market Analysis, Insights and Forecast - by Application
- 7. North America Nitrile Butadiene Rubber Industry Analysis, Insights and Forecast, 2019-2031
- 7.1. Market Analysis, Insights and Forecast - by Application
- 7.1.1. Adhesives and Sealants
- 7.1.2. Belts and Cables
- 7.1.3. Gloves
- 7.1.4. Hoses
- 7.1.5. Gaskets and O-Rings
- 7.1.6. Other Applications (Consumer Goods)
- 7.2. Market Analysis, Insights and Forecast - by End-user Industry
- 7.2.1. Automotive and Transportation
- 7.2.2. Building and Construction
- 7.2.3. Industrial
- 7.2.4. Medical
- 7.2.5. Other End-user Industries (Oil and Gas, Aerospace)
- 7.1. Market Analysis, Insights and Forecast - by Application
- 8. Europe Nitrile Butadiene Rubber Industry Analysis, Insights and Forecast, 2019-2031
- 8.1. Market Analysis, Insights and Forecast - by Application
- 8.1.1. Adhesives and Sealants
- 8.1.2. Belts and Cables
- 8.1.3. Gloves
- 8.1.4. Hoses
- 8.1.5. Gaskets and O-Rings
- 8.1.6. Other Applications (Consumer Goods)
- 8.2. Market Analysis, Insights and Forecast - by End-user Industry
- 8.2.1. Automotive and Transportation
- 8.2.2. Building and Construction
- 8.2.3. Industrial
- 8.2.4. Medical
- 8.2.5. Other End-user Industries (Oil and Gas, Aerospace)
- 8.1. Market Analysis, Insights and Forecast - by Application
- 9. South America Nitrile Butadiene Rubber Industry Analysis, Insights and Forecast, 2019-2031
- 9.1. Market Analysis, Insights and Forecast - by Application
- 9.1.1. Adhesives and Sealants
- 9.1.2. Belts and Cables
- 9.1.3. Gloves
- 9.1.4. Hoses
- 9.1.5. Gaskets and O-Rings
- 9.1.6. Other Applications (Consumer Goods)
- 9.2. Market Analysis, Insights and Forecast - by End-user Industry
- 9.2.1. Automotive and Transportation
- 9.2.2. Building and Construction
- 9.2.3. Industrial
- 9.2.4. Medical
- 9.2.5. Other End-user Industries (Oil and Gas, Aerospace)
- 9.1. Market Analysis, Insights and Forecast - by Application
- 10. Middle East and Africa Nitrile Butadiene Rubber Industry Analysis, Insights and Forecast, 2019-2031
- 10.1. Market Analysis, Insights and Forecast - by Application
- 10.1.1. Adhesives and Sealants
- 10.1.2. Belts and Cables
- 10.1.3. Gloves
- 10.1.4. Hoses
- 10.1.5. Gaskets and O-Rings
- 10.1.6. Other Applications (Consumer Goods)
- 10.2. Market Analysis, Insights and Forecast - by End-user Industry
- 10.2.1. Automotive and Transportation
- 10.2.2. Building and Construction
- 10.2.3. Industrial
- 10.2.4. Medical
- 10.2.5. Other End-user Industries (Oil and Gas, Aerospace)
- 10.1. Market Analysis, Insights and Forecast - by Application
- 11. North America Nitrile Butadiene Rubber Industry Analysis, Insights and Forecast, 2019-2031
- 11.1. Market Analysis, Insights and Forecast - By Country/Sub-region
- 11.1.1 United States
- 11.1.2 Canada
- 11.1.3 Mexico
- 12. Europe Nitrile Butadiene Rubber Industry Analysis, Insights and Forecast, 2019-2031
- 12.1. Market Analysis, Insights and Forecast - By Country/Sub-region
- 12.1.1 Germany
- 12.1.2 France
- 12.1.3 Italy
- 12.1.4 United Kingdom
- 12.1.5 Netherlands
- 12.1.6 Rest of Europe
- 13. Asia Pacific Nitrile Butadiene Rubber Industry Analysis, Insights and Forecast, 2019-2031
- 13.1. Market Analysis, Insights and Forecast - By Country/Sub-region
- 13.1.1 China
- 13.1.2 Japan
- 13.1.3 India
- 13.1.4 South Korea
- 13.1.5 Taiwan
- 13.1.6 Australia
- 13.1.7 Rest of Asia-Pacific
- 14. South America Nitrile Butadiene Rubber Industry Analysis, Insights and Forecast, 2019-2031
- 14.1. Market Analysis, Insights and Forecast - By Country/Sub-region
- 14.1.1 Brazil
- 14.1.2 Argentina
- 14.1.3 Rest of South America
- 15. MEA Nitrile Butadiene Rubber Industry Analysis, Insights and Forecast, 2019-2031
- 15.1. Market Analysis, Insights and Forecast - By Country/Sub-region
- 15.1.1 Middle East
- 15.1.2 Africa
- 16. Competitive Analysis
- 16.1. Global Market Share Analysis 2024
- 16.2. Company Profiles
- 16.2.1 Versalis S p A
- 16.2.1.1. Overview
- 16.2.1.2. Products
- 16.2.1.3. SWOT Analysis
- 16.2.1.4. Recent Developments
- 16.2.1.5. Financials (Based on Availability)
- 16.2.2 ARLANXEO
- 16.2.2.1. Overview
- 16.2.2.2. Products
- 16.2.2.3. SWOT Analysis
- 16.2.2.4. Recent Developments
- 16.2.2.5. Financials (Based on Availability)
- 16.2.3 Synthos
- 16.2.3.1. Overview
- 16.2.3.2. Products
- 16.2.3.3. SWOT Analysis
- 16.2.3.4. Recent Developments
- 16.2.3.5. Financials (Based on Availability)
- 16.2.4 ZEON CORPORATION*List Not Exhaustive
- 16.2.4.1. Overview
- 16.2.4.2. Products
- 16.2.4.3. SWOT Analysis
- 16.2.4.4. Recent Developments
- 16.2.4.5. Financials (Based on Availability)
- 16.2.5 Dynasol Group
- 16.2.5.1. Overview
- 16.2.5.2. Products
- 16.2.5.3. SWOT Analysis
- 16.2.5.4. Recent Developments
- 16.2.5.5. Financials (Based on Availability)
- 16.2.6 ENEOS Materials Corporation
- 16.2.6.1. Overview
- 16.2.6.2. Products
- 16.2.6.3. SWOT Analysis
- 16.2.6.4. Recent Developments
- 16.2.6.5. Financials (Based on Availability)
- 16.2.7 KUMHO PETROCHEMICAL
- 16.2.7.1. Overview
- 16.2.7.2. Products
- 16.2.7.3. SWOT Analysis
- 16.2.7.4. Recent Developments
- 16.2.7.5. Financials (Based on Availability)
- 16.2.8 SIBUR
- 16.2.8.1. Overview
- 16.2.8.2. Products
- 16.2.8.3. SWOT Analysis
- 16.2.8.4. Recent Developments
- 16.2.8.5. Financials (Based on Availability)
- 16.2.9 Synthomer PLC
- 16.2.9.1. Overview
- 16.2.9.2. Products
- 16.2.9.3. SWOT Analysis
- 16.2.9.4. Recent Developments
- 16.2.9.5. Financials (Based on Availability)
- 16.2.10 LG Chem
- 16.2.10.1. Overview
- 16.2.10.2. Products
- 16.2.10.3. SWOT Analysis
- 16.2.10.4. Recent Developments
- 16.2.10.5. Financials (Based on Availability)
- 16.2.11 China Petrochemical Corporation (Sinopec)
- 16.2.11.1. Overview
- 16.2.11.2. Products
- 16.2.11.3. SWOT Analysis
- 16.2.11.4. Recent Developments
- 16.2.11.5. Financials (Based on Availability)
- 16.2.12 Apcotex
- 16.2.12.1. Overview
- 16.2.12.2. Products
- 16.2.12.3. SWOT Analysis
- 16.2.12.4. Recent Developments
- 16.2.12.5. Financials (Based on Availability)
- 16.2.13 Lanxess
- 16.2.13.1. Overview
- 16.2.13.2. Products
- 16.2.13.3. SWOT Analysis
- 16.2.13.4. Recent Developments
- 16.2.13.5. Financials (Based on Availability)
- 16.2.14 TSRC
- 16.2.14.1. Overview
- 16.2.14.2. Products
- 16.2.14.3. SWOT Analysis
- 16.2.14.4. Recent Developments
- 16.2.14.5. Financials (Based on Availability)
- 16.2.1 Versalis S p A
List of Figures
- Figure 1: Global Nitrile Butadiene Rubber Industry Revenue Breakdown (Million, %) by Region 2024 & 2032
- Figure 2: Global Nitrile Butadiene Rubber Industry Volume Breakdown (K Tons, %) by Region 2024 & 2032
- Figure 3: North America Nitrile Butadiene Rubber Industry Revenue (Million), by Country 2024 & 2032
- Figure 4: North America Nitrile Butadiene Rubber Industry Volume (K Tons), by Country 2024 & 2032
- Figure 5: North America Nitrile Butadiene Rubber Industry Revenue Share (%), by Country 2024 & 2032
- Figure 6: North America Nitrile Butadiene Rubber Industry Volume Share (%), by Country 2024 & 2032
- Figure 7: Europe Nitrile Butadiene Rubber Industry Revenue (Million), by Country 2024 & 2032
- Figure 8: Europe Nitrile Butadiene Rubber Industry Volume (K Tons), by Country 2024 & 2032
- Figure 9: Europe Nitrile Butadiene Rubber Industry Revenue Share (%), by Country 2024 & 2032
- Figure 10: Europe Nitrile Butadiene Rubber Industry Volume Share (%), by Country 2024 & 2032
- Figure 11: Asia Pacific Nitrile Butadiene Rubber Industry Revenue (Million), by Country 2024 & 2032
- Figure 12: Asia Pacific Nitrile Butadiene Rubber Industry Volume (K Tons), by Country 2024 & 2032
- Figure 13: Asia Pacific Nitrile Butadiene Rubber Industry Revenue Share (%), by Country 2024 & 2032
- Figure 14: Asia Pacific Nitrile Butadiene Rubber Industry Volume Share (%), by Country 2024 & 2032
- Figure 15: South America Nitrile Butadiene Rubber Industry Revenue (Million), by Country 2024 & 2032
- Figure 16: South America Nitrile Butadiene Rubber Industry Volume (K Tons), by Country 2024 & 2032
- Figure 17: South America Nitrile Butadiene Rubber Industry Revenue Share (%), by Country 2024 & 2032
- Figure 18: South America Nitrile Butadiene Rubber Industry Volume Share (%), by Country 2024 & 2032
- Figure 19: MEA Nitrile Butadiene Rubber Industry Revenue (Million), by Country 2024 & 2032
- Figure 20: MEA Nitrile Butadiene Rubber Industry Volume (K Tons), by Country 2024 & 2032
- Figure 21: MEA Nitrile Butadiene Rubber Industry Revenue Share (%), by Country 2024 & 2032
- Figure 22: MEA Nitrile Butadiene Rubber Industry Volume Share (%), by Country 2024 & 2032
- Figure 23: Asia Pacific Nitrile Butadiene Rubber Industry Revenue (Million), by Application 2024 & 2032
- Figure 24: Asia Pacific Nitrile Butadiene Rubber Industry Volume (K Tons), by Application 2024 & 2032
- Figure 25: Asia Pacific Nitrile Butadiene Rubber Industry Revenue Share (%), by Application 2024 & 2032
- Figure 26: Asia Pacific Nitrile Butadiene Rubber Industry Volume Share (%), by Application 2024 & 2032
- Figure 27: Asia Pacific Nitrile Butadiene Rubber Industry Revenue (Million), by End-user Industry 2024 & 2032
- Figure 28: Asia Pacific Nitrile Butadiene Rubber Industry Volume (K Tons), by End-user Industry 2024 & 2032
- Figure 29: Asia Pacific Nitrile Butadiene Rubber Industry Revenue Share (%), by End-user Industry 2024 & 2032
- Figure 30: Asia Pacific Nitrile Butadiene Rubber Industry Volume Share (%), by End-user Industry 2024 & 2032
- Figure 31: Asia Pacific Nitrile Butadiene Rubber Industry Revenue (Million), by Country 2024 & 2032
- Figure 32: Asia Pacific Nitrile Butadiene Rubber Industry Volume (K Tons), by Country 2024 & 2032
- Figure 33: Asia Pacific Nitrile Butadiene Rubber Industry Revenue Share (%), by Country 2024 & 2032
- Figure 34: Asia Pacific Nitrile Butadiene Rubber Industry Volume Share (%), by Country 2024 & 2032
- Figure 35: North America Nitrile Butadiene Rubber Industry Revenue (Million), by Application 2024 & 2032
- Figure 36: North America Nitrile Butadiene Rubber Industry Volume (K Tons), by Application 2024 & 2032
- Figure 37: North America Nitrile Butadiene Rubber Industry Revenue Share (%), by Application 2024 & 2032
- Figure 38: North America Nitrile Butadiene Rubber Industry Volume Share (%), by Application 2024 & 2032
- Figure 39: North America Nitrile Butadiene Rubber Industry Revenue (Million), by End-user Industry 2024 & 2032
- Figure 40: North America Nitrile Butadiene Rubber Industry Volume (K Tons), by End-user Industry 2024 & 2032
- Figure 41: North America Nitrile Butadiene Rubber Industry Revenue Share (%), by End-user Industry 2024 & 2032
- Figure 42: North America Nitrile Butadiene Rubber Industry Volume Share (%), by End-user Industry 2024 & 2032
- Figure 43: North America Nitrile Butadiene Rubber Industry Revenue (Million), by Country 2024 & 2032
- Figure 44: North America Nitrile Butadiene Rubber Industry Volume (K Tons), by Country 2024 & 2032
- Figure 45: North America Nitrile Butadiene Rubber Industry Revenue Share (%), by Country 2024 & 2032
- Figure 46: North America Nitrile Butadiene Rubber Industry Volume Share (%), by Country 2024 & 2032
- Figure 47: Europe Nitrile Butadiene Rubber Industry Revenue (Million), by Application 2024 & 2032
- Figure 48: Europe Nitrile Butadiene Rubber Industry Volume (K Tons), by Application 2024 & 2032
- Figure 49: Europe Nitrile Butadiene Rubber Industry Revenue Share (%), by Application 2024 & 2032
- Figure 50: Europe Nitrile Butadiene Rubber Industry Volume Share (%), by Application 2024 & 2032
- Figure 51: Europe Nitrile Butadiene Rubber Industry Revenue (Million), by End-user Industry 2024 & 2032
- Figure 52: Europe Nitrile Butadiene Rubber Industry Volume (K Tons), by End-user Industry 2024 & 2032
- Figure 53: Europe Nitrile Butadiene Rubber Industry Revenue Share (%), by End-user Industry 2024 & 2032
- Figure 54: Europe Nitrile Butadiene Rubber Industry Volume Share (%), by End-user Industry 2024 & 2032
- Figure 55: Europe Nitrile Butadiene Rubber Industry Revenue (Million), by Country 2024 & 2032
- Figure 56: Europe Nitrile Butadiene Rubber Industry Volume (K Tons), by Country 2024 & 2032
- Figure 57: Europe Nitrile Butadiene Rubber Industry Revenue Share (%), by Country 2024 & 2032
- Figure 58: Europe Nitrile Butadiene Rubber Industry Volume Share (%), by Country 2024 & 2032
- Figure 59: South America Nitrile Butadiene Rubber Industry Revenue (Million), by Application 2024 & 2032
- Figure 60: South America Nitrile Butadiene Rubber Industry Volume (K Tons), by Application 2024 & 2032
- Figure 61: South America Nitrile Butadiene Rubber Industry Revenue Share (%), by Application 2024 & 2032
- Figure 62: South America Nitrile Butadiene Rubber Industry Volume Share (%), by Application 2024 & 2032
- Figure 63: South America Nitrile Butadiene Rubber Industry Revenue (Million), by End-user Industry 2024 & 2032
- Figure 64: South America Nitrile Butadiene Rubber Industry Volume (K Tons), by End-user Industry 2024 & 2032
- Figure 65: South America Nitrile Butadiene Rubber Industry Revenue Share (%), by End-user Industry 2024 & 2032
- Figure 66: South America Nitrile Butadiene Rubber Industry Volume Share (%), by End-user Industry 2024 & 2032
- Figure 67: South America Nitrile Butadiene Rubber Industry Revenue (Million), by Country 2024 & 2032
- Figure 68: South America Nitrile Butadiene Rubber Industry Volume (K Tons), by Country 2024 & 2032
- Figure 69: South America Nitrile Butadiene Rubber Industry Revenue Share (%), by Country 2024 & 2032
- Figure 70: South America Nitrile Butadiene Rubber Industry Volume Share (%), by Country 2024 & 2032
- Figure 71: Middle East and Africa Nitrile Butadiene Rubber Industry Revenue (Million), by Application 2024 & 2032
- Figure 72: Middle East and Africa Nitrile Butadiene Rubber Industry Volume (K Tons), by Application 2024 & 2032
- Figure 73: Middle East and Africa Nitrile Butadiene Rubber Industry Revenue Share (%), by Application 2024 & 2032
- Figure 74: Middle East and Africa Nitrile Butadiene Rubber Industry Volume Share (%), by Application 2024 & 2032
- Figure 75: Middle East and Africa Nitrile Butadiene Rubber Industry Revenue (Million), by End-user Industry 2024 & 2032
- Figure 76: Middle East and Africa Nitrile Butadiene Rubber Industry Volume (K Tons), by End-user Industry 2024 & 2032
- Figure 77: Middle East and Africa Nitrile Butadiene Rubber Industry Revenue Share (%), by End-user Industry 2024 & 2032
- Figure 78: Middle East and Africa Nitrile Butadiene Rubber Industry Volume Share (%), by End-user Industry 2024 & 2032
- Figure 79: Middle East and Africa Nitrile Butadiene Rubber Industry Revenue (Million), by Country 2024 & 2032
- Figure 80: Middle East and Africa Nitrile Butadiene Rubber Industry Volume (K Tons), by Country 2024 & 2032
- Figure 81: Middle East and Africa Nitrile Butadiene Rubber Industry Revenue Share (%), by Country 2024 & 2032
- Figure 82: Middle East and Africa Nitrile Butadiene Rubber Industry Volume Share (%), by Country 2024 & 2032
List of Tables
- Table 1: Global Nitrile Butadiene Rubber Industry Revenue Million Forecast, by Region 2019 & 2032
- Table 2: Global Nitrile Butadiene Rubber Industry Volume K Tons Forecast, by Region 2019 & 2032
- Table 3: Global Nitrile Butadiene Rubber Industry Revenue Million Forecast, by Application 2019 & 2032
- Table 4: Global Nitrile Butadiene Rubber Industry Volume K Tons Forecast, by Application 2019 & 2032
- Table 5: Global Nitrile Butadiene Rubber Industry Revenue Million Forecast, by End-user Industry 2019 & 2032
- Table 6: Global Nitrile Butadiene Rubber Industry Volume K Tons Forecast, by End-user Industry 2019 & 2032
- Table 7: Global Nitrile Butadiene Rubber Industry Revenue Million Forecast, by Region 2019 & 2032
- Table 8: Global Nitrile Butadiene Rubber Industry Volume K Tons Forecast, by Region 2019 & 2032
- Table 9: Global Nitrile Butadiene Rubber Industry Revenue Million Forecast, by Country 2019 & 2032
- Table 10: Global Nitrile Butadiene Rubber Industry Volume K Tons Forecast, by Country 2019 & 2032
- Table 11: United States Nitrile Butadiene Rubber Industry Revenue (Million) Forecast, by Application 2019 & 2032
- Table 12: United States Nitrile Butadiene Rubber Industry Volume (K Tons) Forecast, by Application 2019 & 2032
- Table 13: Canada Nitrile Butadiene Rubber Industry Revenue (Million) Forecast, by Application 2019 & 2032
- Table 14: Canada Nitrile Butadiene Rubber Industry Volume (K Tons) Forecast, by Application 2019 & 2032
- Table 15: Mexico Nitrile Butadiene Rubber Industry Revenue (Million) Forecast, by Application 2019 & 2032
- Table 16: Mexico Nitrile Butadiene Rubber Industry Volume (K Tons) Forecast, by Application 2019 & 2032
- Table 17: Global Nitrile Butadiene Rubber Industry Revenue Million Forecast, by Country 2019 & 2032
- Table 18: Global Nitrile Butadiene Rubber Industry Volume K Tons Forecast, by Country 2019 & 2032
- Table 19: Germany Nitrile Butadiene Rubber Industry Revenue (Million) Forecast, by Application 2019 & 2032
- Table 20: Germany Nitrile Butadiene Rubber Industry Volume (K Tons) Forecast, by Application 2019 & 2032
- Table 21: France Nitrile Butadiene Rubber Industry Revenue (Million) Forecast, by Application 2019 & 2032
- Table 22: France Nitrile Butadiene Rubber Industry Volume (K Tons) Forecast, by Application 2019 & 2032
- Table 23: Italy Nitrile Butadiene Rubber Industry Revenue (Million) Forecast, by Application 2019 & 2032
- Table 24: Italy Nitrile Butadiene Rubber Industry Volume (K Tons) Forecast, by Application 2019 & 2032
- Table 25: United Kingdom Nitrile Butadiene Rubber Industry Revenue (Million) Forecast, by Application 2019 & 2032
- Table 26: United Kingdom Nitrile Butadiene Rubber Industry Volume (K Tons) Forecast, by Application 2019 & 2032
- Table 27: Netherlands Nitrile Butadiene Rubber Industry Revenue (Million) Forecast, by Application 2019 & 2032
- Table 28: Netherlands Nitrile Butadiene Rubber Industry Volume (K Tons) Forecast, by Application 2019 & 2032
- Table 29: Rest of Europe Nitrile Butadiene Rubber Industry Revenue (Million) Forecast, by Application 2019 & 2032
- Table 30: Rest of Europe Nitrile Butadiene Rubber Industry Volume (K Tons) Forecast, by Application 2019 & 2032
- Table 31: Global Nitrile Butadiene Rubber Industry Revenue Million Forecast, by Country 2019 & 2032
- Table 32: Global Nitrile Butadiene Rubber Industry Volume K Tons Forecast, by Country 2019 & 2032
- Table 33: China Nitrile Butadiene Rubber Industry Revenue (Million) Forecast, by Application 2019 & 2032
- Table 34: China Nitrile Butadiene Rubber Industry Volume (K Tons) Forecast, by Application 2019 & 2032
- Table 35: Japan Nitrile Butadiene Rubber Industry Revenue (Million) Forecast, by Application 2019 & 2032
- Table 36: Japan Nitrile Butadiene Rubber Industry Volume (K Tons) Forecast, by Application 2019 & 2032
- Table 37: India Nitrile Butadiene Rubber Industry Revenue (Million) Forecast, by Application 2019 & 2032
- Table 38: India Nitrile Butadiene Rubber Industry Volume (K Tons) Forecast, by Application 2019 & 2032
- Table 39: South Korea Nitrile Butadiene Rubber Industry Revenue (Million) Forecast, by Application 2019 & 2032
- Table 40: South Korea Nitrile Butadiene Rubber Industry Volume (K Tons) Forecast, by Application 2019 & 2032
- Table 41: Taiwan Nitrile Butadiene Rubber Industry Revenue (Million) Forecast, by Application 2019 & 2032
- Table 42: Taiwan Nitrile Butadiene Rubber Industry Volume (K Tons) Forecast, by Application 2019 & 2032
- Table 43: Australia Nitrile Butadiene Rubber Industry Revenue (Million) Forecast, by Application 2019 & 2032
- Table 44: Australia Nitrile Butadiene Rubber Industry Volume (K Tons) Forecast, by Application 2019 & 2032
- Table 45: Rest of Asia-Pacific Nitrile Butadiene Rubber Industry Revenue (Million) Forecast, by Application 2019 & 2032
- Table 46: Rest of Asia-Pacific Nitrile Butadiene Rubber Industry Volume (K Tons) Forecast, by Application 2019 & 2032
- Table 47: Global Nitrile Butadiene Rubber Industry Revenue Million Forecast, by Country 2019 & 2032
- Table 48: Global Nitrile Butadiene Rubber Industry Volume K Tons Forecast, by Country 2019 & 2032
- Table 49: Brazil Nitrile Butadiene Rubber Industry Revenue (Million) Forecast, by Application 2019 & 2032
- Table 50: Brazil Nitrile Butadiene Rubber Industry Volume (K Tons) Forecast, by Application 2019 & 2032
- Table 51: Argentina Nitrile Butadiene Rubber Industry Revenue (Million) Forecast, by Application 2019 & 2032
- Table 52: Argentina Nitrile Butadiene Rubber Industry Volume (K Tons) Forecast, by Application 2019 & 2032
- Table 53: Rest of South America Nitrile Butadiene Rubber Industry Revenue (Million) Forecast, by Application 2019 & 2032
- Table 54: Rest of South America Nitrile Butadiene Rubber Industry Volume (K Tons) Forecast, by Application 2019 & 2032
- Table 55: Global Nitrile Butadiene Rubber Industry Revenue Million Forecast, by Country 2019 & 2032
- Table 56: Global Nitrile Butadiene Rubber Industry Volume K Tons Forecast, by Country 2019 & 2032
- Table 57: Middle East Nitrile Butadiene Rubber Industry Revenue (Million) Forecast, by Application 2019 & 2032
- Table 58: Middle East Nitrile Butadiene Rubber Industry Volume (K Tons) Forecast, by Application 2019 & 2032
- Table 59: Africa Nitrile Butadiene Rubber Industry Revenue (Million) Forecast, by Application 2019 & 2032
- Table 60: Africa Nitrile Butadiene Rubber Industry Volume (K Tons) Forecast, by Application 2019 & 2032
- Table 61: Global Nitrile Butadiene Rubber Industry Revenue Million Forecast, by Application 2019 & 2032
- Table 62: Global Nitrile Butadiene Rubber Industry Volume K Tons Forecast, by Application 2019 & 2032
- Table 63: Global Nitrile Butadiene Rubber Industry Revenue Million Forecast, by End-user Industry 2019 & 2032
- Table 64: Global Nitrile Butadiene Rubber Industry Volume K Tons Forecast, by End-user Industry 2019 & 2032
- Table 65: Global Nitrile Butadiene Rubber Industry Revenue Million Forecast, by Country 2019 & 2032
- Table 66: Global Nitrile Butadiene Rubber Industry Volume K Tons Forecast, by Country 2019 & 2032
- Table 67: China Nitrile Butadiene Rubber Industry Revenue (Million) Forecast, by Application 2019 & 2032
- Table 68: China Nitrile Butadiene Rubber Industry Volume (K Tons) Forecast, by Application 2019 & 2032
- Table 69: India Nitrile Butadiene Rubber Industry Revenue (Million) Forecast, by Application 2019 & 2032
- Table 70: India Nitrile Butadiene Rubber Industry Volume (K Tons) Forecast, by Application 2019 & 2032
- Table 71: Japan Nitrile Butadiene Rubber Industry Revenue (Million) Forecast, by Application 2019 & 2032
- Table 72: Japan Nitrile Butadiene Rubber Industry Volume (K Tons) Forecast, by Application 2019 & 2032
- Table 73: South Korea Nitrile Butadiene Rubber Industry Revenue (Million) Forecast, by Application 2019 & 2032
- Table 74: South Korea Nitrile Butadiene Rubber Industry Volume (K Tons) Forecast, by Application 2019 & 2032
- Table 75: Malaysia Nitrile Butadiene Rubber Industry Revenue (Million) Forecast, by Application 2019 & 2032
- Table 76: Malaysia Nitrile Butadiene Rubber Industry Volume (K Tons) Forecast, by Application 2019 & 2032
- Table 77: Thailand Nitrile Butadiene Rubber Industry Revenue (Million) Forecast, by Application 2019 & 2032
- Table 78: Thailand Nitrile Butadiene Rubber Industry Volume (K Tons) Forecast, by Application 2019 & 2032
- Table 79: Vietnam Nitrile Butadiene Rubber Industry Revenue (Million) Forecast, by Application 2019 & 2032
- Table 80: Vietnam Nitrile Butadiene Rubber Industry Volume (K Tons) Forecast, by Application 2019 & 2032
- Table 81: Indonesia Nitrile Butadiene Rubber Industry Revenue (Million) Forecast, by Application 2019 & 2032
- Table 82: Indonesia Nitrile Butadiene Rubber Industry Volume (K Tons) Forecast, by Application 2019 & 2032
- Table 83: Rest of Asia Pacific Nitrile Butadiene Rubber Industry Revenue (Million) Forecast, by Application 2019 & 2032
- Table 84: Rest of Asia Pacific Nitrile Butadiene Rubber Industry Volume (K Tons) Forecast, by Application 2019 & 2032
- Table 85: Global Nitrile Butadiene Rubber Industry Revenue Million Forecast, by Application 2019 & 2032
- Table 86: Global Nitrile Butadiene Rubber Industry Volume K Tons Forecast, by Application 2019 & 2032
- Table 87: Global Nitrile Butadiene Rubber Industry Revenue Million Forecast, by End-user Industry 2019 & 2032
- Table 88: Global Nitrile Butadiene Rubber Industry Volume K Tons Forecast, by End-user Industry 2019 & 2032
- Table 89: Global Nitrile Butadiene Rubber Industry Revenue Million Forecast, by Country 2019 & 2032
- Table 90: Global Nitrile Butadiene Rubber Industry Volume K Tons Forecast, by Country 2019 & 2032
- Table 91: United States Nitrile Butadiene Rubber Industry Revenue (Million) Forecast, by Application 2019 & 2032
- Table 92: United States Nitrile Butadiene Rubber Industry Volume (K Tons) Forecast, by Application 2019 & 2032
- Table 93: Canada Nitrile Butadiene Rubber Industry Revenue (Million) Forecast, by Application 2019 & 2032
- Table 94: Canada Nitrile Butadiene Rubber Industry Volume (K Tons) Forecast, by Application 2019 & 2032
- Table 95: Mexico Nitrile Butadiene Rubber Industry Revenue (Million) Forecast, by Application 2019 & 2032
- Table 96: Mexico Nitrile Butadiene Rubber Industry Volume (K Tons) Forecast, by Application 2019 & 2032
- Table 97: Global Nitrile Butadiene Rubber Industry Revenue Million Forecast, by Application 2019 & 2032
- Table 98: Global Nitrile Butadiene Rubber Industry Volume K Tons Forecast, by Application 2019 & 2032
- Table 99: Global Nitrile Butadiene Rubber Industry Revenue Million Forecast, by End-user Industry 2019 & 2032
- Table 100: Global Nitrile Butadiene Rubber Industry Volume K Tons Forecast, by End-user Industry 2019 & 2032
- Table 101: Global Nitrile Butadiene Rubber Industry Revenue Million Forecast, by Country 2019 & 2032
- Table 102: Global Nitrile Butadiene Rubber Industry Volume K Tons Forecast, by Country 2019 & 2032
- Table 103: Germany Nitrile Butadiene Rubber Industry Revenue (Million) Forecast, by Application 2019 & 2032
- Table 104: Germany Nitrile Butadiene Rubber Industry Volume (K Tons) Forecast, by Application 2019 & 2032
- Table 105: United Kingdom Nitrile Butadiene Rubber Industry Revenue (Million) Forecast, by Application 2019 & 2032
- Table 106: United Kingdom Nitrile Butadiene Rubber Industry Volume (K Tons) Forecast, by Application 2019 & 2032
- Table 107: Italy Nitrile Butadiene Rubber Industry Revenue (Million) Forecast, by Application 2019 & 2032
- Table 108: Italy Nitrile Butadiene Rubber Industry Volume (K Tons) Forecast, by Application 2019 & 2032
- Table 109: France Nitrile Butadiene Rubber Industry Revenue (Million) Forecast, by Application 2019 & 2032
- Table 110: France Nitrile Butadiene Rubber Industry Volume (K Tons) Forecast, by Application 2019 & 2032
- Table 111: Spain Nitrile Butadiene Rubber Industry Revenue (Million) Forecast, by Application 2019 & 2032
- Table 112: Spain Nitrile Butadiene Rubber Industry Volume (K Tons) Forecast, by Application 2019 & 2032
- Table 113: Turkey Nitrile Butadiene Rubber Industry Revenue (Million) Forecast, by Application 2019 & 2032
- Table 114: Turkey Nitrile Butadiene Rubber Industry Volume (K Tons) Forecast, by Application 2019 & 2032
- Table 115: Russia Nitrile Butadiene Rubber Industry Revenue (Million) Forecast, by Application 2019 & 2032
- Table 116: Russia Nitrile Butadiene Rubber Industry Volume (K Tons) Forecast, by Application 2019 & 2032
- Table 117: NORDIC Nitrile Butadiene Rubber Industry Revenue (Million) Forecast, by Application 2019 & 2032
- Table 118: NORDIC Nitrile Butadiene Rubber Industry Volume (K Tons) Forecast, by Application 2019 & 2032
- Table 119: Rest of Europe Nitrile Butadiene Rubber Industry Revenue (Million) Forecast, by Application 2019 & 2032
- Table 120: Rest of Europe Nitrile Butadiene Rubber Industry Volume (K Tons) Forecast, by Application 2019 & 2032
- Table 121: Global Nitrile Butadiene Rubber Industry Revenue Million Forecast, by Application 2019 & 2032
- Table 122: Global Nitrile Butadiene Rubber Industry Volume K Tons Forecast, by Application 2019 & 2032
- Table 123: Global Nitrile Butadiene Rubber Industry Revenue Million Forecast, by End-user Industry 2019 & 2032
- Table 124: Global Nitrile Butadiene Rubber Industry Volume K Tons Forecast, by End-user Industry 2019 & 2032
- Table 125: Global Nitrile Butadiene Rubber Industry Revenue Million Forecast, by Country 2019 & 2032
- Table 126: Global Nitrile Butadiene Rubber Industry Volume K Tons Forecast, by Country 2019 & 2032
- Table 127: Brazil Nitrile Butadiene Rubber Industry Revenue (Million) Forecast, by Application 2019 & 2032
- Table 128: Brazil Nitrile Butadiene Rubber Industry Volume (K Tons) Forecast, by Application 2019 & 2032
- Table 129: Argentina Nitrile Butadiene Rubber Industry Revenue (Million) Forecast, by Application 2019 & 2032
- Table 130: Argentina Nitrile Butadiene Rubber Industry Volume (K Tons) Forecast, by Application 2019 & 2032
- Table 131: Colombia Nitrile Butadiene Rubber Industry Revenue (Million) Forecast, by Application 2019 & 2032
- Table 132: Colombia Nitrile Butadiene Rubber Industry Volume (K Tons) Forecast, by Application 2019 & 2032
- Table 133: Rest of South America Nitrile Butadiene Rubber Industry Revenue (Million) Forecast, by Application 2019 & 2032
- Table 134: Rest of South America Nitrile Butadiene Rubber Industry Volume (K Tons) Forecast, by Application 2019 & 2032
- Table 135: Global Nitrile Butadiene Rubber Industry Revenue Million Forecast, by Application 2019 & 2032
- Table 136: Global Nitrile Butadiene Rubber Industry Volume K Tons Forecast, by Application 2019 & 2032
- Table 137: Global Nitrile Butadiene Rubber Industry Revenue Million Forecast, by End-user Industry 2019 & 2032
- Table 138: Global Nitrile Butadiene Rubber Industry Volume K Tons Forecast, by End-user Industry 2019 & 2032
- Table 139: Global Nitrile Butadiene Rubber Industry Revenue Million Forecast, by Country 2019 & 2032
- Table 140: Global Nitrile Butadiene Rubber Industry Volume K Tons Forecast, by Country 2019 & 2032
- Table 141: Saudi Arabia Nitrile Butadiene Rubber Industry Revenue (Million) Forecast, by Application 2019 & 2032
- Table 142: Saudi Arabia Nitrile Butadiene Rubber Industry Volume (K Tons) Forecast, by Application 2019 & 2032
- Table 143: South Africa Nitrile Butadiene Rubber Industry Revenue (Million) Forecast, by Application 2019 & 2032
- Table 144: South Africa Nitrile Butadiene Rubber Industry Volume (K Tons) Forecast, by Application 2019 & 2032
- Table 145: Nigeria Nitrile Butadiene Rubber Industry Revenue (Million) Forecast, by Application 2019 & 2032
- Table 146: Nigeria Nitrile Butadiene Rubber Industry Volume (K Tons) Forecast, by Application 2019 & 2032
- Table 147: Egypt Nitrile Butadiene Rubber Industry Revenue (Million) Forecast, by Application 2019 & 2032
- Table 148: Egypt Nitrile Butadiene Rubber Industry Volume (K Tons) Forecast, by Application 2019 & 2032
- Table 149: Qatar Nitrile Butadiene Rubber Industry Revenue (Million) Forecast, by Application 2019 & 2032
- Table 150: Qatar Nitrile Butadiene Rubber Industry Volume (K Tons) Forecast, by Application 2019 & 2032
- Table 151: UAE Nitrile Butadiene Rubber Industry Revenue (Million) Forecast, by Application 2019 & 2032
- Table 152: UAE Nitrile Butadiene Rubber Industry Volume (K Tons) Forecast, by Application 2019 & 2032
- Table 153: Rest of Middle East and Africa Nitrile Butadiene Rubber Industry Revenue (Million) Forecast, by Application 2019 & 2032
- Table 154: Rest of Middle East and Africa Nitrile Butadiene Rubber Industry Volume (K Tons) Forecast, by Application 2019 & 2032
Frequently Asked Questions
1. What is the projected Compound Annual Growth Rate (CAGR) of the Nitrile Butadiene Rubber Industry?
The projected CAGR is approximately 6.31%.
2. Which companies are prominent players in the Nitrile Butadiene Rubber Industry?
Key companies in the market include Versalis S p A, ARLANXEO, Synthos, ZEON CORPORATION*List Not Exhaustive, Dynasol Group, ENEOS Materials Corporation, KUMHO PETROCHEMICAL, SIBUR, Synthomer PLC, LG Chem, China Petrochemical Corporation (Sinopec), Apcotex, Lanxess, TSRC.
3. What are the main segments of the Nitrile Butadiene Rubber Industry?
The market segments include Application, End-user Industry.
4. Can you provide details about the market size?
The market size is estimated to be USD 2.51 Million as of 2022.
5. What are some drivers contributing to market growth?
Expanding Automotive Industry; Industrial and Infrastructure Development Projects.
6. What are the notable trends driving market growth?
Automotive and Transportation Sector Dominates the Market.
7. Are there any restraints impacting market growth?
Availability of Substitute Materials; Fluctuating Raw Material Prices.
8. Can you provide examples of recent developments in the market?
August 2022: Kumho Petrochemical will be KRW6,000 billion (~USD 5.10 billion) into existing and new businesses in the next five years. As part of the initiative, Kumho will invest KRW 3,300 billion (~USD 2.81 billion) in its core business areas, which include nitrile butadiene latex (NB latex) production and styrene solution butadiene rubber (SSBR) manufacturing.
9. What pricing options are available for accessing the report?
Pricing options include single-user, multi-user, and enterprise licenses priced at USD 4750, USD 5250, and USD 8750 respectively.
10. Is the market size provided in terms of value or volume?
The market size is provided in terms of value, measured in Million and volume, measured in K Tons.
11. Are there any specific market keywords associated with the report?
Yes, the market keyword associated with the report is "Nitrile Butadiene Rubber Industry," which aids in identifying and referencing the specific market segment covered.
12. How do I determine which pricing option suits my needs best?
The pricing options vary based on user requirements and access needs. Individual users may opt for single-user licenses, while businesses requiring broader access may choose multi-user or enterprise licenses for cost-effective access to the report.
13. Are there any additional resources or data provided in the Nitrile Butadiene Rubber Industry report?
While the report offers comprehensive insights, it's advisable to review the specific contents or supplementary materials provided to ascertain if additional resources or data are available.
14. How can I stay updated on further developments or reports in the Nitrile Butadiene Rubber Industry?
To stay informed about further developments, trends, and reports in the Nitrile Butadiene Rubber Industry, consider subscribing to industry newsletters, following relevant companies and organizations, or regularly checking reputable industry news sources and publications.
Methodology
Step 1 - Identification of Relevant Samples Size from Population Database


Step 2 - Approaches for Defining Global Market Size (Value, Volume* & Price*)

Note*: In applicable scenarios
Step 3 - Data Sources
Primary Research
- Web Analytics
- Survey Reports
- Research Institute
- Latest Research Reports
- Opinion Leaders
Secondary Research
- Annual Reports
- White Paper
- Latest Press Release
- Industry Association
- Paid Database
- Investor Presentations

Step 4 - Data Triangulation
Involves using different sources of information in order to increase the validity of a study
These sources are likely to be stakeholders in a program - participants, other researchers, program staff, other community members, and so on.
Then we put all data in single framework & apply various statistical tools to find out the dynamic on the market.
During the analysis stage, feedback from the stakeholder groups would be compared to determine areas of agreement as well as areas of divergence
