

Key Insights
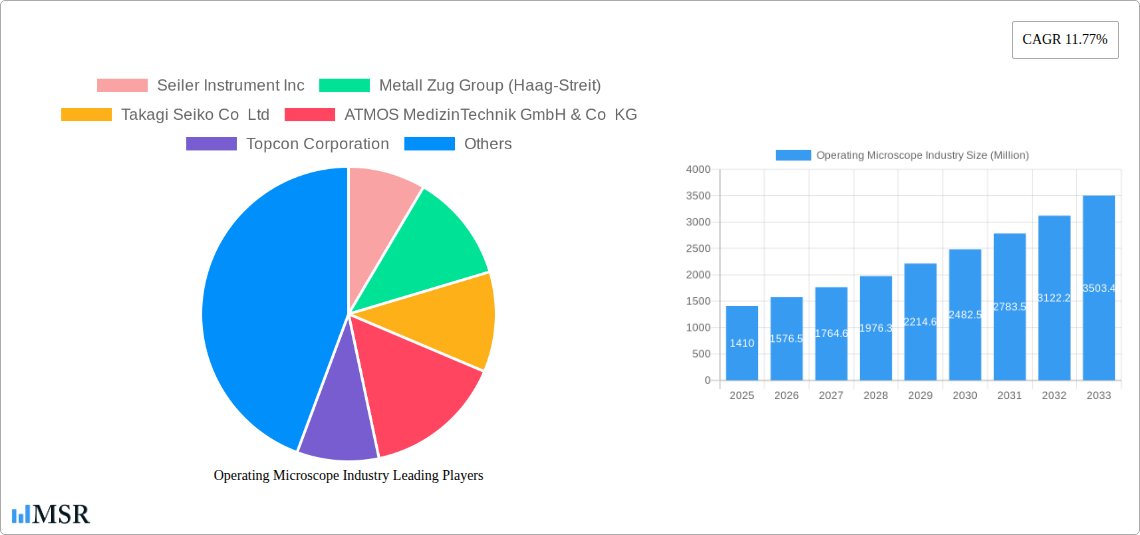
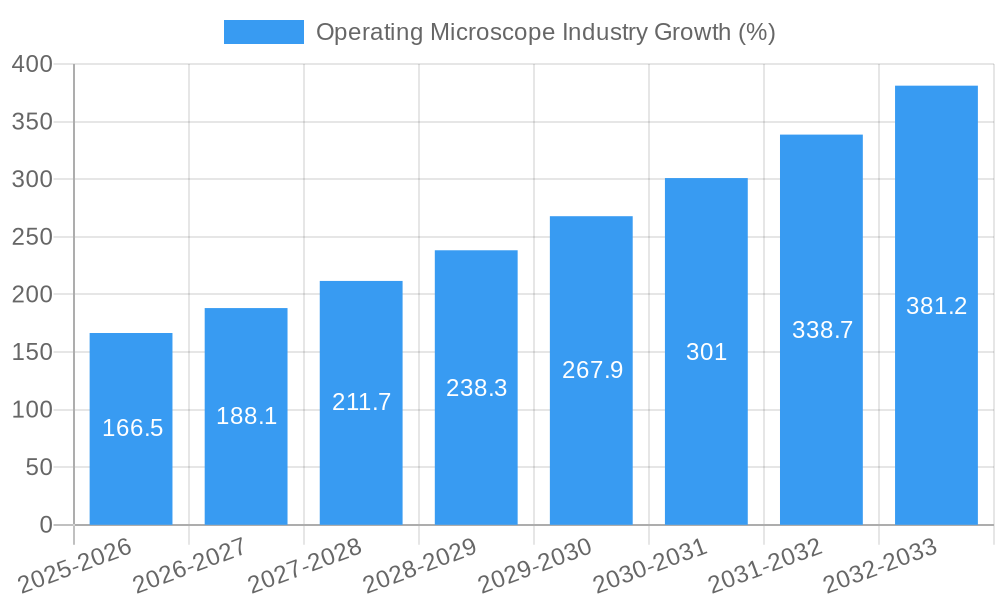
The global operating microscope market, valued at $1.41 billion in 2025, is projected to experience robust growth, driven by a compound annual growth rate (CAGR) of 11.77% from 2025 to 2033. This expansion is fueled by several key factors. Technological advancements, such as improved image quality, enhanced illumination, and integration with advanced imaging modalities like fluorescence microscopy, are significantly improving surgical precision and outcomes, thereby increasing adoption. The rising prevalence of complex surgical procedures across various specialties, including neurosurgery, ophthalmology, and ENT, is another major driver. Furthermore, the increasing demand for minimally invasive surgeries, which often necessitate the use of operating microscopes, contributes to market growth. Growth is also spurred by the expansion of healthcare infrastructure, particularly in emerging economies, coupled with rising disposable incomes and improved healthcare access. However, the high cost of advanced operating microscopes and the need for specialized training to operate them pose challenges to market penetration, particularly in resource-constrained settings. Nevertheless, the long-term outlook remains positive, given the sustained focus on improving surgical techniques and patient outcomes.
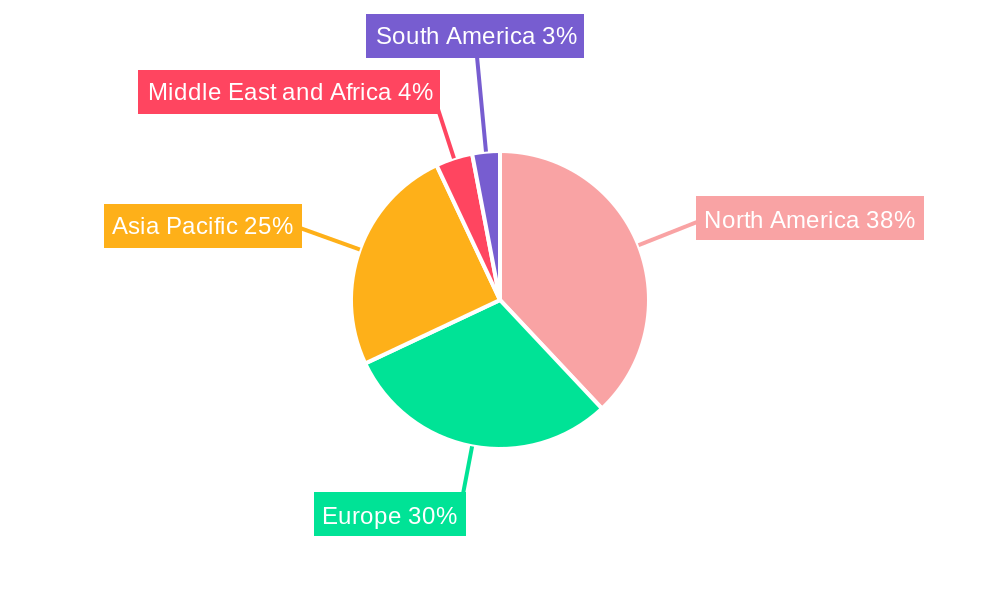
The market segmentation reveals a diverse landscape. Hospitals and ambulatory surgical centers represent the dominant end-users, reflecting the concentration of surgical procedures in these settings. Within applications, neurosurgery and spine surgery, ophthalmology, and ENT are significant segments, underscoring the crucial role of operating microscopes in these specialized fields. Leading companies like Danaher Corporation (Leica Microsystems), Carl Zeiss AG, and Olympus Corporation are actively shaping the market through innovation and strategic partnerships. Geographical analysis suggests North America and Europe currently hold significant market shares due to advanced healthcare infrastructure and higher adoption rates. However, the Asia-Pacific region is expected to demonstrate substantial growth over the forecast period, driven by rising healthcare expenditure and a growing middle class. This dynamic interplay of technological advancements, procedural trends, and regional variations ensures the operating microscope market remains a vibrant and promising sector within the global medical device industry.
Operating Microscope Industry Market Report: 2019-2033 Forecast
This comprehensive report provides an in-depth analysis of the global operating microscope market, offering invaluable insights for stakeholders across the medical device industry. Covering the period 2019-2033, with a base year of 2025, this report forecasts robust growth and identifies key opportunities for expansion. The report includes detailed market sizing, segmentation analysis, competitive landscape assessment, and future growth projections. Key players such as Leica Microsystems, Carl Zeiss AG, and Olympus Corporation are profiled, providing crucial intelligence for strategic decision-making.
Operating Microscope Industry Market Concentration & Dynamics
The global operating microscope market exhibits a moderately concentrated structure, with a handful of multinational corporations holding significant market share. The market share of the top five players is estimated at xx% in 2025. However, the presence of several smaller, specialized companies fosters innovation and competition. The industry is characterized by a dynamic innovation ecosystem, driven by ongoing technological advancements in image processing, visualization techniques, and surgical assistance functionalities.
Regulatory frameworks, primarily those concerning medical device approvals and safety standards (e.g., FDA approvals in the US and CE marking in Europe), play a crucial role in shaping market dynamics. Substitute products, while limited, include alternative surgical visualization methods, but operating microscopes remain essential for many precise procedures. End-user trends favor minimally invasive surgeries and advanced imaging, increasing the demand for sophisticated operating microscopes. The market has witnessed a moderate level of M&A activity in recent years, with approximately xx merger and acquisition deals recorded between 2019 and 2024, mainly focused on expanding product portfolios and geographic reach.
Operating Microscope Industry Industry Insights & Trends
The operating microscope market is experiencing substantial growth, projected at a Compound Annual Growth Rate (CAGR) of xx% during the forecast period (2025-2033). The market size in 2025 is estimated at $xx Million and is expected to reach $xx Million by 2033. This growth is driven by several key factors including the rising prevalence of chronic diseases necessitating surgical interventions, technological advancements leading to enhanced image quality and surgical precision, and the increasing adoption of minimally invasive surgical techniques. Furthermore, the growing demand for advanced surgical procedures in developing economies and the rising disposable incomes contribute significantly to market expansion. Technological disruptions, such as the integration of artificial intelligence (AI) and augmented reality (AR) technologies, are poised to revolutionize operating microscope capabilities in the coming years. Evolving consumer behaviors, such as the heightened focus on patient safety and improved surgical outcomes, are further shaping market demand for technologically advanced operating microscopes.
Key Markets & Segments Leading Operating Microscope Industry
Dominant Segments:
Region: North America currently holds the largest market share, driven by high healthcare expenditure, technological advancements, and a strong presence of key players. Europe follows as a significant market, exhibiting steady growth. The Asia-Pacific region is expected to witness the fastest growth rate in the coming years, fueled by rising healthcare infrastructure investments and increasing surgical procedures.
End User: Hospitals represent the largest segment of the operating microscope market, followed by ambulatory surgical centers.
Application: Ophthalmology and neurosurgery are major application areas, accounting for the largest market share, due to the critical need for high-precision visualization in these complex surgical procedures. Growth is expected across all application segments, with significant potential in plastic and reconstructive surgery.
Drivers:
- Economic Growth: Increased healthcare spending in developed and developing countries is directly correlated with market growth.
- Technological Advancements: Continuous innovation leads to improved image quality, precision, and functionality.
- Healthcare Infrastructure Development: Investments in modern hospitals and surgical facilities are crucial for market expansion.
- Growing Prevalence of Chronic Diseases: The rising number of patients requiring surgical interventions fuels demand.
Operating Microscope Industry Product Developments
Recent innovations in operating microscopes emphasize improved image quality, enhanced ergonomics, and integration with advanced imaging technologies. Features like 3D visualization, fluorescence imaging, and robotic integration are becoming increasingly prevalent. These advancements offer surgeons greater precision, improved visualization, and enhanced surgical outcomes, thus creating a competitive edge for manufacturers.
Challenges in the Operating Microscope Industry Market
The operating microscope market faces challenges such as stringent regulatory approvals, which can delay product launches and increase development costs. Supply chain disruptions can impact the availability of essential components, leading to production delays and cost increases. Intense competition among established players and the emergence of new entrants pose a significant challenge to maintaining profitability and market share. These factors combined can negatively impact market growth by an estimated xx% annually.
Forces Driving Operating Microscope Industry Growth
Technological advancements, particularly in areas such as image processing, 3D visualization, and AI integration, are major growth drivers. Economic growth in developing countries increases access to healthcare, resulting in higher demand. Favorable regulatory environments that facilitate innovation and product approvals further stimulate market expansion. For example, the increasing adoption of minimally invasive surgical techniques drives the need for advanced operating microscopes, contributing significantly to market growth.
Long-Term Growth Catalysts in the Operating Microscope Industry
Long-term growth will be driven by continuous innovation in microscope technology, creating advanced functionalities and enhanced user experience. Strategic partnerships between microscope manufacturers and surgical technology companies will integrate operating microscopes into broader surgical workflows. Expansion into new markets, especially in developing economies with rapidly improving healthcare infrastructure, presents significant growth potential.
Emerging Opportunities in Operating Microscope Industry
Emerging opportunities lie in the integration of AI and machine learning for real-time image analysis and surgical guidance. The increasing demand for minimally invasive procedures will create opportunities for specialized microscopes. Expanding into new geographical markets with growing healthcare investments represents a significant opportunity for market expansion. Personalized medicine and the development of specialized microscopes for specific surgical applications represent significant future growth opportunities.
Leading Players in the Operating Microscope Industry Sector
- Seiler Instrument Inc
- Metall Zug Group (Haag-Streit)
- Takagi Seiko Co Ltd
- ATMOS MedizinTechnik GmbH & Co KG
- Topcon Corporation
- Avante Health Solutions
- ARI Medical Technology Co Ltd
- Danaher Corporation (Leica Microsystems)
- Synaptive Medical
- Carl Zeiss AG
- Labomed Inc
- Alltion (Wuzhou) Co Ltd
- Alcon Inc
- Olympus Corporation
- Optofine Instruments Pvt Ltd
Key Milestones in Operating Microscope Industry Industry
- March 2023: The Joseph N France General Hospital acquired a Leica M690 Surgical Operating Microscope System, showcasing the adoption of advanced technology for enhanced surgical capabilities.
- January 2023: Leica Microsystems expanded its distribution network through an agreement with DB Surgical, Inc., increasing market reach in North Carolina and South Carolina.
Strategic Outlook for Operating Microscope Industry Market
The operating microscope market is poised for continued growth, driven by technological advancements, increasing surgical procedures, and expanding healthcare infrastructure. Strategic opportunities exist in developing innovative products, establishing strong distribution networks, and focusing on emerging markets. Companies that adapt to technological advancements and prioritize patient safety will be best positioned for success in this dynamic and growing market.
Operating Microscope Industry Segmentation
-
1. Application
- 1.1. Dentistry
- 1.2. Gynecology and Urology
- 1.3. Ear, Nose, and Throat (ENT)
- 1.4. Neurosurgery and Spine Surgery
- 1.5. Ophthalmology
- 1.6. Plastic and Reconstructive Surgery
- 1.7. Other Applications
-
2. End User
- 2.1. Hospitals
- 2.2. Ambulatory Surgical Centers
- 2.3. Other End Users
Operating Microscope Industry Segmentation By Geography
-
1. North America
- 1.1. United States
- 1.2. Canada
- 1.3. Mexico
-
2. Europe
- 2.1. Germany
- 2.2. United Kingdom
- 2.3. France
- 2.4. Italy
- 2.5. Spain
- 2.6. Rest of Europe
-
3. Asia Pacific
- 3.1. China
- 3.2. Japan
- 3.3. India
- 3.4. Australia
- 3.5. South Korea
- 3.6. Rest of Asia Pacific
-
4. Middle East and Africa
- 4.1. GCC
- 4.2. South Africa
- 4.3. Rest of Middle East and Africa
-
5. South America
- 5.1. Brazil
- 5.2. Argentina
- 5.3. Rest of South America
Operating Microscope Industry REPORT HIGHLIGHTS
| Aspects | Details |
|---|---|
| Study Period | 2019-2033 |
| Base Year | 2024 |
| Estimated Year | 2025 |
| Forecast Period | 2025-2033 |
| Historical Period | 2019-2024 |
| Growth Rate | CAGR of 11.77% from 2019-2033 |
| Segmentation |
|
Table of Contents
- 1. Introduction
- 1.1. Research Scope
- 1.2. Market Segmentation
- 1.3. Research Methodology
- 1.4. Definitions and Assumptions
- 2. Executive Summary
- 2.1. Introduction
- 3. Market Dynamics
- 3.1. Introduction
- 3.2. Market Drivers
- 3.2.1. Increasing Adoption of Minimally Invasive Surgeries; Rising Geriatric Population and Burden of Chronic Diseases; Technological Advancements in Surgical Microscopes
- 3.3. Market Restrains
- 3.3.1. Lack of Skilled Professionals; Low Acceptance Owing to High Costs
- 3.4. Market Trends
- 3.4.1. Ophthalmology Segment is Expected to Hold a Largest Share in the Market Over the Forecast Period
- 4. Market Factor Analysis
- 4.1. Porters Five Forces
- 4.2. Supply/Value Chain
- 4.3. PESTEL analysis
- 4.4. Market Entropy
- 4.5. Patent/Trademark Analysis
- 5. Global Operating Microscope Industry Analysis, Insights and Forecast, 2019-2031
- 5.1. Market Analysis, Insights and Forecast - by Application
- 5.1.1. Dentistry
- 5.1.2. Gynecology and Urology
- 5.1.3. Ear, Nose, and Throat (ENT)
- 5.1.4. Neurosurgery and Spine Surgery
- 5.1.5. Ophthalmology
- 5.1.6. Plastic and Reconstructive Surgery
- 5.1.7. Other Applications
- 5.2. Market Analysis, Insights and Forecast - by End User
- 5.2.1. Hospitals
- 5.2.2. Ambulatory Surgical Centers
- 5.2.3. Other End Users
- 5.3. Market Analysis, Insights and Forecast - by Region
- 5.3.1. North America
- 5.3.2. Europe
- 5.3.3. Asia Pacific
- 5.3.4. Middle East and Africa
- 5.3.5. South America
- 5.1. Market Analysis, Insights and Forecast - by Application
- 6. North America Operating Microscope Industry Analysis, Insights and Forecast, 2019-2031
- 6.1. Market Analysis, Insights and Forecast - by Application
- 6.1.1. Dentistry
- 6.1.2. Gynecology and Urology
- 6.1.3. Ear, Nose, and Throat (ENT)
- 6.1.4. Neurosurgery and Spine Surgery
- 6.1.5. Ophthalmology
- 6.1.6. Plastic and Reconstructive Surgery
- 6.1.7. Other Applications
- 6.2. Market Analysis, Insights and Forecast - by End User
- 6.2.1. Hospitals
- 6.2.2. Ambulatory Surgical Centers
- 6.2.3. Other End Users
- 6.1. Market Analysis, Insights and Forecast - by Application
- 7. Europe Operating Microscope Industry Analysis, Insights and Forecast, 2019-2031
- 7.1. Market Analysis, Insights and Forecast - by Application
- 7.1.1. Dentistry
- 7.1.2. Gynecology and Urology
- 7.1.3. Ear, Nose, and Throat (ENT)
- 7.1.4. Neurosurgery and Spine Surgery
- 7.1.5. Ophthalmology
- 7.1.6. Plastic and Reconstructive Surgery
- 7.1.7. Other Applications
- 7.2. Market Analysis, Insights and Forecast - by End User
- 7.2.1. Hospitals
- 7.2.2. Ambulatory Surgical Centers
- 7.2.3. Other End Users
- 7.1. Market Analysis, Insights and Forecast - by Application
- 8. Asia Pacific Operating Microscope Industry Analysis, Insights and Forecast, 2019-2031
- 8.1. Market Analysis, Insights and Forecast - by Application
- 8.1.1. Dentistry
- 8.1.2. Gynecology and Urology
- 8.1.3. Ear, Nose, and Throat (ENT)
- 8.1.4. Neurosurgery and Spine Surgery
- 8.1.5. Ophthalmology
- 8.1.6. Plastic and Reconstructive Surgery
- 8.1.7. Other Applications
- 8.2. Market Analysis, Insights and Forecast - by End User
- 8.2.1. Hospitals
- 8.2.2. Ambulatory Surgical Centers
- 8.2.3. Other End Users
- 8.1. Market Analysis, Insights and Forecast - by Application
- 9. Middle East and Africa Operating Microscope Industry Analysis, Insights and Forecast, 2019-2031
- 9.1. Market Analysis, Insights and Forecast - by Application
- 9.1.1. Dentistry
- 9.1.2. Gynecology and Urology
- 9.1.3. Ear, Nose, and Throat (ENT)
- 9.1.4. Neurosurgery and Spine Surgery
- 9.1.5. Ophthalmology
- 9.1.6. Plastic and Reconstructive Surgery
- 9.1.7. Other Applications
- 9.2. Market Analysis, Insights and Forecast - by End User
- 9.2.1. Hospitals
- 9.2.2. Ambulatory Surgical Centers
- 9.2.3. Other End Users
- 9.1. Market Analysis, Insights and Forecast - by Application
- 10. South America Operating Microscope Industry Analysis, Insights and Forecast, 2019-2031
- 10.1. Market Analysis, Insights and Forecast - by Application
- 10.1.1. Dentistry
- 10.1.2. Gynecology and Urology
- 10.1.3. Ear, Nose, and Throat (ENT)
- 10.1.4. Neurosurgery and Spine Surgery
- 10.1.5. Ophthalmology
- 10.1.6. Plastic and Reconstructive Surgery
- 10.1.7. Other Applications
- 10.2. Market Analysis, Insights and Forecast - by End User
- 10.2.1. Hospitals
- 10.2.2. Ambulatory Surgical Centers
- 10.2.3. Other End Users
- 10.1. Market Analysis, Insights and Forecast - by Application
- 11. North America Operating Microscope Industry Analysis, Insights and Forecast, 2019-2031
- 11.1. Market Analysis, Insights and Forecast - By Country/Sub-region
- 11.1.1. undefined
- 12. Europe Operating Microscope Industry Analysis, Insights and Forecast, 2019-2031
- 12.1. Market Analysis, Insights and Forecast - By Country/Sub-region
- 12.1.1. undefined
- 13. Asia Pacific Operating Microscope Industry Analysis, Insights and Forecast, 2019-2031
- 13.1. Market Analysis, Insights and Forecast - By Country/Sub-region
- 13.1.1. undefined
- 14. Middle East and Africa Operating Microscope Industry Analysis, Insights and Forecast, 2019-2031
- 14.1. Market Analysis, Insights and Forecast - By Country/Sub-region
- 14.1.1. undefined
- 15. South America Operating Microscope Industry Analysis, Insights and Forecast, 2019-2031
- 15.1. Market Analysis, Insights and Forecast - By Country/Sub-region
- 15.1.1. undefined
- 16. Competitive Analysis
- 16.1. Global Market Share Analysis 2024
- 16.2. Company Profiles
- 16.2.1 Seiler Instrument Inc
- 16.2.1.1. Overview
- 16.2.1.2. Products
- 16.2.1.3. SWOT Analysis
- 16.2.1.4. Recent Developments
- 16.2.1.5. Financials (Based on Availability)
- 16.2.2 Metall Zug Group (Haag-Streit)
- 16.2.2.1. Overview
- 16.2.2.2. Products
- 16.2.2.3. SWOT Analysis
- 16.2.2.4. Recent Developments
- 16.2.2.5. Financials (Based on Availability)
- 16.2.3 Takagi Seiko Co Ltd
- 16.2.3.1. Overview
- 16.2.3.2. Products
- 16.2.3.3. SWOT Analysis
- 16.2.3.4. Recent Developments
- 16.2.3.5. Financials (Based on Availability)
- 16.2.4 ATMOS MedizinTechnik GmbH & Co KG
- 16.2.4.1. Overview
- 16.2.4.2. Products
- 16.2.4.3. SWOT Analysis
- 16.2.4.4. Recent Developments
- 16.2.4.5. Financials (Based on Availability)
- 16.2.5 Topcon Corporation
- 16.2.5.1. Overview
- 16.2.5.2. Products
- 16.2.5.3. SWOT Analysis
- 16.2.5.4. Recent Developments
- 16.2.5.5. Financials (Based on Availability)
- 16.2.6 Avante Health Solutions
- 16.2.6.1. Overview
- 16.2.6.2. Products
- 16.2.6.3. SWOT Analysis
- 16.2.6.4. Recent Developments
- 16.2.6.5. Financials (Based on Availability)
- 16.2.7 ARI Medical Technology Co Ltd
- 16.2.7.1. Overview
- 16.2.7.2. Products
- 16.2.7.3. SWOT Analysis
- 16.2.7.4. Recent Developments
- 16.2.7.5. Financials (Based on Availability)
- 16.2.8 Danaher Corporation (Leica Microsystems)
- 16.2.8.1. Overview
- 16.2.8.2. Products
- 16.2.8.3. SWOT Analysis
- 16.2.8.4. Recent Developments
- 16.2.8.5. Financials (Based on Availability)
- 16.2.9 Synaptive Medical
- 16.2.9.1. Overview
- 16.2.9.2. Products
- 16.2.9.3. SWOT Analysis
- 16.2.9.4. Recent Developments
- 16.2.9.5. Financials (Based on Availability)
- 16.2.10 Carl Zeiss AG
- 16.2.10.1. Overview
- 16.2.10.2. Products
- 16.2.10.3. SWOT Analysis
- 16.2.10.4. Recent Developments
- 16.2.10.5. Financials (Based on Availability)
- 16.2.11 Labomed Inc
- 16.2.11.1. Overview
- 16.2.11.2. Products
- 16.2.11.3. SWOT Analysis
- 16.2.11.4. Recent Developments
- 16.2.11.5. Financials (Based on Availability)
- 16.2.12 Alltion (Wuzhou) Co Ltd
- 16.2.12.1. Overview
- 16.2.12.2. Products
- 16.2.12.3. SWOT Analysis
- 16.2.12.4. Recent Developments
- 16.2.12.5. Financials (Based on Availability)
- 16.2.13 Alcon Inc
- 16.2.13.1. Overview
- 16.2.13.2. Products
- 16.2.13.3. SWOT Analysis
- 16.2.13.4. Recent Developments
- 16.2.13.5. Financials (Based on Availability)
- 16.2.14 Olympus Corporation
- 16.2.14.1. Overview
- 16.2.14.2. Products
- 16.2.14.3. SWOT Analysis
- 16.2.14.4. Recent Developments
- 16.2.14.5. Financials (Based on Availability)
- 16.2.15 Optofine Instruments Pvt Ltd
- 16.2.15.1. Overview
- 16.2.15.2. Products
- 16.2.15.3. SWOT Analysis
- 16.2.15.4. Recent Developments
- 16.2.15.5. Financials (Based on Availability)
- 16.2.1 Seiler Instrument Inc
List of Figures
- Figure 1: Global Operating Microscope Industry Revenue Breakdown (Million, %) by Region 2024 & 2032
- Figure 2: Global Operating Microscope Industry Volume Breakdown (K Unit, %) by Region 2024 & 2032
- Figure 3: North America Operating Microscope Industry Revenue (Million), by Country 2024 & 2032
- Figure 4: North America Operating Microscope Industry Volume (K Unit), by Country 2024 & 2032
- Figure 5: North America Operating Microscope Industry Revenue Share (%), by Country 2024 & 2032
- Figure 6: North America Operating Microscope Industry Volume Share (%), by Country 2024 & 2032
- Figure 7: Europe Operating Microscope Industry Revenue (Million), by Country 2024 & 2032
- Figure 8: Europe Operating Microscope Industry Volume (K Unit), by Country 2024 & 2032
- Figure 9: Europe Operating Microscope Industry Revenue Share (%), by Country 2024 & 2032
- Figure 10: Europe Operating Microscope Industry Volume Share (%), by Country 2024 & 2032
- Figure 11: Asia Pacific Operating Microscope Industry Revenue (Million), by Country 2024 & 2032
- Figure 12: Asia Pacific Operating Microscope Industry Volume (K Unit), by Country 2024 & 2032
- Figure 13: Asia Pacific Operating Microscope Industry Revenue Share (%), by Country 2024 & 2032
- Figure 14: Asia Pacific Operating Microscope Industry Volume Share (%), by Country 2024 & 2032
- Figure 15: Middle East and Africa Operating Microscope Industry Revenue (Million), by Country 2024 & 2032
- Figure 16: Middle East and Africa Operating Microscope Industry Volume (K Unit), by Country 2024 & 2032
- Figure 17: Middle East and Africa Operating Microscope Industry Revenue Share (%), by Country 2024 & 2032
- Figure 18: Middle East and Africa Operating Microscope Industry Volume Share (%), by Country 2024 & 2032
- Figure 19: South America Operating Microscope Industry Revenue (Million), by Country 2024 & 2032
- Figure 20: South America Operating Microscope Industry Volume (K Unit), by Country 2024 & 2032
- Figure 21: South America Operating Microscope Industry Revenue Share (%), by Country 2024 & 2032
- Figure 22: South America Operating Microscope Industry Volume Share (%), by Country 2024 & 2032
- Figure 23: North America Operating Microscope Industry Revenue (Million), by Application 2024 & 2032
- Figure 24: North America Operating Microscope Industry Volume (K Unit), by Application 2024 & 2032
- Figure 25: North America Operating Microscope Industry Revenue Share (%), by Application 2024 & 2032
- Figure 26: North America Operating Microscope Industry Volume Share (%), by Application 2024 & 2032
- Figure 27: North America Operating Microscope Industry Revenue (Million), by End User 2024 & 2032
- Figure 28: North America Operating Microscope Industry Volume (K Unit), by End User 2024 & 2032
- Figure 29: North America Operating Microscope Industry Revenue Share (%), by End User 2024 & 2032
- Figure 30: North America Operating Microscope Industry Volume Share (%), by End User 2024 & 2032
- Figure 31: North America Operating Microscope Industry Revenue (Million), by Country 2024 & 2032
- Figure 32: North America Operating Microscope Industry Volume (K Unit), by Country 2024 & 2032
- Figure 33: North America Operating Microscope Industry Revenue Share (%), by Country 2024 & 2032
- Figure 34: North America Operating Microscope Industry Volume Share (%), by Country 2024 & 2032
- Figure 35: Europe Operating Microscope Industry Revenue (Million), by Application 2024 & 2032
- Figure 36: Europe Operating Microscope Industry Volume (K Unit), by Application 2024 & 2032
- Figure 37: Europe Operating Microscope Industry Revenue Share (%), by Application 2024 & 2032
- Figure 38: Europe Operating Microscope Industry Volume Share (%), by Application 2024 & 2032
- Figure 39: Europe Operating Microscope Industry Revenue (Million), by End User 2024 & 2032
- Figure 40: Europe Operating Microscope Industry Volume (K Unit), by End User 2024 & 2032
- Figure 41: Europe Operating Microscope Industry Revenue Share (%), by End User 2024 & 2032
- Figure 42: Europe Operating Microscope Industry Volume Share (%), by End User 2024 & 2032
- Figure 43: Europe Operating Microscope Industry Revenue (Million), by Country 2024 & 2032
- Figure 44: Europe Operating Microscope Industry Volume (K Unit), by Country 2024 & 2032
- Figure 45: Europe Operating Microscope Industry Revenue Share (%), by Country 2024 & 2032
- Figure 46: Europe Operating Microscope Industry Volume Share (%), by Country 2024 & 2032
- Figure 47: Asia Pacific Operating Microscope Industry Revenue (Million), by Application 2024 & 2032
- Figure 48: Asia Pacific Operating Microscope Industry Volume (K Unit), by Application 2024 & 2032
- Figure 49: Asia Pacific Operating Microscope Industry Revenue Share (%), by Application 2024 & 2032
- Figure 50: Asia Pacific Operating Microscope Industry Volume Share (%), by Application 2024 & 2032
- Figure 51: Asia Pacific Operating Microscope Industry Revenue (Million), by End User 2024 & 2032
- Figure 52: Asia Pacific Operating Microscope Industry Volume (K Unit), by End User 2024 & 2032
- Figure 53: Asia Pacific Operating Microscope Industry Revenue Share (%), by End User 2024 & 2032
- Figure 54: Asia Pacific Operating Microscope Industry Volume Share (%), by End User 2024 & 2032
- Figure 55: Asia Pacific Operating Microscope Industry Revenue (Million), by Country 2024 & 2032
- Figure 56: Asia Pacific Operating Microscope Industry Volume (K Unit), by Country 2024 & 2032
- Figure 57: Asia Pacific Operating Microscope Industry Revenue Share (%), by Country 2024 & 2032
- Figure 58: Asia Pacific Operating Microscope Industry Volume Share (%), by Country 2024 & 2032
- Figure 59: Middle East and Africa Operating Microscope Industry Revenue (Million), by Application 2024 & 2032
- Figure 60: Middle East and Africa Operating Microscope Industry Volume (K Unit), by Application 2024 & 2032
- Figure 61: Middle East and Africa Operating Microscope Industry Revenue Share (%), by Application 2024 & 2032
- Figure 62: Middle East and Africa Operating Microscope Industry Volume Share (%), by Application 2024 & 2032
- Figure 63: Middle East and Africa Operating Microscope Industry Revenue (Million), by End User 2024 & 2032
- Figure 64: Middle East and Africa Operating Microscope Industry Volume (K Unit), by End User 2024 & 2032
- Figure 65: Middle East and Africa Operating Microscope Industry Revenue Share (%), by End User 2024 & 2032
- Figure 66: Middle East and Africa Operating Microscope Industry Volume Share (%), by End User 2024 & 2032
- Figure 67: Middle East and Africa Operating Microscope Industry Revenue (Million), by Country 2024 & 2032
- Figure 68: Middle East and Africa Operating Microscope Industry Volume (K Unit), by Country 2024 & 2032
- Figure 69: Middle East and Africa Operating Microscope Industry Revenue Share (%), by Country 2024 & 2032
- Figure 70: Middle East and Africa Operating Microscope Industry Volume Share (%), by Country 2024 & 2032
- Figure 71: South America Operating Microscope Industry Revenue (Million), by Application 2024 & 2032
- Figure 72: South America Operating Microscope Industry Volume (K Unit), by Application 2024 & 2032
- Figure 73: South America Operating Microscope Industry Revenue Share (%), by Application 2024 & 2032
- Figure 74: South America Operating Microscope Industry Volume Share (%), by Application 2024 & 2032
- Figure 75: South America Operating Microscope Industry Revenue (Million), by End User 2024 & 2032
- Figure 76: South America Operating Microscope Industry Volume (K Unit), by End User 2024 & 2032
- Figure 77: South America Operating Microscope Industry Revenue Share (%), by End User 2024 & 2032
- Figure 78: South America Operating Microscope Industry Volume Share (%), by End User 2024 & 2032
- Figure 79: South America Operating Microscope Industry Revenue (Million), by Country 2024 & 2032
- Figure 80: South America Operating Microscope Industry Volume (K Unit), by Country 2024 & 2032
- Figure 81: South America Operating Microscope Industry Revenue Share (%), by Country 2024 & 2032
- Figure 82: South America Operating Microscope Industry Volume Share (%), by Country 2024 & 2032
List of Tables
- Table 1: Global Operating Microscope Industry Revenue Million Forecast, by Region 2019 & 2032
- Table 2: Global Operating Microscope Industry Volume K Unit Forecast, by Region 2019 & 2032
- Table 3: Global Operating Microscope Industry Revenue Million Forecast, by Application 2019 & 2032
- Table 4: Global Operating Microscope Industry Volume K Unit Forecast, by Application 2019 & 2032
- Table 5: Global Operating Microscope Industry Revenue Million Forecast, by End User 2019 & 2032
- Table 6: Global Operating Microscope Industry Volume K Unit Forecast, by End User 2019 & 2032
- Table 7: Global Operating Microscope Industry Revenue Million Forecast, by Region 2019 & 2032
- Table 8: Global Operating Microscope Industry Volume K Unit Forecast, by Region 2019 & 2032
- Table 9: Global Operating Microscope Industry Revenue Million Forecast, by Country 2019 & 2032
- Table 10: Global Operating Microscope Industry Volume K Unit Forecast, by Country 2019 & 2032
- Table 11: Global Operating Microscope Industry Revenue Million Forecast, by Country 2019 & 2032
- Table 12: Global Operating Microscope Industry Volume K Unit Forecast, by Country 2019 & 2032
- Table 13: Global Operating Microscope Industry Revenue Million Forecast, by Country 2019 & 2032
- Table 14: Global Operating Microscope Industry Volume K Unit Forecast, by Country 2019 & 2032
- Table 15: Global Operating Microscope Industry Revenue Million Forecast, by Country 2019 & 2032
- Table 16: Global Operating Microscope Industry Volume K Unit Forecast, by Country 2019 & 2032
- Table 17: Global Operating Microscope Industry Revenue Million Forecast, by Country 2019 & 2032
- Table 18: Global Operating Microscope Industry Volume K Unit Forecast, by Country 2019 & 2032
- Table 19: Global Operating Microscope Industry Revenue Million Forecast, by Application 2019 & 2032
- Table 20: Global Operating Microscope Industry Volume K Unit Forecast, by Application 2019 & 2032
- Table 21: Global Operating Microscope Industry Revenue Million Forecast, by End User 2019 & 2032
- Table 22: Global Operating Microscope Industry Volume K Unit Forecast, by End User 2019 & 2032
- Table 23: Global Operating Microscope Industry Revenue Million Forecast, by Country 2019 & 2032
- Table 24: Global Operating Microscope Industry Volume K Unit Forecast, by Country 2019 & 2032
- Table 25: United States Operating Microscope Industry Revenue (Million) Forecast, by Application 2019 & 2032
- Table 26: United States Operating Microscope Industry Volume (K Unit) Forecast, by Application 2019 & 2032
- Table 27: Canada Operating Microscope Industry Revenue (Million) Forecast, by Application 2019 & 2032
- Table 28: Canada Operating Microscope Industry Volume (K Unit) Forecast, by Application 2019 & 2032
- Table 29: Mexico Operating Microscope Industry Revenue (Million) Forecast, by Application 2019 & 2032
- Table 30: Mexico Operating Microscope Industry Volume (K Unit) Forecast, by Application 2019 & 2032
- Table 31: Global Operating Microscope Industry Revenue Million Forecast, by Application 2019 & 2032
- Table 32: Global Operating Microscope Industry Volume K Unit Forecast, by Application 2019 & 2032
- Table 33: Global Operating Microscope Industry Revenue Million Forecast, by End User 2019 & 2032
- Table 34: Global Operating Microscope Industry Volume K Unit Forecast, by End User 2019 & 2032
- Table 35: Global Operating Microscope Industry Revenue Million Forecast, by Country 2019 & 2032
- Table 36: Global Operating Microscope Industry Volume K Unit Forecast, by Country 2019 & 2032
- Table 37: Germany Operating Microscope Industry Revenue (Million) Forecast, by Application 2019 & 2032
- Table 38: Germany Operating Microscope Industry Volume (K Unit) Forecast, by Application 2019 & 2032
- Table 39: United Kingdom Operating Microscope Industry Revenue (Million) Forecast, by Application 2019 & 2032
- Table 40: United Kingdom Operating Microscope Industry Volume (K Unit) Forecast, by Application 2019 & 2032
- Table 41: France Operating Microscope Industry Revenue (Million) Forecast, by Application 2019 & 2032
- Table 42: France Operating Microscope Industry Volume (K Unit) Forecast, by Application 2019 & 2032
- Table 43: Italy Operating Microscope Industry Revenue (Million) Forecast, by Application 2019 & 2032
- Table 44: Italy Operating Microscope Industry Volume (K Unit) Forecast, by Application 2019 & 2032
- Table 45: Spain Operating Microscope Industry Revenue (Million) Forecast, by Application 2019 & 2032
- Table 46: Spain Operating Microscope Industry Volume (K Unit) Forecast, by Application 2019 & 2032
- Table 47: Rest of Europe Operating Microscope Industry Revenue (Million) Forecast, by Application 2019 & 2032
- Table 48: Rest of Europe Operating Microscope Industry Volume (K Unit) Forecast, by Application 2019 & 2032
- Table 49: Global Operating Microscope Industry Revenue Million Forecast, by Application 2019 & 2032
- Table 50: Global Operating Microscope Industry Volume K Unit Forecast, by Application 2019 & 2032
- Table 51: Global Operating Microscope Industry Revenue Million Forecast, by End User 2019 & 2032
- Table 52: Global Operating Microscope Industry Volume K Unit Forecast, by End User 2019 & 2032
- Table 53: Global Operating Microscope Industry Revenue Million Forecast, by Country 2019 & 2032
- Table 54: Global Operating Microscope Industry Volume K Unit Forecast, by Country 2019 & 2032
- Table 55: China Operating Microscope Industry Revenue (Million) Forecast, by Application 2019 & 2032
- Table 56: China Operating Microscope Industry Volume (K Unit) Forecast, by Application 2019 & 2032
- Table 57: Japan Operating Microscope Industry Revenue (Million) Forecast, by Application 2019 & 2032
- Table 58: Japan Operating Microscope Industry Volume (K Unit) Forecast, by Application 2019 & 2032
- Table 59: India Operating Microscope Industry Revenue (Million) Forecast, by Application 2019 & 2032
- Table 60: India Operating Microscope Industry Volume (K Unit) Forecast, by Application 2019 & 2032
- Table 61: Australia Operating Microscope Industry Revenue (Million) Forecast, by Application 2019 & 2032
- Table 62: Australia Operating Microscope Industry Volume (K Unit) Forecast, by Application 2019 & 2032
- Table 63: South Korea Operating Microscope Industry Revenue (Million) Forecast, by Application 2019 & 2032
- Table 64: South Korea Operating Microscope Industry Volume (K Unit) Forecast, by Application 2019 & 2032
- Table 65: Rest of Asia Pacific Operating Microscope Industry Revenue (Million) Forecast, by Application 2019 & 2032
- Table 66: Rest of Asia Pacific Operating Microscope Industry Volume (K Unit) Forecast, by Application 2019 & 2032
- Table 67: Global Operating Microscope Industry Revenue Million Forecast, by Application 2019 & 2032
- Table 68: Global Operating Microscope Industry Volume K Unit Forecast, by Application 2019 & 2032
- Table 69: Global Operating Microscope Industry Revenue Million Forecast, by End User 2019 & 2032
- Table 70: Global Operating Microscope Industry Volume K Unit Forecast, by End User 2019 & 2032
- Table 71: Global Operating Microscope Industry Revenue Million Forecast, by Country 2019 & 2032
- Table 72: Global Operating Microscope Industry Volume K Unit Forecast, by Country 2019 & 2032
- Table 73: GCC Operating Microscope Industry Revenue (Million) Forecast, by Application 2019 & 2032
- Table 74: GCC Operating Microscope Industry Volume (K Unit) Forecast, by Application 2019 & 2032
- Table 75: South Africa Operating Microscope Industry Revenue (Million) Forecast, by Application 2019 & 2032
- Table 76: South Africa Operating Microscope Industry Volume (K Unit) Forecast, by Application 2019 & 2032
- Table 77: Rest of Middle East and Africa Operating Microscope Industry Revenue (Million) Forecast, by Application 2019 & 2032
- Table 78: Rest of Middle East and Africa Operating Microscope Industry Volume (K Unit) Forecast, by Application 2019 & 2032
- Table 79: Global Operating Microscope Industry Revenue Million Forecast, by Application 2019 & 2032
- Table 80: Global Operating Microscope Industry Volume K Unit Forecast, by Application 2019 & 2032
- Table 81: Global Operating Microscope Industry Revenue Million Forecast, by End User 2019 & 2032
- Table 82: Global Operating Microscope Industry Volume K Unit Forecast, by End User 2019 & 2032
- Table 83: Global Operating Microscope Industry Revenue Million Forecast, by Country 2019 & 2032
- Table 84: Global Operating Microscope Industry Volume K Unit Forecast, by Country 2019 & 2032
- Table 85: Brazil Operating Microscope Industry Revenue (Million) Forecast, by Application 2019 & 2032
- Table 86: Brazil Operating Microscope Industry Volume (K Unit) Forecast, by Application 2019 & 2032
- Table 87: Argentina Operating Microscope Industry Revenue (Million) Forecast, by Application 2019 & 2032
- Table 88: Argentina Operating Microscope Industry Volume (K Unit) Forecast, by Application 2019 & 2032
- Table 89: Rest of South America Operating Microscope Industry Revenue (Million) Forecast, by Application 2019 & 2032
- Table 90: Rest of South America Operating Microscope Industry Volume (K Unit) Forecast, by Application 2019 & 2032
Frequently Asked Questions
1. What is the projected Compound Annual Growth Rate (CAGR) of the Operating Microscope Industry?
The projected CAGR is approximately 11.77%.
2. Which companies are prominent players in the Operating Microscope Industry?
Key companies in the market include Seiler Instrument Inc, Metall Zug Group (Haag-Streit), Takagi Seiko Co Ltd, ATMOS MedizinTechnik GmbH & Co KG, Topcon Corporation, Avante Health Solutions, ARI Medical Technology Co Ltd, Danaher Corporation (Leica Microsystems), Synaptive Medical, Carl Zeiss AG, Labomed Inc, Alltion (Wuzhou) Co Ltd, Alcon Inc, Olympus Corporation, Optofine Instruments Pvt Ltd.
3. What are the main segments of the Operating Microscope Industry?
The market segments include Application, End User.
4. Can you provide details about the market size?
The market size is estimated to be USD 1.41 Million as of 2022.
5. What are some drivers contributing to market growth?
Increasing Adoption of Minimally Invasive Surgeries; Rising Geriatric Population and Burden of Chronic Diseases; Technological Advancements in Surgical Microscopes.
6. What are the notable trends driving market growth?
Ophthalmology Segment is Expected to Hold a Largest Share in the Market Over the Forecast Period.
7. Are there any restraints impacting market growth?
Lack of Skilled Professionals; Low Acceptance Owing to High Costs.
8. Can you provide examples of recent developments in the market?
March 2023: The Joseph N France General Hospital acquired a Leica M690 Surgical Operating Microscope System. This cutting-edge technology is set to revolutionize the surgical procedures performed at the hospital, leading to improved patient care and outcomes.
9. What pricing options are available for accessing the report?
Pricing options include single-user, multi-user, and enterprise licenses priced at USD 4750, USD 5250, and USD 8750 respectively.
10. Is the market size provided in terms of value or volume?
The market size is provided in terms of value, measured in Million and volume, measured in K Unit.
11. Are there any specific market keywords associated with the report?
Yes, the market keyword associated with the report is "Operating Microscope Industry," which aids in identifying and referencing the specific market segment covered.
12. How do I determine which pricing option suits my needs best?
The pricing options vary based on user requirements and access needs. Individual users may opt for single-user licenses, while businesses requiring broader access may choose multi-user or enterprise licenses for cost-effective access to the report.
13. Are there any additional resources or data provided in the Operating Microscope Industry report?
While the report offers comprehensive insights, it's advisable to review the specific contents or supplementary materials provided to ascertain if additional resources or data are available.
14. How can I stay updated on further developments or reports in the Operating Microscope Industry?
To stay informed about further developments, trends, and reports in the Operating Microscope Industry, consider subscribing to industry newsletters, following relevant companies and organizations, or regularly checking reputable industry news sources and publications.
Methodology
Step 1 - Identification of Relevant Samples Size from Population Database


Step 2 - Approaches for Defining Global Market Size (Value, Volume* & Price*)

Note*: In applicable scenarios
Step 3 - Data Sources
Primary Research
- Web Analytics
- Survey Reports
- Research Institute
- Latest Research Reports
- Opinion Leaders
Secondary Research
- Annual Reports
- White Paper
- Latest Press Release
- Industry Association
- Paid Database
- Investor Presentations

Step 4 - Data Triangulation
Involves using different sources of information in order to increase the validity of a study
These sources are likely to be stakeholders in a program - participants, other researchers, program staff, other community members, and so on.
Then we put all data in single framework & apply various statistical tools to find out the dynamic on the market.
During the analysis stage, feedback from the stakeholder groups would be compared to determine areas of agreement as well as areas of divergence
