

Key Insights
The global wearable injectors market is poised for significant expansion, driven by the increasing prevalence of chronic conditions necessitating frequent therapies and technological innovations enhancing device usability and convenience. Projections indicate a market size of $10.1 billion by 2024, with a Compound Annual Growth Rate (CAGR) of 10.6% from the base year 2024. Key growth catalysts include the rising incidence of diabetes, autoimmune disorders, and oncological conditions, alongside a growing patient preference for home-based self-administration over frequent clinical visits. Advancements in drug delivery, integrated monitoring, and smart features are further bolstering market adoption. On-body injectors dominate the market share due to their discreet design and ease of use, while oncology therapies remain a primary revenue driver given the substantial injection requirements for cancer treatment. Nevertheless, high initial device costs, regulatory complexities, and potential safety concerns pose market entry challenges.
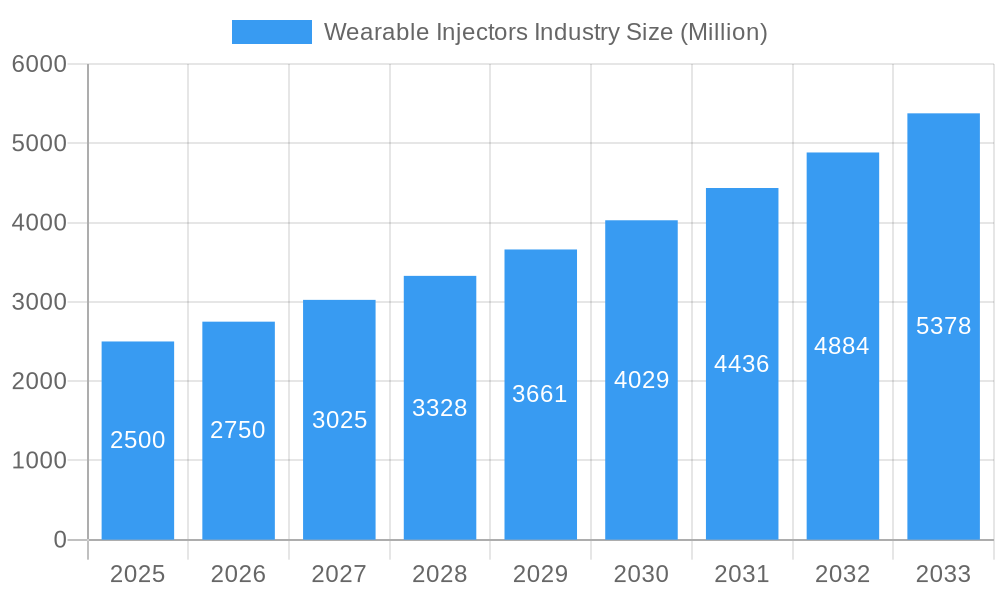
Wearable Injectors Industry Market Size (In Billion)
The market is segmented by injector type (on-body, off-body), therapy area (oncology, autoimmune disease, diabetes, cardiovascular disease, others), and end-user (hospitals, clinics, home care, others). North America currently leads the market, supported by robust healthcare infrastructure, high disease burden, and early technological adoption. However, the Asia Pacific region is anticipated to experience substantial growth, fueled by increasing disposable incomes, rising healthcare investments, and heightened awareness of chronic diseases. Prominent industry players, including Becton Dickinson, West Pharmaceutical Services, and Ypsomed, are actively shaping the competitive landscape through innovation and strategic initiatives. The forecast period (2025-2033) expects continued market expansion, potentially at a moderated rate due to market maturity. Future growth will be contingent on the successful introduction of advanced, cost-effective, and user-centric devices that address unmet patient needs and overcome existing limitations.
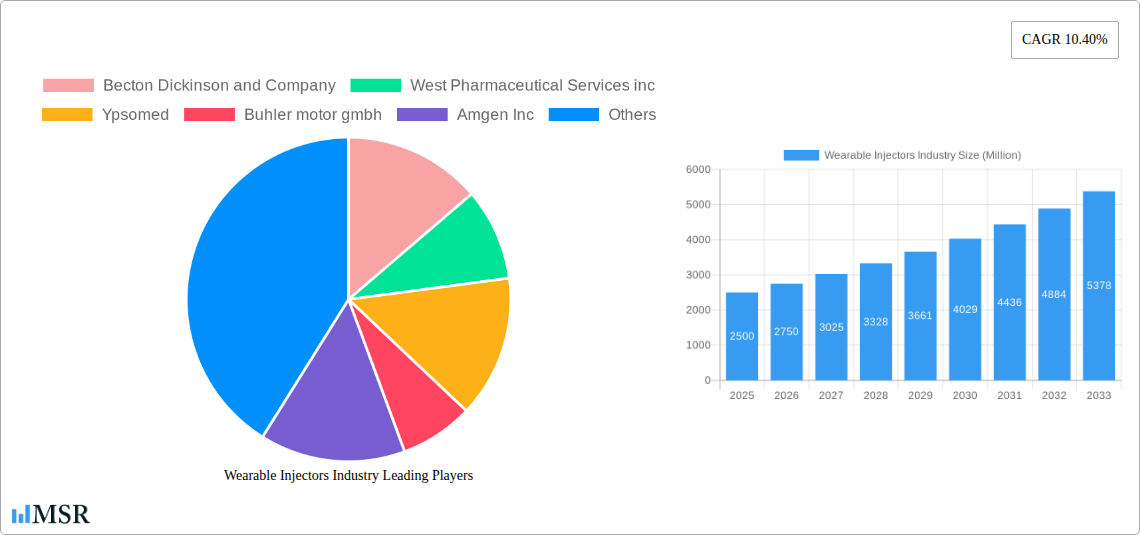
Wearable Injectors Industry Company Market Share
Wearable Injectors Industry: A Comprehensive Market Report (2019-2033)
This comprehensive report provides an in-depth analysis of the global wearable injectors market, offering invaluable insights for stakeholders across the pharmaceutical, medical device, and healthcare sectors. With a detailed study period spanning 2019-2033, including a base year of 2025 and a forecast period of 2025-2033, this report examines market dynamics, growth drivers, key players, and emerging opportunities within this rapidly evolving industry. The report covers a market valued at xx Million in 2025, projected to reach xx Million by 2033, exhibiting a CAGR of xx%.
Wearable Injectors Industry Market Concentration & Dynamics
The wearable injectors market is characterized by a moderately concentrated landscape, with key players like Becton Dickinson and Company, West Pharmaceutical Services Inc., and Ypsomed holding significant market share. The industry is witnessing intense competition driven by continuous product innovation, strategic partnerships, and mergers & acquisitions (M&A) activities. Over the historical period (2019-2024), approximately xx M&A deals were recorded, indicating a consolidating market. Regulatory frameworks, particularly concerning safety and efficacy, play a crucial role in shaping market dynamics. Substitute products, such as oral medications and traditional injection methods, pose a competitive challenge, although the convenience and patient adherence benefits of wearable injectors are driving market growth. End-user trends, especially the growing preference for home healthcare and personalized medicine, are further fueling demand.
- Market Share: Becton Dickinson and Company (xx%), West Pharmaceutical Services Inc. (xx%), Ypsomed (xx%), Others (xx%)
- M&A Activity: xx deals between 2019 and 2024, with an increasing trend towards consolidation.
- Regulatory Landscape: Stringent regulatory approvals impacting time to market and investment.
- Substitute Products: Oral medications and traditional injection methods posing competitive pressure.
- End-User Trends: Growing preference for home healthcare and personalized medicine driving demand.
Wearable Injectors Industry Insights & Trends
The global wearable injectors market is experiencing robust growth, driven by several factors. The increasing prevalence of chronic diseases like diabetes, autoimmune disorders, and cancer is a primary catalyst. Technological advancements, including miniaturization, improved drug delivery mechanisms, and enhanced patient monitoring capabilities, are further enhancing market appeal. Evolving consumer behaviors, with a growing emphasis on convenience, self-management of healthcare, and improved patient outcomes, are also contributing significantly to market expansion. The market's growth is also influenced by favorable reimbursement policies in various regions and increasing healthcare expenditure globally. The integration of smart technology and data analytics is creating new opportunities for remote patient monitoring and personalized treatment plans, further driving the adoption of wearable injectors. The market is expected to witness significant growth in the coming years, driven by these factors. The focus on improving patient compliance and reducing the burden of frequent injections is also a key driver.
Key Markets & Segments Leading Wearable Injectors Industry
The North American market currently dominates the wearable injectors landscape, driven by high healthcare expenditure, advanced medical infrastructure, and a large patient population with chronic diseases. Within therapy segments, diabetes holds a significant share due to the high prevalence of the disease and the increasing adoption of insulin delivery devices. On-body injectors constitute the largest segment by type, owing to their convenience and ease of use. Hospitals and clinics are the major end-users, followed by the growing home healthcare segment.
- Dominant Region: North America
- Dominant Therapy Segment: Diabetes
- Dominant Type Segment: On-body Injectors
- Dominant End-User Segment: Hospitals and Clinics
- Growth Drivers:
- High healthcare expenditure in developed countries.
- Increasing prevalence of chronic diseases.
- Growing demand for convenient and self-administered drug delivery systems.
- Technological advancements in wearable injector technology.
Wearable Injectors Industry Product Developments
Recent years have witnessed significant innovations in wearable injector technology, including the development of smaller, more comfortable devices with improved drug delivery precision. The integration of smart features, such as remote monitoring capabilities and automated dose adjustments, enhances patient convenience and improves treatment outcomes. These advancements are driving increased market penetration and creating a competitive edge for leading players. Furthermore, the development of novel drug delivery mechanisms, including microneedle arrays and osmotic pumps, expands the potential applications of wearable injectors beyond traditional subcutaneous injections.
Challenges in the Wearable Injectors Industry Market
The wearable injectors market faces several challenges, including stringent regulatory approvals, which can delay product launches and increase development costs. Supply chain disruptions, particularly in the manufacturing of specialized components, can impact production and availability. Furthermore, intense competition among established players and new entrants requires continuous innovation and differentiation to maintain market share. These factors can limit market growth and profitability. The high initial investment required for research, development, and manufacturing also acts as a barrier for some players.
Forces Driving Wearable Injectors Industry Growth
Technological advancements such as miniaturization, improved drug delivery systems, and integration of smart technology are key growth drivers. Increasing prevalence of chronic diseases and favorable reimbursement policies further enhance market expansion. Regulatory approvals for innovative products and supportive government initiatives contribute to market growth. For example, the FDA approval of new drugs for self-administration via subcutaneous injection, using on-body injectors, significantly boosts market demand.
Long-Term Growth Catalysts in the Wearable Injectors Industry
Long-term growth will be fueled by continued innovation in drug delivery mechanisms, partnerships between pharmaceutical companies and medical device manufacturers, and expansion into new therapeutic areas. The integration of artificial intelligence and machine learning for personalized medicine and improved patient monitoring will significantly enhance the value proposition of wearable injectors. Furthermore, expansion into emerging markets with growing healthcare infrastructure and increasing demand for accessible healthcare solutions will contribute to long-term market growth.
Emerging Opportunities in Wearable Injectors Industry
Emerging opportunities lie in the development of next-generation wearable injectors with advanced features like integrated sensors for real-time patient monitoring and data analytics. The expansion into new therapeutic areas, such as vaccines and gene therapy, presents significant growth potential. Furthermore, the increasing focus on personalized medicine and telehealth presents exciting opportunities for remote patient monitoring and improved treatment adherence.
Leading Players in the Wearable Injectors Industry Sector
- Becton Dickinson and Company
- West Pharmaceutical Services Inc.
- Ypsomed
- Buhler motor gmbh
- Amgen Inc
- Sensile Medical
- Dexcom Inc
- Insulet Corporation
- Tandem Diabetes Care Inc
- Eitan Medical
- Stevanato Group
- Enable Injections
- United Therapeutics (Steadymed Therapeutics)
Key Milestones in Wearable Injectors Industry Industry
- June 2022: AbbVie received US FDA approval for SKYRIZI (risankizumab-rzaa), boosting demand for on-body injectors.
- February 2022: Enable Injections raised USD 215 Million, signifying substantial investment in wearable injector technology.
Strategic Outlook for Wearable Injectors Industry Market
The future of the wearable injectors market is bright, with continued growth driven by technological innovation, expanding therapeutic applications, and increasing adoption in emerging markets. Strategic partnerships and collaborations between pharmaceutical companies and medical device manufacturers will play a crucial role in accelerating market expansion. The focus on improving patient outcomes and enhancing treatment adherence will further fuel the demand for advanced wearable injector technologies. The market is poised for significant growth, driven by factors such as the increasing prevalence of chronic diseases, rising healthcare expenditure, and a growing focus on convenient and personalized healthcare solutions.
Wearable Injectors Industry Segmentation
-
1. Type
- 1.1. On-Body Injectors
- 1.2. Off-Body Injectors
-
2. Therapy
- 2.1. Oncology
- 2.2. Autoimmune Disease
- 2.3. Diabetes
- 2.4. Cardiovascular Disease
- 2.5. Others
-
3. End User
- 3.1. Hospitals and Clinics
- 3.2. Home Care
- 3.3. Others
Wearable Injectors Industry Segmentation By Geography
-
1. North America
- 1.1. United States
- 1.2. Canada
- 1.3. Mexico
-
2. Europe
- 2.1. Germany
- 2.2. United Kingdom
- 2.3. France
- 2.4. Italy
- 2.5. Spain
- 2.6. Rest of Europe
-
3. Asia Pacific
- 3.1. China
- 3.2. Japan
- 3.3. India
- 3.4. Australia
- 3.5. South Korea
- 3.6. Rest of Asia Pacific
-
4. Middle East and Africa
- 4.1. GCC
- 4.2. South Africa
- 4.3. Rest of Middle East and Africa
-
5. South America
- 5.1. Brazil
- 5.2. Argentina
- 5.3. Rest of South America
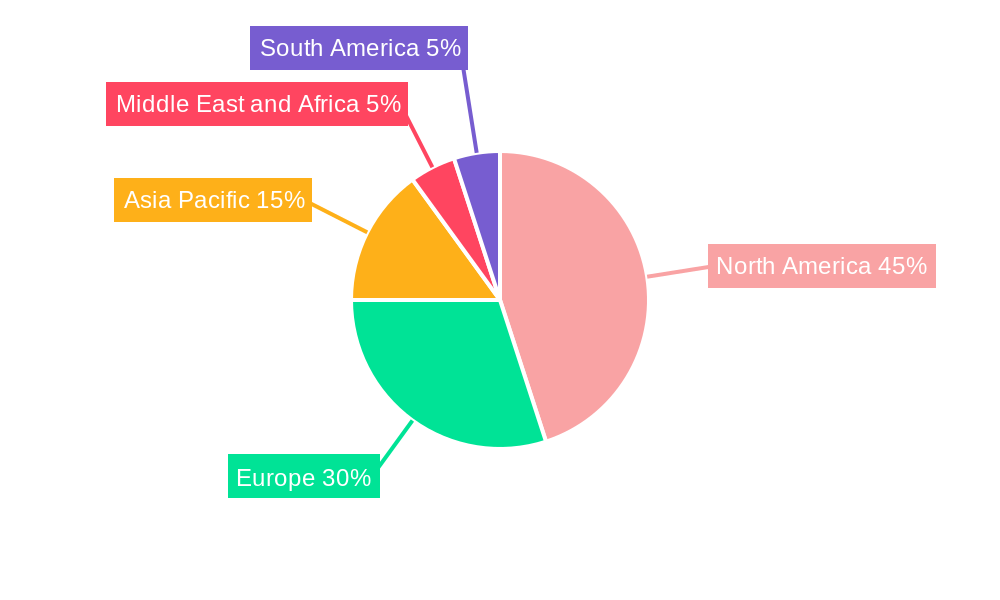
Wearable Injectors Industry Regional Market Share
Geographic Coverage of Wearable Injectors Industry
Wearable Injectors Industry REPORT HIGHLIGHTS
| Aspects | Details |
|---|---|
| Study Period | 2020-2034 |
| Base Year | 2025 |
| Estimated Year | 2026 |
| Forecast Period | 2026-2034 |
| Historical Period | 2020-2025 |
| Growth Rate | CAGR of 10.6% from 2020-2034 |
| Segmentation |
|
Table of Contents
- 1. Introduction
- 1.1. Research Scope
- 1.2. Market Segmentation
- 1.3. Research Objective
- 1.4. Definitions and Assumptions
- 2. Executive Summary
- 2.1. Market Snapshot
- 3. Market Dynamics
- 3.1. Market Drivers
- 3.2. Market Restrains
- 3.3. Market Trends
- 3.4. Market Opportunities
- 4. Market Factor Analysis
- 4.1. Porters Five Forces
- 4.1.1. Bargaining Power of Suppliers
- 4.1.2. Bargaining Power of Buyers
- 4.1.3. Threat of New Entrants
- 4.1.4. Threat of Substitutes
- 4.1.5. Competitive Rivalry
- 4.2. PESTEL analysis
- 4.3. BCG Analysis
- 4.3.1. Stars (High Growth, High Market Share)
- 4.3.2. Cash Cows (Low Growth, High Market Share)
- 4.3.3. Question Mark (High Growth, Low Market Share)
- 4.3.4. Dogs (Low Growth, Low Market Share)
- 4.4. Ansoff Matrix Analysis
- 4.5. Supply Chain Analysis
- 4.6. Regulatory Landscape
- 4.7. Current Market Potential and Opportunity Assessment (TAM–SAM–SOM Framework)
- 4.8. MSR Analyst Note
- 4.1. Porters Five Forces
- 5. Market Analysis, Insights and Forecast 2021-2033
- 5.1. Market Analysis, Insights and Forecast - by Type
- 5.1.1. On-Body Injectors
- 5.1.2. Off-Body Injectors
- 5.2. Market Analysis, Insights and Forecast - by Therapy
- 5.2.1. Oncology
- 5.2.2. Autoimmune Disease
- 5.2.3. Diabetes
- 5.2.4. Cardiovascular Disease
- 5.2.5. Others
- 5.3. Market Analysis, Insights and Forecast - by End User
- 5.3.1. Hospitals and Clinics
- 5.3.2. Home Care
- 5.3.3. Others
- 5.4. Market Analysis, Insights and Forecast - by Region
- 5.4.1. North America
- 5.4.2. Europe
- 5.4.3. Asia Pacific
- 5.4.4. Middle East and Africa
- 5.4.5. South America
- 5.1. Market Analysis, Insights and Forecast - by Type
- 6. Global Wearable Injectors Industry Analysis, Insights and Forecast, 2021-2033
- 6.1. Market Analysis, Insights and Forecast - by Type
- 6.1.1. On-Body Injectors
- 6.1.2. Off-Body Injectors
- 6.2. Market Analysis, Insights and Forecast - by Therapy
- 6.2.1. Oncology
- 6.2.2. Autoimmune Disease
- 6.2.3. Diabetes
- 6.2.4. Cardiovascular Disease
- 6.2.5. Others
- 6.3. Market Analysis, Insights and Forecast - by End User
- 6.3.1. Hospitals and Clinics
- 6.3.2. Home Care
- 6.3.3. Others
- 6.1. Market Analysis, Insights and Forecast - by Type
- 7. North America Wearable Injectors Industry Analysis, Insights and Forecast, 2020-2032
- 7.1. Market Analysis, Insights and Forecast - by Type
- 7.1.1. On-Body Injectors
- 7.1.2. Off-Body Injectors
- 7.2. Market Analysis, Insights and Forecast - by Therapy
- 7.2.1. Oncology
- 7.2.2. Autoimmune Disease
- 7.2.3. Diabetes
- 7.2.4. Cardiovascular Disease
- 7.2.5. Others
- 7.3. Market Analysis, Insights and Forecast - by End User
- 7.3.1. Hospitals and Clinics
- 7.3.2. Home Care
- 7.3.3. Others
- 7.1. Market Analysis, Insights and Forecast - by Type
- 8. Europe Wearable Injectors Industry Analysis, Insights and Forecast, 2020-2032
- 8.1. Market Analysis, Insights and Forecast - by Type
- 8.1.1. On-Body Injectors
- 8.1.2. Off-Body Injectors
- 8.2. Market Analysis, Insights and Forecast - by Therapy
- 8.2.1. Oncology
- 8.2.2. Autoimmune Disease
- 8.2.3. Diabetes
- 8.2.4. Cardiovascular Disease
- 8.2.5. Others
- 8.3. Market Analysis, Insights and Forecast - by End User
- 8.3.1. Hospitals and Clinics
- 8.3.2. Home Care
- 8.3.3. Others
- 8.1. Market Analysis, Insights and Forecast - by Type
- 9. Asia Pacific Wearable Injectors Industry Analysis, Insights and Forecast, 2020-2032
- 9.1. Market Analysis, Insights and Forecast - by Type
- 9.1.1. On-Body Injectors
- 9.1.2. Off-Body Injectors
- 9.2. Market Analysis, Insights and Forecast - by Therapy
- 9.2.1. Oncology
- 9.2.2. Autoimmune Disease
- 9.2.3. Diabetes
- 9.2.4. Cardiovascular Disease
- 9.2.5. Others
- 9.3. Market Analysis, Insights and Forecast - by End User
- 9.3.1. Hospitals and Clinics
- 9.3.2. Home Care
- 9.3.3. Others
- 9.1. Market Analysis, Insights and Forecast - by Type
- 10. Middle East and Africa Wearable Injectors Industry Analysis, Insights and Forecast, 2020-2032
- 10.1. Market Analysis, Insights and Forecast - by Type
- 10.1.1. On-Body Injectors
- 10.1.2. Off-Body Injectors
- 10.2. Market Analysis, Insights and Forecast - by Therapy
- 10.2.1. Oncology
- 10.2.2. Autoimmune Disease
- 10.2.3. Diabetes
- 10.2.4. Cardiovascular Disease
- 10.2.5. Others
- 10.3. Market Analysis, Insights and Forecast - by End User
- 10.3.1. Hospitals and Clinics
- 10.3.2. Home Care
- 10.3.3. Others
- 10.1. Market Analysis, Insights and Forecast - by Type
- 11. South America Wearable Injectors Industry Analysis, Insights and Forecast, 2020-2032
- 11.1. Market Analysis, Insights and Forecast - by Type
- 11.1.1. On-Body Injectors
- 11.1.2. Off-Body Injectors
- 11.2. Market Analysis, Insights and Forecast - by Therapy
- 11.2.1. Oncology
- 11.2.2. Autoimmune Disease
- 11.2.3. Diabetes
- 11.2.4. Cardiovascular Disease
- 11.2.5. Others
- 11.3. Market Analysis, Insights and Forecast - by End User
- 11.3.1. Hospitals and Clinics
- 11.3.2. Home Care
- 11.3.3. Others
- 11.1. Market Analysis, Insights and Forecast - by Type
- 12. Competitive Analysis
- 12.1. Company Profiles
- 12.1.1 Becton Dickinson and Company
- 12.1.1.1. Company Overview
- 12.1.1.2. Products
- 12.1.1.3. Company Financials
- 12.1.1.4. SWOT Analysis
- 12.1.2 West Pharmaceutical Services inc
- 12.1.2.1. Company Overview
- 12.1.2.2. Products
- 12.1.2.3. Company Financials
- 12.1.2.4. SWOT Analysis
- 12.1.3 Ypsomed
- 12.1.3.1. Company Overview
- 12.1.3.2. Products
- 12.1.3.3. Company Financials
- 12.1.3.4. SWOT Analysis
- 12.1.4 Buhler motor gmbh
- 12.1.4.1. Company Overview
- 12.1.4.2. Products
- 12.1.4.3. Company Financials
- 12.1.4.4. SWOT Analysis
- 12.1.5 Amgen Inc
- 12.1.5.1. Company Overview
- 12.1.5.2. Products
- 12.1.5.3. Company Financials
- 12.1.5.4. SWOT Analysis
- 12.1.6 Sensile Medical
- 12.1.6.1. Company Overview
- 12.1.6.2. Products
- 12.1.6.3. Company Financials
- 12.1.6.4. SWOT Analysis
- 12.1.7 Dexcom Inc
- 12.1.7.1. Company Overview
- 12.1.7.2. Products
- 12.1.7.3. Company Financials
- 12.1.7.4. SWOT Analysis
- 12.1.8 Insulet Corporation
- 12.1.8.1. Company Overview
- 12.1.8.2. Products
- 12.1.8.3. Company Financials
- 12.1.8.4. SWOT Analysis
- 12.1.9 Tandem Diabetes Care Inc
- 12.1.9.1. Company Overview
- 12.1.9.2. Products
- 12.1.9.3. Company Financials
- 12.1.9.4. SWOT Analysis
- 12.1.10 Eitan Medical
- 12.1.10.1. Company Overview
- 12.1.10.2. Products
- 12.1.10.3. Company Financials
- 12.1.10.4. SWOT Analysis
- 12.1.11 Stevanato Group
- 12.1.11.1. Company Overview
- 12.1.11.2. Products
- 12.1.11.3. Company Financials
- 12.1.11.4. SWOT Analysis
- 12.1.12 Enable Injections
- 12.1.12.1. Company Overview
- 12.1.12.2. Products
- 12.1.12.3. Company Financials
- 12.1.12.4. SWOT Analysis
- 12.1.13 United Therapeutics (Steadymed Therapeutics)
- 12.1.13.1. Company Overview
- 12.1.13.2. Products
- 12.1.13.3. Company Financials
- 12.1.13.4. SWOT Analysis
- 12.1.1 Becton Dickinson and Company
- 12.2. Market Entropy
- 12.2.1 Company's Key Areas Served
- 12.2.2 Recent Developments
- 12.3. Company Market Share Analysis 2025
- 12.3.1 Top 5 Companies Market Share Analysis
- 12.3.2 Top 3 Companies Market Share Analysis
- 12.4. List of Potential Customers
- 13. Research Methodology
List of Figures
- Figure 1: Global Wearable Injectors Industry Revenue Breakdown (billion, %) by Region 2025 & 2033
- Figure 2: Global Wearable Injectors Industry Volume Breakdown (K Unit, %) by Region 2025 & 2033
- Figure 3: North America Wearable Injectors Industry Revenue (billion), by Type 2025 & 2033
- Figure 4: North America Wearable Injectors Industry Volume (K Unit), by Type 2025 & 2033
- Figure 5: North America Wearable Injectors Industry Revenue Share (%), by Type 2025 & 2033
- Figure 6: North America Wearable Injectors Industry Volume Share (%), by Type 2025 & 2033
- Figure 7: North America Wearable Injectors Industry Revenue (billion), by Therapy 2025 & 2033
- Figure 8: North America Wearable Injectors Industry Volume (K Unit), by Therapy 2025 & 2033
- Figure 9: North America Wearable Injectors Industry Revenue Share (%), by Therapy 2025 & 2033
- Figure 10: North America Wearable Injectors Industry Volume Share (%), by Therapy 2025 & 2033
- Figure 11: North America Wearable Injectors Industry Revenue (billion), by End User 2025 & 2033
- Figure 12: North America Wearable Injectors Industry Volume (K Unit), by End User 2025 & 2033
- Figure 13: North America Wearable Injectors Industry Revenue Share (%), by End User 2025 & 2033
- Figure 14: North America Wearable Injectors Industry Volume Share (%), by End User 2025 & 2033
- Figure 15: North America Wearable Injectors Industry Revenue (billion), by Country 2025 & 2033
- Figure 16: North America Wearable Injectors Industry Volume (K Unit), by Country 2025 & 2033
- Figure 17: North America Wearable Injectors Industry Revenue Share (%), by Country 2025 & 2033
- Figure 18: North America Wearable Injectors Industry Volume Share (%), by Country 2025 & 2033
- Figure 19: Europe Wearable Injectors Industry Revenue (billion), by Type 2025 & 2033
- Figure 20: Europe Wearable Injectors Industry Volume (K Unit), by Type 2025 & 2033
- Figure 21: Europe Wearable Injectors Industry Revenue Share (%), by Type 2025 & 2033
- Figure 22: Europe Wearable Injectors Industry Volume Share (%), by Type 2025 & 2033
- Figure 23: Europe Wearable Injectors Industry Revenue (billion), by Therapy 2025 & 2033
- Figure 24: Europe Wearable Injectors Industry Volume (K Unit), by Therapy 2025 & 2033
- Figure 25: Europe Wearable Injectors Industry Revenue Share (%), by Therapy 2025 & 2033
- Figure 26: Europe Wearable Injectors Industry Volume Share (%), by Therapy 2025 & 2033
- Figure 27: Europe Wearable Injectors Industry Revenue (billion), by End User 2025 & 2033
- Figure 28: Europe Wearable Injectors Industry Volume (K Unit), by End User 2025 & 2033
- Figure 29: Europe Wearable Injectors Industry Revenue Share (%), by End User 2025 & 2033
- Figure 30: Europe Wearable Injectors Industry Volume Share (%), by End User 2025 & 2033
- Figure 31: Europe Wearable Injectors Industry Revenue (billion), by Country 2025 & 2033
- Figure 32: Europe Wearable Injectors Industry Volume (K Unit), by Country 2025 & 2033
- Figure 33: Europe Wearable Injectors Industry Revenue Share (%), by Country 2025 & 2033
- Figure 34: Europe Wearable Injectors Industry Volume Share (%), by Country 2025 & 2033
- Figure 35: Asia Pacific Wearable Injectors Industry Revenue (billion), by Type 2025 & 2033
- Figure 36: Asia Pacific Wearable Injectors Industry Volume (K Unit), by Type 2025 & 2033
- Figure 37: Asia Pacific Wearable Injectors Industry Revenue Share (%), by Type 2025 & 2033
- Figure 38: Asia Pacific Wearable Injectors Industry Volume Share (%), by Type 2025 & 2033
- Figure 39: Asia Pacific Wearable Injectors Industry Revenue (billion), by Therapy 2025 & 2033
- Figure 40: Asia Pacific Wearable Injectors Industry Volume (K Unit), by Therapy 2025 & 2033
- Figure 41: Asia Pacific Wearable Injectors Industry Revenue Share (%), by Therapy 2025 & 2033
- Figure 42: Asia Pacific Wearable Injectors Industry Volume Share (%), by Therapy 2025 & 2033
- Figure 43: Asia Pacific Wearable Injectors Industry Revenue (billion), by End User 2025 & 2033
- Figure 44: Asia Pacific Wearable Injectors Industry Volume (K Unit), by End User 2025 & 2033
- Figure 45: Asia Pacific Wearable Injectors Industry Revenue Share (%), by End User 2025 & 2033
- Figure 46: Asia Pacific Wearable Injectors Industry Volume Share (%), by End User 2025 & 2033
- Figure 47: Asia Pacific Wearable Injectors Industry Revenue (billion), by Country 2025 & 2033
- Figure 48: Asia Pacific Wearable Injectors Industry Volume (K Unit), by Country 2025 & 2033
- Figure 49: Asia Pacific Wearable Injectors Industry Revenue Share (%), by Country 2025 & 2033
- Figure 50: Asia Pacific Wearable Injectors Industry Volume Share (%), by Country 2025 & 2033
- Figure 51: Middle East and Africa Wearable Injectors Industry Revenue (billion), by Type 2025 & 2033
- Figure 52: Middle East and Africa Wearable Injectors Industry Volume (K Unit), by Type 2025 & 2033
- Figure 53: Middle East and Africa Wearable Injectors Industry Revenue Share (%), by Type 2025 & 2033
- Figure 54: Middle East and Africa Wearable Injectors Industry Volume Share (%), by Type 2025 & 2033
- Figure 55: Middle East and Africa Wearable Injectors Industry Revenue (billion), by Therapy 2025 & 2033
- Figure 56: Middle East and Africa Wearable Injectors Industry Volume (K Unit), by Therapy 2025 & 2033
- Figure 57: Middle East and Africa Wearable Injectors Industry Revenue Share (%), by Therapy 2025 & 2033
- Figure 58: Middle East and Africa Wearable Injectors Industry Volume Share (%), by Therapy 2025 & 2033
- Figure 59: Middle East and Africa Wearable Injectors Industry Revenue (billion), by End User 2025 & 2033
- Figure 60: Middle East and Africa Wearable Injectors Industry Volume (K Unit), by End User 2025 & 2033
- Figure 61: Middle East and Africa Wearable Injectors Industry Revenue Share (%), by End User 2025 & 2033
- Figure 62: Middle East and Africa Wearable Injectors Industry Volume Share (%), by End User 2025 & 2033
- Figure 63: Middle East and Africa Wearable Injectors Industry Revenue (billion), by Country 2025 & 2033
- Figure 64: Middle East and Africa Wearable Injectors Industry Volume (K Unit), by Country 2025 & 2033
- Figure 65: Middle East and Africa Wearable Injectors Industry Revenue Share (%), by Country 2025 & 2033
- Figure 66: Middle East and Africa Wearable Injectors Industry Volume Share (%), by Country 2025 & 2033
- Figure 67: South America Wearable Injectors Industry Revenue (billion), by Type 2025 & 2033
- Figure 68: South America Wearable Injectors Industry Volume (K Unit), by Type 2025 & 2033
- Figure 69: South America Wearable Injectors Industry Revenue Share (%), by Type 2025 & 2033
- Figure 70: South America Wearable Injectors Industry Volume Share (%), by Type 2025 & 2033
- Figure 71: South America Wearable Injectors Industry Revenue (billion), by Therapy 2025 & 2033
- Figure 72: South America Wearable Injectors Industry Volume (K Unit), by Therapy 2025 & 2033
- Figure 73: South America Wearable Injectors Industry Revenue Share (%), by Therapy 2025 & 2033
- Figure 74: South America Wearable Injectors Industry Volume Share (%), by Therapy 2025 & 2033
- Figure 75: South America Wearable Injectors Industry Revenue (billion), by End User 2025 & 2033
- Figure 76: South America Wearable Injectors Industry Volume (K Unit), by End User 2025 & 2033
- Figure 77: South America Wearable Injectors Industry Revenue Share (%), by End User 2025 & 2033
- Figure 78: South America Wearable Injectors Industry Volume Share (%), by End User 2025 & 2033
- Figure 79: South America Wearable Injectors Industry Revenue (billion), by Country 2025 & 2033
- Figure 80: South America Wearable Injectors Industry Volume (K Unit), by Country 2025 & 2033
- Figure 81: South America Wearable Injectors Industry Revenue Share (%), by Country 2025 & 2033
- Figure 82: South America Wearable Injectors Industry Volume Share (%), by Country 2025 & 2033
List of Tables
- Table 1: Global Wearable Injectors Industry Revenue billion Forecast, by Type 2020 & 2033
- Table 2: Global Wearable Injectors Industry Volume K Unit Forecast, by Type 2020 & 2033
- Table 3: Global Wearable Injectors Industry Revenue billion Forecast, by Therapy 2020 & 2033
- Table 4: Global Wearable Injectors Industry Volume K Unit Forecast, by Therapy 2020 & 2033
- Table 5: Global Wearable Injectors Industry Revenue billion Forecast, by End User 2020 & 2033
- Table 6: Global Wearable Injectors Industry Volume K Unit Forecast, by End User 2020 & 2033
- Table 7: Global Wearable Injectors Industry Revenue billion Forecast, by Region 2020 & 2033
- Table 8: Global Wearable Injectors Industry Volume K Unit Forecast, by Region 2020 & 2033
- Table 9: Global Wearable Injectors Industry Revenue billion Forecast, by Type 2020 & 2033
- Table 10: Global Wearable Injectors Industry Volume K Unit Forecast, by Type 2020 & 2033
- Table 11: Global Wearable Injectors Industry Revenue billion Forecast, by Therapy 2020 & 2033
- Table 12: Global Wearable Injectors Industry Volume K Unit Forecast, by Therapy 2020 & 2033
- Table 13: Global Wearable Injectors Industry Revenue billion Forecast, by End User 2020 & 2033
- Table 14: Global Wearable Injectors Industry Volume K Unit Forecast, by End User 2020 & 2033
- Table 15: Global Wearable Injectors Industry Revenue billion Forecast, by Country 2020 & 2033
- Table 16: Global Wearable Injectors Industry Volume K Unit Forecast, by Country 2020 & 2033
- Table 17: United States Wearable Injectors Industry Revenue (billion) Forecast, by Application 2020 & 2033
- Table 18: United States Wearable Injectors Industry Volume (K Unit) Forecast, by Application 2020 & 2033
- Table 19: Canada Wearable Injectors Industry Revenue (billion) Forecast, by Application 2020 & 2033
- Table 20: Canada Wearable Injectors Industry Volume (K Unit) Forecast, by Application 2020 & 2033
- Table 21: Mexico Wearable Injectors Industry Revenue (billion) Forecast, by Application 2020 & 2033
- Table 22: Mexico Wearable Injectors Industry Volume (K Unit) Forecast, by Application 2020 & 2033
- Table 23: Global Wearable Injectors Industry Revenue billion Forecast, by Type 2020 & 2033
- Table 24: Global Wearable Injectors Industry Volume K Unit Forecast, by Type 2020 & 2033
- Table 25: Global Wearable Injectors Industry Revenue billion Forecast, by Therapy 2020 & 2033
- Table 26: Global Wearable Injectors Industry Volume K Unit Forecast, by Therapy 2020 & 2033
- Table 27: Global Wearable Injectors Industry Revenue billion Forecast, by End User 2020 & 2033
- Table 28: Global Wearable Injectors Industry Volume K Unit Forecast, by End User 2020 & 2033
- Table 29: Global Wearable Injectors Industry Revenue billion Forecast, by Country 2020 & 2033
- Table 30: Global Wearable Injectors Industry Volume K Unit Forecast, by Country 2020 & 2033
- Table 31: Germany Wearable Injectors Industry Revenue (billion) Forecast, by Application 2020 & 2033
- Table 32: Germany Wearable Injectors Industry Volume (K Unit) Forecast, by Application 2020 & 2033
- Table 33: United Kingdom Wearable Injectors Industry Revenue (billion) Forecast, by Application 2020 & 2033
- Table 34: United Kingdom Wearable Injectors Industry Volume (K Unit) Forecast, by Application 2020 & 2033
- Table 35: France Wearable Injectors Industry Revenue (billion) Forecast, by Application 2020 & 2033
- Table 36: France Wearable Injectors Industry Volume (K Unit) Forecast, by Application 2020 & 2033
- Table 37: Italy Wearable Injectors Industry Revenue (billion) Forecast, by Application 2020 & 2033
- Table 38: Italy Wearable Injectors Industry Volume (K Unit) Forecast, by Application 2020 & 2033
- Table 39: Spain Wearable Injectors Industry Revenue (billion) Forecast, by Application 2020 & 2033
- Table 40: Spain Wearable Injectors Industry Volume (K Unit) Forecast, by Application 2020 & 2033
- Table 41: Rest of Europe Wearable Injectors Industry Revenue (billion) Forecast, by Application 2020 & 2033
- Table 42: Rest of Europe Wearable Injectors Industry Volume (K Unit) Forecast, by Application 2020 & 2033
- Table 43: Global Wearable Injectors Industry Revenue billion Forecast, by Type 2020 & 2033
- Table 44: Global Wearable Injectors Industry Volume K Unit Forecast, by Type 2020 & 2033
- Table 45: Global Wearable Injectors Industry Revenue billion Forecast, by Therapy 2020 & 2033
- Table 46: Global Wearable Injectors Industry Volume K Unit Forecast, by Therapy 2020 & 2033
- Table 47: Global Wearable Injectors Industry Revenue billion Forecast, by End User 2020 & 2033
- Table 48: Global Wearable Injectors Industry Volume K Unit Forecast, by End User 2020 & 2033
- Table 49: Global Wearable Injectors Industry Revenue billion Forecast, by Country 2020 & 2033
- Table 50: Global Wearable Injectors Industry Volume K Unit Forecast, by Country 2020 & 2033
- Table 51: China Wearable Injectors Industry Revenue (billion) Forecast, by Application 2020 & 2033
- Table 52: China Wearable Injectors Industry Volume (K Unit) Forecast, by Application 2020 & 2033
- Table 53: Japan Wearable Injectors Industry Revenue (billion) Forecast, by Application 2020 & 2033
- Table 54: Japan Wearable Injectors Industry Volume (K Unit) Forecast, by Application 2020 & 2033
- Table 55: India Wearable Injectors Industry Revenue (billion) Forecast, by Application 2020 & 2033
- Table 56: India Wearable Injectors Industry Volume (K Unit) Forecast, by Application 2020 & 2033
- Table 57: Australia Wearable Injectors Industry Revenue (billion) Forecast, by Application 2020 & 2033
- Table 58: Australia Wearable Injectors Industry Volume (K Unit) Forecast, by Application 2020 & 2033
- Table 59: South Korea Wearable Injectors Industry Revenue (billion) Forecast, by Application 2020 & 2033
- Table 60: South Korea Wearable Injectors Industry Volume (K Unit) Forecast, by Application 2020 & 2033
- Table 61: Rest of Asia Pacific Wearable Injectors Industry Revenue (billion) Forecast, by Application 2020 & 2033
- Table 62: Rest of Asia Pacific Wearable Injectors Industry Volume (K Unit) Forecast, by Application 2020 & 2033
- Table 63: Global Wearable Injectors Industry Revenue billion Forecast, by Type 2020 & 2033
- Table 64: Global Wearable Injectors Industry Volume K Unit Forecast, by Type 2020 & 2033
- Table 65: Global Wearable Injectors Industry Revenue billion Forecast, by Therapy 2020 & 2033
- Table 66: Global Wearable Injectors Industry Volume K Unit Forecast, by Therapy 2020 & 2033
- Table 67: Global Wearable Injectors Industry Revenue billion Forecast, by End User 2020 & 2033
- Table 68: Global Wearable Injectors Industry Volume K Unit Forecast, by End User 2020 & 2033
- Table 69: Global Wearable Injectors Industry Revenue billion Forecast, by Country 2020 & 2033
- Table 70: Global Wearable Injectors Industry Volume K Unit Forecast, by Country 2020 & 2033
- Table 71: GCC Wearable Injectors Industry Revenue (billion) Forecast, by Application 2020 & 2033
- Table 72: GCC Wearable Injectors Industry Volume (K Unit) Forecast, by Application 2020 & 2033
- Table 73: South Africa Wearable Injectors Industry Revenue (billion) Forecast, by Application 2020 & 2033
- Table 74: South Africa Wearable Injectors Industry Volume (K Unit) Forecast, by Application 2020 & 2033
- Table 75: Rest of Middle East and Africa Wearable Injectors Industry Revenue (billion) Forecast, by Application 2020 & 2033
- Table 76: Rest of Middle East and Africa Wearable Injectors Industry Volume (K Unit) Forecast, by Application 2020 & 2033
- Table 77: Global Wearable Injectors Industry Revenue billion Forecast, by Type 2020 & 2033
- Table 78: Global Wearable Injectors Industry Volume K Unit Forecast, by Type 2020 & 2033
- Table 79: Global Wearable Injectors Industry Revenue billion Forecast, by Therapy 2020 & 2033
- Table 80: Global Wearable Injectors Industry Volume K Unit Forecast, by Therapy 2020 & 2033
- Table 81: Global Wearable Injectors Industry Revenue billion Forecast, by End User 2020 & 2033
- Table 82: Global Wearable Injectors Industry Volume K Unit Forecast, by End User 2020 & 2033
- Table 83: Global Wearable Injectors Industry Revenue billion Forecast, by Country 2020 & 2033
- Table 84: Global Wearable Injectors Industry Volume K Unit Forecast, by Country 2020 & 2033
- Table 85: Brazil Wearable Injectors Industry Revenue (billion) Forecast, by Application 2020 & 2033
- Table 86: Brazil Wearable Injectors Industry Volume (K Unit) Forecast, by Application 2020 & 2033
- Table 87: Argentina Wearable Injectors Industry Revenue (billion) Forecast, by Application 2020 & 2033
- Table 88: Argentina Wearable Injectors Industry Volume (K Unit) Forecast, by Application 2020 & 2033
- Table 89: Rest of South America Wearable Injectors Industry Revenue (billion) Forecast, by Application 2020 & 2033
- Table 90: Rest of South America Wearable Injectors Industry Volume (K Unit) Forecast, by Application 2020 & 2033
Frequently Asked Questions
1. What is the projected Compound Annual Growth Rate (CAGR) of the Wearable Injectors Industry?
The projected CAGR is approximately 10.6%.
2. Which companies are prominent players in the Wearable Injectors Industry?
Key companies in the market include Becton Dickinson and Company, West Pharmaceutical Services inc, Ypsomed, Buhler motor gmbh, Amgen Inc, Sensile Medical, Dexcom Inc, Insulet Corporation, Tandem Diabetes Care Inc, Eitan Medical, Stevanato Group, Enable Injections, United Therapeutics (Steadymed Therapeutics).
3. What are the main segments of the Wearable Injectors Industry?
The market segments include Type, Therapy, End User.
4. Can you provide details about the market size?
The market size is estimated to be USD 10.1 billion as of 2022.
5. What are some drivers contributing to market growth?
Growing Prevalence of Chronic Diseases; Technological Advancements; Increasing Concern over the Hazards and Limitations Related to Needle stick.
6. What are the notable trends driving market growth?
Oncology Segment is Expected to Hold Significant Market Share Over the Forecast Period.
7. Are there any restraints impacting market growth?
Preference for Alternative Drug Delivery Modes; Unfavorable Reimbursement Structure in Developing Countries.
8. Can you provide examples of recent developments in the market?
June 2022: AbbVie received US FDA approval for SKYRIZI (risankizumab-rzaa) as the first and only specific interleukin-23 (IL-23) inhibitor for the treatment of adults with moderately to severely active Crohn's disease (CD). It can be self-administered by Subcutaneous Injection (SC) with an On-Body Injector (OBI).
9. What pricing options are available for accessing the report?
Pricing options include single-user, multi-user, and enterprise licenses priced at USD 4750, USD 5250, and USD 8750 respectively.
10. Is the market size provided in terms of value or volume?
The market size is provided in terms of value, measured in billion and volume, measured in K Unit.
11. Are there any specific market keywords associated with the report?
Yes, the market keyword associated with the report is "Wearable Injectors Industry," which aids in identifying and referencing the specific market segment covered.
12. How do I determine which pricing option suits my needs best?
The pricing options vary based on user requirements and access needs. Individual users may opt for single-user licenses, while businesses requiring broader access may choose multi-user or enterprise licenses for cost-effective access to the report.
13. Are there any additional resources or data provided in the Wearable Injectors Industry report?
While the report offers comprehensive insights, it's advisable to review the specific contents or supplementary materials provided to ascertain if additional resources or data are available.
14. How can I stay updated on further developments or reports in the Wearable Injectors Industry?
To stay informed about further developments, trends, and reports in the Wearable Injectors Industry, consider subscribing to industry newsletters, following relevant companies and organizations, or regularly checking reputable industry news sources and publications.
Methodology
Step 1 - Identification of Relevant Samples Size from Population Database


Step 2 - Approaches for Defining Global Market Size (Value, Volume* & Price*)

Note*: In applicable scenarios
Step 3 - Data Sources
Primary Research
- Web Analytics
- Survey Reports
- Research Institute
- Latest Research Reports
- Opinion Leaders
Secondary Research
- Annual Reports
- White Paper
- Latest Press Release
- Industry Association
- Paid Database
- Investor Presentations

Step 4 - Data Triangulation
Involves using different sources of information in order to increase the validity of a study
These sources are likely to be stakeholders in a program - participants, other researchers, program staff, other community members, and so on.
Then we put all data in single framework & apply various statistical tools to find out the dynamic on the market.
During the analysis stage, feedback from the stakeholder groups would be compared to determine areas of agreement as well as areas of divergence