

Key Insights
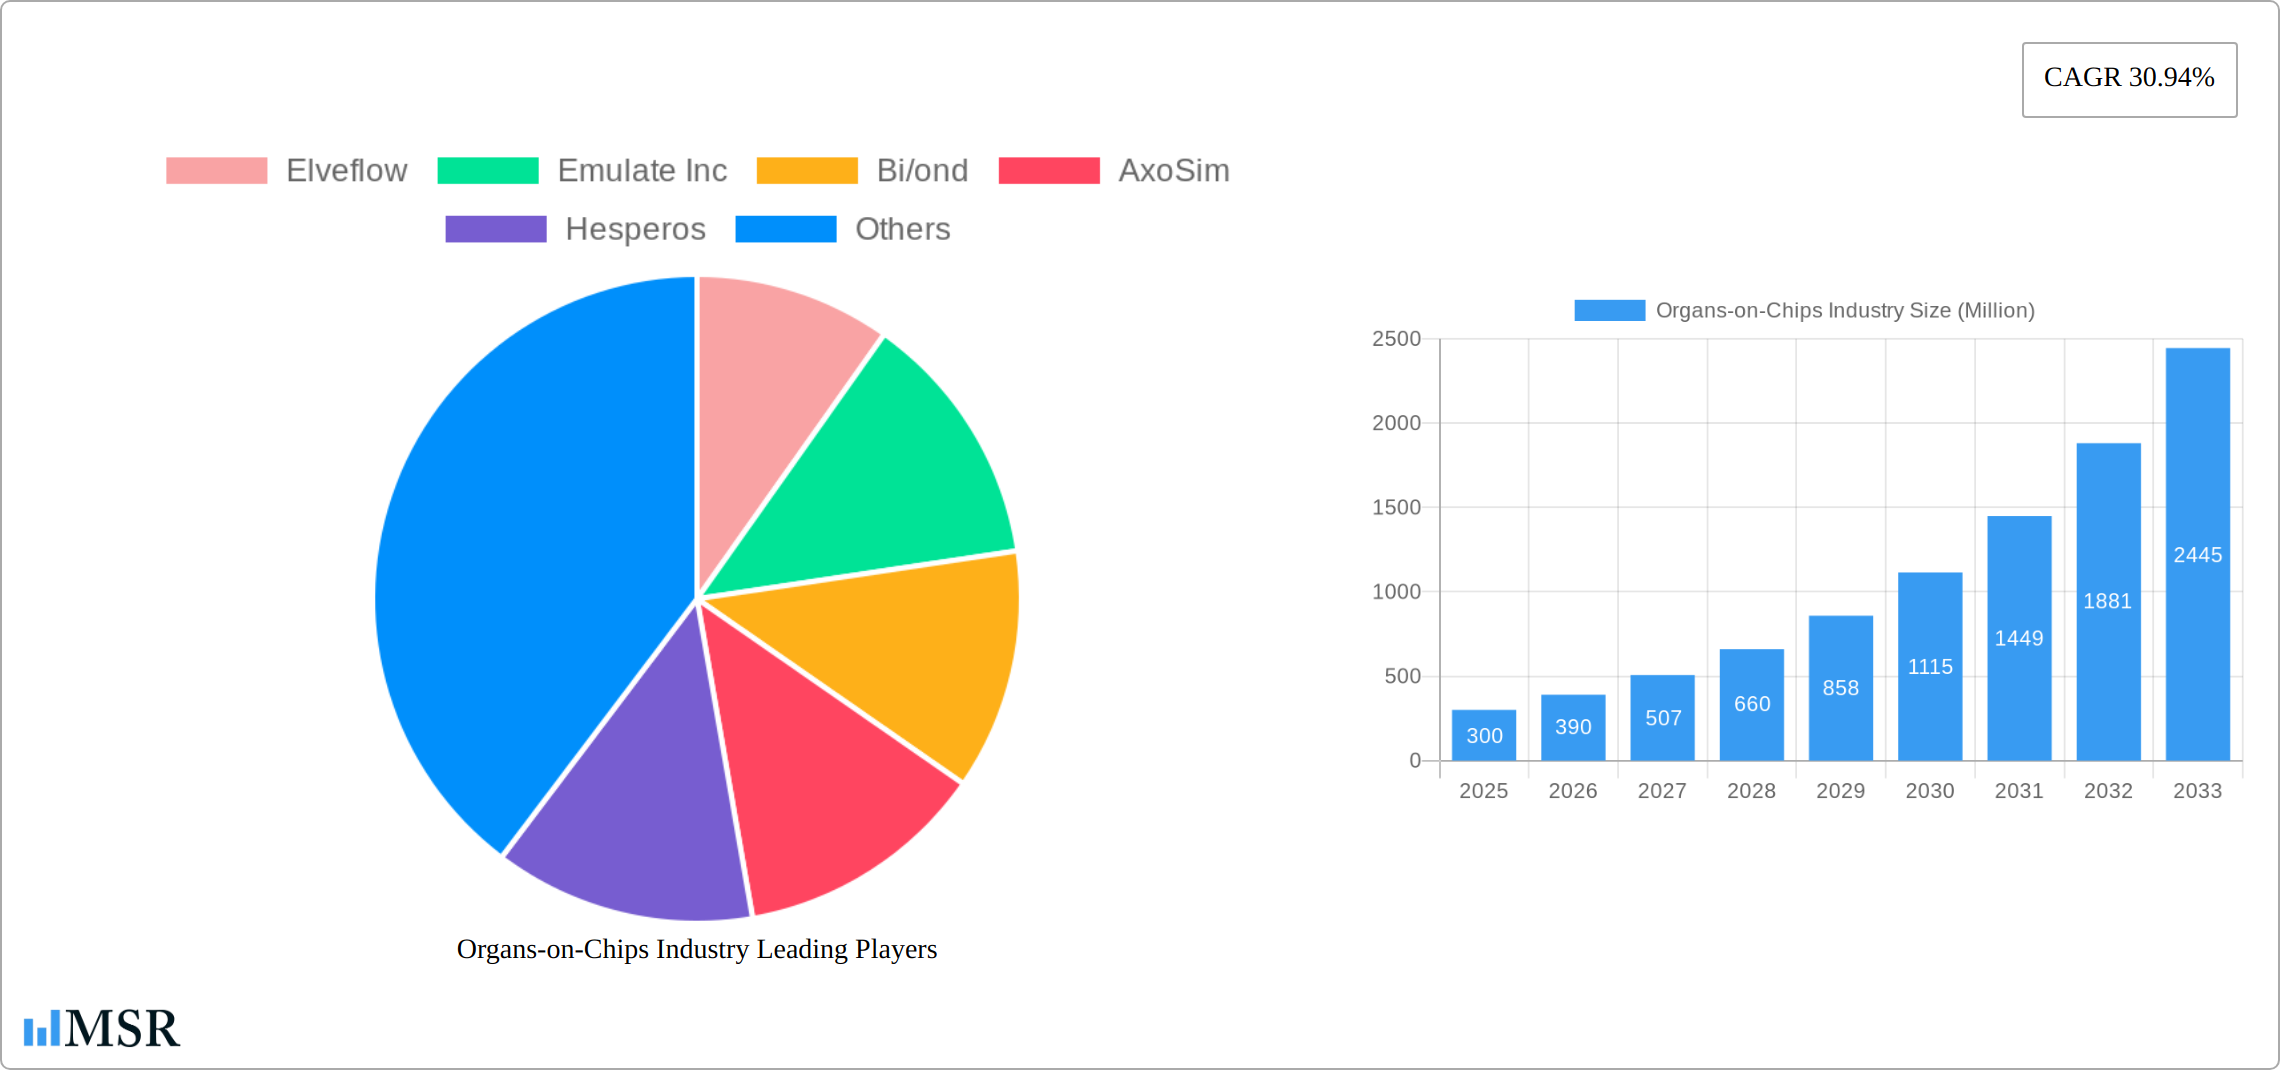
The Organs-on-Chips (OoC) market is experiencing rapid growth, projected to reach a substantial size driven by increasing demand for sophisticated preclinical testing models. The market, valued at $0.3 billion in 2025, exhibits a robust Compound Annual Growth Rate (CAGR) of 30.94%, indicating a significant expansion in the forecast period (2025-2033). This surge is fueled by several key factors. The pharmaceutical and biotechnology industries are increasingly adopting OoC technology to accelerate drug discovery and development, reducing reliance on traditional animal models and enhancing efficiency. The technology offers more accurate physiological simulations, leading to better prediction of drug efficacy and toxicity, a crucial factor in streamlining the costly and time-consuming drug development pipeline. Furthermore, academic and research institutions are actively using OoC for toxicology research and fundamental biological studies, contributing to the market’s growth. The segmented market shows strong demand across various applications (drug discovery, toxicology research), end-users (pharmaceutical companies, research institutes), and organ types (liver, heart, lung), reflecting the technology’s versatility and wide applicability. Technological advancements, such as improved microfluidic devices and increased sophistication in simulating the human body's complex interactions, further contribute to market expansion.
Growth in the OoC market is expected to be geographically diverse. North America currently holds a significant market share, driven by strong research funding and the presence of major pharmaceutical companies. However, other regions, notably Asia-Pacific, are anticipated to witness rapid growth due to increasing healthcare spending and a rising focus on advanced research infrastructure. While the initial investment costs associated with OoC technology may present a restraint, the long-term benefits in terms of cost savings and improved drug development outcomes are expected to outweigh this factor, propelling further market penetration. Competition among numerous established players and emerging companies will likely foster innovation and drive further development of OoC technology, ensuring its continued upward trajectory. The market’s overall trajectory suggests a promising future for Organs-on-Chips, with significant potential for impacting the pharmaceutical, biotechnology, and research landscapes.
Organs-on-Chips Industry: A Comprehensive Market Report (2019-2033)
This comprehensive report provides an in-depth analysis of the Organs-on-Chips industry, encompassing market size, growth drivers, key players, and future trends. With a study period spanning 2019-2033, a base year of 2025, and a forecast period of 2025-2033, this report offers invaluable insights for stakeholders across the pharmaceutical, biotechnology, and research sectors. The market is projected to reach xx Million by 2033, exhibiting a Compound Annual Growth Rate (CAGR) of xx%.
Organs-on-Chips Industry Market Concentration & Dynamics
The Organs-on-Chips market is characterized by a moderately concentrated landscape with several key players vying for market share. While a few companies hold significant positions, the market also exhibits considerable dynamism fueled by continuous innovation and strategic partnerships. The market share distribution in 2025 is estimated as follows: Emulate Inc. (xx%), MIMETAS BV (xx%), and others (xx%). This dynamic landscape is further influenced by:
- Innovation Ecosystems: A robust ecosystem of academic institutions, research centers, and biotech startups continuously pushes the technological boundaries of organ-on-a-chip technology.
- Regulatory Frameworks: The evolving regulatory landscape governing the use of Organs-on-Chips in drug discovery and toxicology testing is a key factor shaping industry growth. Clearer guidelines are needed to accelerate adoption.
- Substitute Products: Traditional in vivo and in vitro testing methods remain the primary competitors, though Organs-on-Chips offer significant advantages in terms of accuracy and cost-effectiveness.
- End-User Trends: The increasing demand for precise and efficient preclinical models is driving the adoption of Organs-on-Chips across pharmaceutical and biotechnology companies, as well as academic and research institutions.
- M&A Activities: The market has witnessed a rise in mergers and acquisitions (M&A) activities, as evidenced by the acquisition of TARA Biosystems by Valo Health in April 2022. Over the historical period (2019-2024), approximately xx M&A deals were recorded in the Organs-on-Chips space. This trend suggests a consolidation phase within the industry.
Organs-on-Chips Industry Industry Insights & Trends
The global Organs-on-Chips market is experiencing robust growth, driven by several key factors. The increasing prevalence of chronic diseases is spurring the demand for more efficient and accurate drug discovery and development methods. This demand, coupled with the technological advancements in microfluidics, 3D cell culture, and bioprinting, has led to a surge in the adoption of Organs-on-Chips technology. This has resulted in the market's expansion from xx Million in 2019 to xx Million in 2024, with a projected value of xx Million in 2025. This substantial growth is forecast to continue throughout the forecast period (2025-2033), with a projected CAGR of xx%. Technological disruptions such as the integration of artificial intelligence (AI) and machine learning (ML) for data analysis and improved model prediction are accelerating growth. Moreover, evolving consumer preferences for personalized medicine are driving further demand for sophisticated, patient-specific models.

Key Markets & Segments Leading Organs-on-Chips Industry
The Organs-on-Chips market is segmented by application, end-user, and organ type. While the market is globally distributed, North America currently holds a dominant position.
Dominant Segments & Drivers:
- Application: Drug discovery remains the leading application segment, fueled by the need for faster and more efficient drug development processes. Toxicology research is another rapidly expanding segment, driven by regulations requiring safer and more accurate toxicity assessments.
- End-User: Pharmaceutical and biotechnology companies are the primary adopters of Organs-on-Chips technology, owing to their substantial R&D budgets and focus on improving drug development outcomes. Academic and research institutions also contribute significantly, driving innovation and expanding the application space.
- Organ Type: Liver, heart, and lung models are currently leading, reflecting the prevalence of related diseases and the need for effective treatment strategies. However, models of other organ types are emerging rapidly.
Dominance Analysis: The dominance of North America stems from a combination of factors including substantial funding for biomedical research, a mature pharmaceutical and biotechnology industry, and a strong regulatory framework supporting innovative technologies. However, other regions like Europe and Asia-Pacific are rapidly gaining ground, driven by increased investments in healthcare R&D and government initiatives to promote scientific advancements.
- North America Growth Drivers: Strong government funding for R&D, high adoption rate by pharmaceutical companies, and presence of leading technology developers.
- Europe Growth Drivers: Robust healthcare infrastructure, focus on personalized medicine research, and supportive government policies.
- Asia-Pacific Growth Drivers: Growing pharmaceutical and biotechnology industries, increasing healthcare expenditure, and government incentives for technological advancements.
Organs-on-Chips Industry Product Developments
Recent advancements in Organs-on-Chips technology include the integration of advanced sensors and imaging techniques for real-time monitoring of cellular responses. This allows for a more precise and nuanced understanding of drug efficacy and toxicity. Furthermore, the development of more sophisticated models incorporating multiple organ systems is enhancing the predictive capabilities of Organs-on-Chips, increasing their value for preclinical studies. These enhancements are pushing Organs-on-Chips toward the forefront of drug discovery and development processes, offering a competitive edge to companies leveraging this technology.
Challenges in the Organs-on-Chips Industry Market
The Organs-on-Chips market faces several challenges hindering widespread adoption:
- High Initial Investment Costs: Setting up Organ-on-a-Chip facilities demands significant upfront investment, particularly in specialized equipment and trained personnel.
- Complex Model Development: Creating robust and reliable Organ-on-a-Chip models requires significant expertise in cell biology, microfluidics, and data analysis. This complexity poses a challenge to smaller companies and research groups.
- Regulatory Uncertainties: The lack of standardized regulatory guidelines for Organs-on-Chips can delay market entry and increase the cost of validation and compliance.
- Limited Scalability: Scaling up Organ-on-a-Chip production to meet high-throughput screening requirements presents significant technical challenges and economic considerations.
Forces Driving Organs-on-Chips Industry Growth
Several factors are driving the growth of the Organs-on-Chips industry:
- Technological Advancements: Continuous innovation in microfluidics, 3D bioprinting, and sensor technology is enhancing the accuracy, complexity, and affordability of Organs-on-Chips.
- Increased Demand for Personalized Medicine: The rising need for personalized treatments is driving demand for patient-specific models and high-throughput drug screening capabilities.
- Regulatory Support: Growing regulatory support for the use of alternative testing methods in drug development is creating favorable conditions for wider adoption.
Challenges in the Organs-on-Chips Industry Market
Long-term growth will hinge on overcoming technological and economic hurdles. Increased investment in R&D to improve scalability and reduce production costs is crucial. Furthermore, building strong collaborations between academia, industry, and regulatory bodies is essential to establish clear guidelines and accelerate the adoption of Organs-on-Chips technology.
Emerging Opportunities in Organs-on-Chips Industry
Emerging opportunities include the expansion into new therapeutic areas, such as infectious diseases and cancer research, and the development of Organs-on-Chips models for personalized medicine. The integration of AI and machine learning to analyze data from Organs-on-Chips experiments also presents a significant opportunity to enhance prediction accuracy and optimize drug development processes.
Leading Players in the Organs-on-Chips Industry Sector
- Elveflow
- Emulate Inc
- Bi/ond
- AxoSim
- Hesperos
- MIMETAS BV
- Altis Biosystems
- BiomimX SRL
- Valo Health (Tara Biosystems Inc)
- Netri
- Nortis Inc
- TissUse GmbH
- Allevi Inc
- InSphero
Key Milestones in Organs-on-Chips Industry Industry
- April 2022: Valo Health acquired TARA Biosystems, strengthening its position in the cardiovascular drug development market.
- May 2022: Emulate upgraded its intestinal organ-on-a-chip, advancing research on inflammatory bowel disease.
Strategic Outlook for Organs-on-Chips Industry Market
The Organs-on-Chips market holds immense potential for growth, driven by technological advancements, increased R&D investment, and the growing demand for personalized medicine. Strategic partnerships and collaborations among industry players will play a pivotal role in accelerating market expansion and establishing Organs-on-Chips as a key technology in drug discovery and development. The future of the market lies in overcoming existing challenges, fostering innovation, and establishing clear regulatory frameworks.
Organs-on-Chips Industry Segmentation
-
1. Organ Type
- 1.1. Liver
- 1.2. Heart
- 1.3. Lung
- 1.4. Other Organ Types
-
2. Application
- 2.1. Drug Discovery
- 2.2. Toxicology Research
- 2.3. Other Applications
-
3. End User
- 3.1. Pharmaceutical and Biotechnology Companies
- 3.2. Academic and Research Institutes
- 3.3. Other End Users
Organs-on-Chips Industry Segmentation By Geography
-
1. North America
- 1.1. United States
- 1.2. Canada
- 1.3. Mexico
-
2. Europe
- 2.1. Germany
- 2.2. United Kingdom
- 2.3. France
- 2.4. Italy
- 2.5. Spain
- 2.6. Rest of Europe
-
3. Asia Pacific
- 3.1. China
- 3.2. Japan
- 3.3. India
- 3.4. Australia
- 3.5. South Korea
- 3.6. Rest of Asia Pacific
- 4. Rest of the World

Organs-on-Chips Industry REPORT HIGHLIGHTS
| Aspects | Details |
|---|---|
| Study Period | 2019-2033 |
| Base Year | 2024 |
| Estimated Year | 2025 |
| Forecast Period | 2025-2033 |
| Historical Period | 2019-2024 |
| Growth Rate | CAGR of 30.94% from 2019-2033 |
| Segmentation |
|
Table of Contents
- 1. Introduction
- 1.1. Research Scope
- 1.2. Market Segmentation
- 1.3. Research Methodology
- 1.4. Definitions and Assumptions
- 2. Executive Summary
- 2.1. Introduction
- 3. Market Dynamics
- 3.1. Introduction
- 3.2. Market Drivers
- 3.2.1. Requirement of Alternative for Animal Testing; Need for Early Detection of Drug Toxicity and New Products Launches
- 3.3. Market Restrains
- 3.3.1. Complexity of Organ-on-chip Models
- 3.4. Market Trends
- 3.4.1. Lung-related Application is Expected to Exhibit a Significant Growth Over the Forecast Period
- 4. Market Factor Analysis
- 4.1. Porters Five Forces
- 4.2. Supply/Value Chain
- 4.3. PESTEL analysis
- 4.4. Market Entropy
- 4.5. Patent/Trademark Analysis
- 5. Global Organs-on-Chips Industry Analysis, Insights and Forecast, 2019-2031
- 5.1. Market Analysis, Insights and Forecast - by Organ Type
- 5.1.1. Liver
- 5.1.2. Heart
- 5.1.3. Lung
- 5.1.4. Other Organ Types
- 5.2. Market Analysis, Insights and Forecast - by Application
- 5.2.1. Drug Discovery
- 5.2.2. Toxicology Research
- 5.2.3. Other Applications
- 5.3. Market Analysis, Insights and Forecast - by End User
- 5.3.1. Pharmaceutical and Biotechnology Companies
- 5.3.2. Academic and Research Institutes
- 5.3.3. Other End Users
- 5.4. Market Analysis, Insights and Forecast - by Region
- 5.4.1. North America
- 5.4.2. Europe
- 5.4.3. Asia Pacific
- 5.4.4. Rest of the World
- 5.1. Market Analysis, Insights and Forecast - by Organ Type
- 6. North America Organs-on-Chips Industry Analysis, Insights and Forecast, 2019-2031
- 6.1. Market Analysis, Insights and Forecast - by Organ Type
- 6.1.1. Liver
- 6.1.2. Heart
- 6.1.3. Lung
- 6.1.4. Other Organ Types
- 6.2. Market Analysis, Insights and Forecast - by Application
- 6.2.1. Drug Discovery
- 6.2.2. Toxicology Research
- 6.2.3. Other Applications
- 6.3. Market Analysis, Insights and Forecast - by End User
- 6.3.1. Pharmaceutical and Biotechnology Companies
- 6.3.2. Academic and Research Institutes
- 6.3.3. Other End Users
- 6.1. Market Analysis, Insights and Forecast - by Organ Type
- 7. Europe Organs-on-Chips Industry Analysis, Insights and Forecast, 2019-2031
- 7.1. Market Analysis, Insights and Forecast - by Organ Type
- 7.1.1. Liver
- 7.1.2. Heart
- 7.1.3. Lung
- 7.1.4. Other Organ Types
- 7.2. Market Analysis, Insights and Forecast - by Application
- 7.2.1. Drug Discovery
- 7.2.2. Toxicology Research
- 7.2.3. Other Applications
- 7.3. Market Analysis, Insights and Forecast - by End User
- 7.3.1. Pharmaceutical and Biotechnology Companies
- 7.3.2. Academic and Research Institutes
- 7.3.3. Other End Users
- 7.1. Market Analysis, Insights and Forecast - by Organ Type
- 8. Asia Pacific Organs-on-Chips Industry Analysis, Insights and Forecast, 2019-2031
- 8.1. Market Analysis, Insights and Forecast - by Organ Type
- 8.1.1. Liver
- 8.1.2. Heart
- 8.1.3. Lung
- 8.1.4. Other Organ Types
- 8.2. Market Analysis, Insights and Forecast - by Application
- 8.2.1. Drug Discovery
- 8.2.2. Toxicology Research
- 8.2.3. Other Applications
- 8.3. Market Analysis, Insights and Forecast - by End User
- 8.3.1. Pharmaceutical and Biotechnology Companies
- 8.3.2. Academic and Research Institutes
- 8.3.3. Other End Users
- 8.1. Market Analysis, Insights and Forecast - by Organ Type
- 9. Rest of the World Organs-on-Chips Industry Analysis, Insights and Forecast, 2019-2031
- 9.1. Market Analysis, Insights and Forecast - by Organ Type
- 9.1.1. Liver
- 9.1.2. Heart
- 9.1.3. Lung
- 9.1.4. Other Organ Types
- 9.2. Market Analysis, Insights and Forecast - by Application
- 9.2.1. Drug Discovery
- 9.2.2. Toxicology Research
- 9.2.3. Other Applications
- 9.3. Market Analysis, Insights and Forecast - by End User
- 9.3.1. Pharmaceutical and Biotechnology Companies
- 9.3.2. Academic and Research Institutes
- 9.3.3. Other End Users
- 9.1. Market Analysis, Insights and Forecast - by Organ Type
- 10. North America Organs-on-Chips Industry Analysis, Insights and Forecast, 2019-2031
- 10.1. Market Analysis, Insights and Forecast - By Country/Sub-region
- 10.1.1 United States
- 10.1.2 Canada
- 10.1.3 Mexico
- 11. Europe Organs-on-Chips Industry Analysis, Insights and Forecast, 2019-2031
- 11.1. Market Analysis, Insights and Forecast - By Country/Sub-region
- 11.1.1 Germany
- 11.1.2 United Kingdom
- 11.1.3 France
- 11.1.4 Spain
- 11.1.5 Italy
- 11.1.6 Spain
- 11.1.7 Belgium
- 11.1.8 Netherland
- 11.1.9 Nordics
- 11.1.10 Rest of Europe
- 12. Asia Pacific Organs-on-Chips Industry Analysis, Insights and Forecast, 2019-2031
- 12.1. Market Analysis, Insights and Forecast - By Country/Sub-region
- 12.1.1 China
- 12.1.2 Japan
- 12.1.3 India
- 12.1.4 South Korea
- 12.1.5 Southeast Asia
- 12.1.6 Australia
- 12.1.7 Indonesia
- 12.1.8 Phillipes
- 12.1.9 Singapore
- 12.1.10 Thailandc
- 12.1.11 Rest of Asia Pacific
- 13. South America Organs-on-Chips Industry Analysis, Insights and Forecast, 2019-2031
- 13.1. Market Analysis, Insights and Forecast - By Country/Sub-region
- 13.1.1 Brazil
- 13.1.2 Argentina
- 13.1.3 Peru
- 13.1.4 Chile
- 13.1.5 Colombia
- 13.1.6 Ecuador
- 13.1.7 Venezuela
- 13.1.8 Rest of South America
- 14. North America Organs-on-Chips Industry Analysis, Insights and Forecast, 2019-2031
- 14.1. Market Analysis, Insights and Forecast - By Country/Sub-region
- 14.1.1 United States
- 14.1.2 Canada
- 14.1.3 Mexico
- 15. MEA Organs-on-Chips Industry Analysis, Insights and Forecast, 2019-2031
- 15.1. Market Analysis, Insights and Forecast - By Country/Sub-region
- 15.1.1 United Arab Emirates
- 15.1.2 Saudi Arabia
- 15.1.3 South Africa
- 15.1.4 Rest of Middle East and Africa
- 16. Competitive Analysis
- 16.1. Global Market Share Analysis 2024
- 16.2. Company Profiles
- 16.2.1 Elveflow
- 16.2.1.1. Overview
- 16.2.1.2. Products
- 16.2.1.3. SWOT Analysis
- 16.2.1.4. Recent Developments
- 16.2.1.5. Financials (Based on Availability)
- 16.2.2 Emulate Inc
- 16.2.2.1. Overview
- 16.2.2.2. Products
- 16.2.2.3. SWOT Analysis
- 16.2.2.4. Recent Developments
- 16.2.2.5. Financials (Based on Availability)
- 16.2.3 Bi/ond
- 16.2.3.1. Overview
- 16.2.3.2. Products
- 16.2.3.3. SWOT Analysis
- 16.2.3.4. Recent Developments
- 16.2.3.5. Financials (Based on Availability)
- 16.2.4 AxoSim
- 16.2.4.1. Overview
- 16.2.4.2. Products
- 16.2.4.3. SWOT Analysis
- 16.2.4.4. Recent Developments
- 16.2.4.5. Financials (Based on Availability)
- 16.2.5 Hesperos
- 16.2.5.1. Overview
- 16.2.5.2. Products
- 16.2.5.3. SWOT Analysis
- 16.2.5.4. Recent Developments
- 16.2.5.5. Financials (Based on Availability)
- 16.2.6 MIMETAS BV
- 16.2.6.1. Overview
- 16.2.6.2. Products
- 16.2.6.3. SWOT Analysis
- 16.2.6.4. Recent Developments
- 16.2.6.5. Financials (Based on Availability)
- 16.2.7 Altis Biosystems
- 16.2.7.1. Overview
- 16.2.7.2. Products
- 16.2.7.3. SWOT Analysis
- 16.2.7.4. Recent Developments
- 16.2.7.5. Financials (Based on Availability)
- 16.2.8 BiomimX SRL
- 16.2.8.1. Overview
- 16.2.8.2. Products
- 16.2.8.3. SWOT Analysis
- 16.2.8.4. Recent Developments
- 16.2.8.5. Financials (Based on Availability)
- 16.2.9 Valo Health (Tara Biosystems Inc )
- 16.2.9.1. Overview
- 16.2.9.2. Products
- 16.2.9.3. SWOT Analysis
- 16.2.9.4. Recent Developments
- 16.2.9.5. Financials (Based on Availability)
- 16.2.10 Netri
- 16.2.10.1. Overview
- 16.2.10.2. Products
- 16.2.10.3. SWOT Analysis
- 16.2.10.4. Recent Developments
- 16.2.10.5. Financials (Based on Availability)
- 16.2.11 Nortis Inc
- 16.2.11.1. Overview
- 16.2.11.2. Products
- 16.2.11.3. SWOT Analysis
- 16.2.11.4. Recent Developments
- 16.2.11.5. Financials (Based on Availability)
- 16.2.12 TissUse GmbH
- 16.2.12.1. Overview
- 16.2.12.2. Products
- 16.2.12.3. SWOT Analysis
- 16.2.12.4. Recent Developments
- 16.2.12.5. Financials (Based on Availability)
- 16.2.13 Allevi Inc
- 16.2.13.1. Overview
- 16.2.13.2. Products
- 16.2.13.3. SWOT Analysis
- 16.2.13.4. Recent Developments
- 16.2.13.5. Financials (Based on Availability)
- 16.2.14 InSphero
- 16.2.14.1. Overview
- 16.2.14.2. Products
- 16.2.14.3. SWOT Analysis
- 16.2.14.4. Recent Developments
- 16.2.14.5. Financials (Based on Availability)
- 16.2.1 Elveflow
List of Figures
- Figure 1: Global Organs-on-Chips Industry Revenue Breakdown (Million, %) by Region 2024 & 2032
- Figure 2: Global Organs-on-Chips Industry Volume Breakdown (K Unit, %) by Region 2024 & 2032
- Figure 3: North America Organs-on-Chips Industry Revenue (Million), by Country 2024 & 2032
- Figure 4: North America Organs-on-Chips Industry Volume (K Unit), by Country 2024 & 2032
- Figure 5: North America Organs-on-Chips Industry Revenue Share (%), by Country 2024 & 2032
- Figure 6: North America Organs-on-Chips Industry Volume Share (%), by Country 2024 & 2032
- Figure 7: Europe Organs-on-Chips Industry Revenue (Million), by Country 2024 & 2032
- Figure 8: Europe Organs-on-Chips Industry Volume (K Unit), by Country 2024 & 2032
- Figure 9: Europe Organs-on-Chips Industry Revenue Share (%), by Country 2024 & 2032
- Figure 10: Europe Organs-on-Chips Industry Volume Share (%), by Country 2024 & 2032
- Figure 11: Asia Pacific Organs-on-Chips Industry Revenue (Million), by Country 2024 & 2032
- Figure 12: Asia Pacific Organs-on-Chips Industry Volume (K Unit), by Country 2024 & 2032
- Figure 13: Asia Pacific Organs-on-Chips Industry Revenue Share (%), by Country 2024 & 2032
- Figure 14: Asia Pacific Organs-on-Chips Industry Volume Share (%), by Country 2024 & 2032
- Figure 15: South America Organs-on-Chips Industry Revenue (Million), by Country 2024 & 2032
- Figure 16: South America Organs-on-Chips Industry Volume (K Unit), by Country 2024 & 2032
- Figure 17: South America Organs-on-Chips Industry Revenue Share (%), by Country 2024 & 2032
- Figure 18: South America Organs-on-Chips Industry Volume Share (%), by Country 2024 & 2032
- Figure 19: North America Organs-on-Chips Industry Revenue (Million), by Country 2024 & 2032
- Figure 20: North America Organs-on-Chips Industry Volume (K Unit), by Country 2024 & 2032
- Figure 21: North America Organs-on-Chips Industry Revenue Share (%), by Country 2024 & 2032
- Figure 22: North America Organs-on-Chips Industry Volume Share (%), by Country 2024 & 2032
- Figure 23: MEA Organs-on-Chips Industry Revenue (Million), by Country 2024 & 2032
- Figure 24: MEA Organs-on-Chips Industry Volume (K Unit), by Country 2024 & 2032
- Figure 25: MEA Organs-on-Chips Industry Revenue Share (%), by Country 2024 & 2032
- Figure 26: MEA Organs-on-Chips Industry Volume Share (%), by Country 2024 & 2032
- Figure 27: North America Organs-on-Chips Industry Revenue (Million), by Organ Type 2024 & 2032
- Figure 28: North America Organs-on-Chips Industry Volume (K Unit), by Organ Type 2024 & 2032
- Figure 29: North America Organs-on-Chips Industry Revenue Share (%), by Organ Type 2024 & 2032
- Figure 30: North America Organs-on-Chips Industry Volume Share (%), by Organ Type 2024 & 2032
- Figure 31: North America Organs-on-Chips Industry Revenue (Million), by Application 2024 & 2032
- Figure 32: North America Organs-on-Chips Industry Volume (K Unit), by Application 2024 & 2032
- Figure 33: North America Organs-on-Chips Industry Revenue Share (%), by Application 2024 & 2032
- Figure 34: North America Organs-on-Chips Industry Volume Share (%), by Application 2024 & 2032
- Figure 35: North America Organs-on-Chips Industry Revenue (Million), by End User 2024 & 2032
- Figure 36: North America Organs-on-Chips Industry Volume (K Unit), by End User 2024 & 2032
- Figure 37: North America Organs-on-Chips Industry Revenue Share (%), by End User 2024 & 2032
- Figure 38: North America Organs-on-Chips Industry Volume Share (%), by End User 2024 & 2032
- Figure 39: North America Organs-on-Chips Industry Revenue (Million), by Country 2024 & 2032
- Figure 40: North America Organs-on-Chips Industry Volume (K Unit), by Country 2024 & 2032
- Figure 41: North America Organs-on-Chips Industry Revenue Share (%), by Country 2024 & 2032
- Figure 42: North America Organs-on-Chips Industry Volume Share (%), by Country 2024 & 2032
- Figure 43: Europe Organs-on-Chips Industry Revenue (Million), by Organ Type 2024 & 2032
- Figure 44: Europe Organs-on-Chips Industry Volume (K Unit), by Organ Type 2024 & 2032
- Figure 45: Europe Organs-on-Chips Industry Revenue Share (%), by Organ Type 2024 & 2032
- Figure 46: Europe Organs-on-Chips Industry Volume Share (%), by Organ Type 2024 & 2032
- Figure 47: Europe Organs-on-Chips Industry Revenue (Million), by Application 2024 & 2032
- Figure 48: Europe Organs-on-Chips Industry Volume (K Unit), by Application 2024 & 2032
- Figure 49: Europe Organs-on-Chips Industry Revenue Share (%), by Application 2024 & 2032
- Figure 50: Europe Organs-on-Chips Industry Volume Share (%), by Application 2024 & 2032
- Figure 51: Europe Organs-on-Chips Industry Revenue (Million), by End User 2024 & 2032
- Figure 52: Europe Organs-on-Chips Industry Volume (K Unit), by End User 2024 & 2032
- Figure 53: Europe Organs-on-Chips Industry Revenue Share (%), by End User 2024 & 2032
- Figure 54: Europe Organs-on-Chips Industry Volume Share (%), by End User 2024 & 2032
- Figure 55: Europe Organs-on-Chips Industry Revenue (Million), by Country 2024 & 2032
- Figure 56: Europe Organs-on-Chips Industry Volume (K Unit), by Country 2024 & 2032
- Figure 57: Europe Organs-on-Chips Industry Revenue Share (%), by Country 2024 & 2032
- Figure 58: Europe Organs-on-Chips Industry Volume Share (%), by Country 2024 & 2032
- Figure 59: Asia Pacific Organs-on-Chips Industry Revenue (Million), by Organ Type 2024 & 2032
- Figure 60: Asia Pacific Organs-on-Chips Industry Volume (K Unit), by Organ Type 2024 & 2032
- Figure 61: Asia Pacific Organs-on-Chips Industry Revenue Share (%), by Organ Type 2024 & 2032
- Figure 62: Asia Pacific Organs-on-Chips Industry Volume Share (%), by Organ Type 2024 & 2032
- Figure 63: Asia Pacific Organs-on-Chips Industry Revenue (Million), by Application 2024 & 2032
- Figure 64: Asia Pacific Organs-on-Chips Industry Volume (K Unit), by Application 2024 & 2032
- Figure 65: Asia Pacific Organs-on-Chips Industry Revenue Share (%), by Application 2024 & 2032
- Figure 66: Asia Pacific Organs-on-Chips Industry Volume Share (%), by Application 2024 & 2032
- Figure 67: Asia Pacific Organs-on-Chips Industry Revenue (Million), by End User 2024 & 2032
- Figure 68: Asia Pacific Organs-on-Chips Industry Volume (K Unit), by End User 2024 & 2032
- Figure 69: Asia Pacific Organs-on-Chips Industry Revenue Share (%), by End User 2024 & 2032
- Figure 70: Asia Pacific Organs-on-Chips Industry Volume Share (%), by End User 2024 & 2032
- Figure 71: Asia Pacific Organs-on-Chips Industry Revenue (Million), by Country 2024 & 2032
- Figure 72: Asia Pacific Organs-on-Chips Industry Volume (K Unit), by Country 2024 & 2032
- Figure 73: Asia Pacific Organs-on-Chips Industry Revenue Share (%), by Country 2024 & 2032
- Figure 74: Asia Pacific Organs-on-Chips Industry Volume Share (%), by Country 2024 & 2032
- Figure 75: Rest of the World Organs-on-Chips Industry Revenue (Million), by Organ Type 2024 & 2032
- Figure 76: Rest of the World Organs-on-Chips Industry Volume (K Unit), by Organ Type 2024 & 2032
- Figure 77: Rest of the World Organs-on-Chips Industry Revenue Share (%), by Organ Type 2024 & 2032
- Figure 78: Rest of the World Organs-on-Chips Industry Volume Share (%), by Organ Type 2024 & 2032
- Figure 79: Rest of the World Organs-on-Chips Industry Revenue (Million), by Application 2024 & 2032
- Figure 80: Rest of the World Organs-on-Chips Industry Volume (K Unit), by Application 2024 & 2032
- Figure 81: Rest of the World Organs-on-Chips Industry Revenue Share (%), by Application 2024 & 2032
- Figure 82: Rest of the World Organs-on-Chips Industry Volume Share (%), by Application 2024 & 2032
- Figure 83: Rest of the World Organs-on-Chips Industry Revenue (Million), by End User 2024 & 2032
- Figure 84: Rest of the World Organs-on-Chips Industry Volume (K Unit), by End User 2024 & 2032
- Figure 85: Rest of the World Organs-on-Chips Industry Revenue Share (%), by End User 2024 & 2032
- Figure 86: Rest of the World Organs-on-Chips Industry Volume Share (%), by End User 2024 & 2032
- Figure 87: Rest of the World Organs-on-Chips Industry Revenue (Million), by Country 2024 & 2032
- Figure 88: Rest of the World Organs-on-Chips Industry Volume (K Unit), by Country 2024 & 2032
- Figure 89: Rest of the World Organs-on-Chips Industry Revenue Share (%), by Country 2024 & 2032
- Figure 90: Rest of the World Organs-on-Chips Industry Volume Share (%), by Country 2024 & 2032
List of Tables
- Table 1: Global Organs-on-Chips Industry Revenue Million Forecast, by Region 2019 & 2032
- Table 2: Global Organs-on-Chips Industry Volume K Unit Forecast, by Region 2019 & 2032
- Table 3: Global Organs-on-Chips Industry Revenue Million Forecast, by Organ Type 2019 & 2032
- Table 4: Global Organs-on-Chips Industry Volume K Unit Forecast, by Organ Type 2019 & 2032
- Table 5: Global Organs-on-Chips Industry Revenue Million Forecast, by Application 2019 & 2032
- Table 6: Global Organs-on-Chips Industry Volume K Unit Forecast, by Application 2019 & 2032
- Table 7: Global Organs-on-Chips Industry Revenue Million Forecast, by End User 2019 & 2032
- Table 8: Global Organs-on-Chips Industry Volume K Unit Forecast, by End User 2019 & 2032
- Table 9: Global Organs-on-Chips Industry Revenue Million Forecast, by Region 2019 & 2032
- Table 10: Global Organs-on-Chips Industry Volume K Unit Forecast, by Region 2019 & 2032
- Table 11: Global Organs-on-Chips Industry Revenue Million Forecast, by Country 2019 & 2032
- Table 12: Global Organs-on-Chips Industry Volume K Unit Forecast, by Country 2019 & 2032
- Table 13: United States Organs-on-Chips Industry Revenue (Million) Forecast, by Application 2019 & 2032
- Table 14: United States Organs-on-Chips Industry Volume (K Unit) Forecast, by Application 2019 & 2032
- Table 15: Canada Organs-on-Chips Industry Revenue (Million) Forecast, by Application 2019 & 2032
- Table 16: Canada Organs-on-Chips Industry Volume (K Unit) Forecast, by Application 2019 & 2032
- Table 17: Mexico Organs-on-Chips Industry Revenue (Million) Forecast, by Application 2019 & 2032
- Table 18: Mexico Organs-on-Chips Industry Volume (K Unit) Forecast, by Application 2019 & 2032
- Table 19: Global Organs-on-Chips Industry Revenue Million Forecast, by Country 2019 & 2032
- Table 20: Global Organs-on-Chips Industry Volume K Unit Forecast, by Country 2019 & 2032
- Table 21: Germany Organs-on-Chips Industry Revenue (Million) Forecast, by Application 2019 & 2032
- Table 22: Germany Organs-on-Chips Industry Volume (K Unit) Forecast, by Application 2019 & 2032
- Table 23: United Kingdom Organs-on-Chips Industry Revenue (Million) Forecast, by Application 2019 & 2032
- Table 24: United Kingdom Organs-on-Chips Industry Volume (K Unit) Forecast, by Application 2019 & 2032
- Table 25: France Organs-on-Chips Industry Revenue (Million) Forecast, by Application 2019 & 2032
- Table 26: France Organs-on-Chips Industry Volume (K Unit) Forecast, by Application 2019 & 2032
- Table 27: Spain Organs-on-Chips Industry Revenue (Million) Forecast, by Application 2019 & 2032
- Table 28: Spain Organs-on-Chips Industry Volume (K Unit) Forecast, by Application 2019 & 2032
- Table 29: Italy Organs-on-Chips Industry Revenue (Million) Forecast, by Application 2019 & 2032
- Table 30: Italy Organs-on-Chips Industry Volume (K Unit) Forecast, by Application 2019 & 2032
- Table 31: Spain Organs-on-Chips Industry Revenue (Million) Forecast, by Application 2019 & 2032
- Table 32: Spain Organs-on-Chips Industry Volume (K Unit) Forecast, by Application 2019 & 2032
- Table 33: Belgium Organs-on-Chips Industry Revenue (Million) Forecast, by Application 2019 & 2032
- Table 34: Belgium Organs-on-Chips Industry Volume (K Unit) Forecast, by Application 2019 & 2032
- Table 35: Netherland Organs-on-Chips Industry Revenue (Million) Forecast, by Application 2019 & 2032
- Table 36: Netherland Organs-on-Chips Industry Volume (K Unit) Forecast, by Application 2019 & 2032
- Table 37: Nordics Organs-on-Chips Industry Revenue (Million) Forecast, by Application 2019 & 2032
- Table 38: Nordics Organs-on-Chips Industry Volume (K Unit) Forecast, by Application 2019 & 2032
- Table 39: Rest of Europe Organs-on-Chips Industry Revenue (Million) Forecast, by Application 2019 & 2032
- Table 40: Rest of Europe Organs-on-Chips Industry Volume (K Unit) Forecast, by Application 2019 & 2032
- Table 41: Global Organs-on-Chips Industry Revenue Million Forecast, by Country 2019 & 2032
- Table 42: Global Organs-on-Chips Industry Volume K Unit Forecast, by Country 2019 & 2032
- Table 43: China Organs-on-Chips Industry Revenue (Million) Forecast, by Application 2019 & 2032
- Table 44: China Organs-on-Chips Industry Volume (K Unit) Forecast, by Application 2019 & 2032
- Table 45: Japan Organs-on-Chips Industry Revenue (Million) Forecast, by Application 2019 & 2032
- Table 46: Japan Organs-on-Chips Industry Volume (K Unit) Forecast, by Application 2019 & 2032
- Table 47: India Organs-on-Chips Industry Revenue (Million) Forecast, by Application 2019 & 2032
- Table 48: India Organs-on-Chips Industry Volume (K Unit) Forecast, by Application 2019 & 2032
- Table 49: South Korea Organs-on-Chips Industry Revenue (Million) Forecast, by Application 2019 & 2032
- Table 50: South Korea Organs-on-Chips Industry Volume (K Unit) Forecast, by Application 2019 & 2032
- Table 51: Southeast Asia Organs-on-Chips Industry Revenue (Million) Forecast, by Application 2019 & 2032
- Table 52: Southeast Asia Organs-on-Chips Industry Volume (K Unit) Forecast, by Application 2019 & 2032
- Table 53: Australia Organs-on-Chips Industry Revenue (Million) Forecast, by Application 2019 & 2032
- Table 54: Australia Organs-on-Chips Industry Volume (K Unit) Forecast, by Application 2019 & 2032
- Table 55: Indonesia Organs-on-Chips Industry Revenue (Million) Forecast, by Application 2019 & 2032
- Table 56: Indonesia Organs-on-Chips Industry Volume (K Unit) Forecast, by Application 2019 & 2032
- Table 57: Phillipes Organs-on-Chips Industry Revenue (Million) Forecast, by Application 2019 & 2032
- Table 58: Phillipes Organs-on-Chips Industry Volume (K Unit) Forecast, by Application 2019 & 2032
- Table 59: Singapore Organs-on-Chips Industry Revenue (Million) Forecast, by Application 2019 & 2032
- Table 60: Singapore Organs-on-Chips Industry Volume (K Unit) Forecast, by Application 2019 & 2032
- Table 61: Thailandc Organs-on-Chips Industry Revenue (Million) Forecast, by Application 2019 & 2032
- Table 62: Thailandc Organs-on-Chips Industry Volume (K Unit) Forecast, by Application 2019 & 2032
- Table 63: Rest of Asia Pacific Organs-on-Chips Industry Revenue (Million) Forecast, by Application 2019 & 2032
- Table 64: Rest of Asia Pacific Organs-on-Chips Industry Volume (K Unit) Forecast, by Application 2019 & 2032
- Table 65: Global Organs-on-Chips Industry Revenue Million Forecast, by Country 2019 & 2032
- Table 66: Global Organs-on-Chips Industry Volume K Unit Forecast, by Country 2019 & 2032
- Table 67: Brazil Organs-on-Chips Industry Revenue (Million) Forecast, by Application 2019 & 2032
- Table 68: Brazil Organs-on-Chips Industry Volume (K Unit) Forecast, by Application 2019 & 2032
- Table 69: Argentina Organs-on-Chips Industry Revenue (Million) Forecast, by Application 2019 & 2032
- Table 70: Argentina Organs-on-Chips Industry Volume (K Unit) Forecast, by Application 2019 & 2032
- Table 71: Peru Organs-on-Chips Industry Revenue (Million) Forecast, by Application 2019 & 2032
- Table 72: Peru Organs-on-Chips Industry Volume (K Unit) Forecast, by Application 2019 & 2032
- Table 73: Chile Organs-on-Chips Industry Revenue (Million) Forecast, by Application 2019 & 2032
- Table 74: Chile Organs-on-Chips Industry Volume (K Unit) Forecast, by Application 2019 & 2032
- Table 75: Colombia Organs-on-Chips Industry Revenue (Million) Forecast, by Application 2019 & 2032
- Table 76: Colombia Organs-on-Chips Industry Volume (K Unit) Forecast, by Application 2019 & 2032
- Table 77: Ecuador Organs-on-Chips Industry Revenue (Million) Forecast, by Application 2019 & 2032
- Table 78: Ecuador Organs-on-Chips Industry Volume (K Unit) Forecast, by Application 2019 & 2032
- Table 79: Venezuela Organs-on-Chips Industry Revenue (Million) Forecast, by Application 2019 & 2032
- Table 80: Venezuela Organs-on-Chips Industry Volume (K Unit) Forecast, by Application 2019 & 2032
- Table 81: Rest of South America Organs-on-Chips Industry Revenue (Million) Forecast, by Application 2019 & 2032
- Table 82: Rest of South America Organs-on-Chips Industry Volume (K Unit) Forecast, by Application 2019 & 2032
- Table 83: Global Organs-on-Chips Industry Revenue Million Forecast, by Country 2019 & 2032
- Table 84: Global Organs-on-Chips Industry Volume K Unit Forecast, by Country 2019 & 2032
- Table 85: United States Organs-on-Chips Industry Revenue (Million) Forecast, by Application 2019 & 2032
- Table 86: United States Organs-on-Chips Industry Volume (K Unit) Forecast, by Application 2019 & 2032
- Table 87: Canada Organs-on-Chips Industry Revenue (Million) Forecast, by Application 2019 & 2032
- Table 88: Canada Organs-on-Chips Industry Volume (K Unit) Forecast, by Application 2019 & 2032
- Table 89: Mexico Organs-on-Chips Industry Revenue (Million) Forecast, by Application 2019 & 2032
- Table 90: Mexico Organs-on-Chips Industry Volume (K Unit) Forecast, by Application 2019 & 2032
- Table 91: Global Organs-on-Chips Industry Revenue Million Forecast, by Country 2019 & 2032
- Table 92: Global Organs-on-Chips Industry Volume K Unit Forecast, by Country 2019 & 2032
- Table 93: United Arab Emirates Organs-on-Chips Industry Revenue (Million) Forecast, by Application 2019 & 2032
- Table 94: United Arab Emirates Organs-on-Chips Industry Volume (K Unit) Forecast, by Application 2019 & 2032
- Table 95: Saudi Arabia Organs-on-Chips Industry Revenue (Million) Forecast, by Application 2019 & 2032
- Table 96: Saudi Arabia Organs-on-Chips Industry Volume (K Unit) Forecast, by Application 2019 & 2032
- Table 97: South Africa Organs-on-Chips Industry Revenue (Million) Forecast, by Application 2019 & 2032
- Table 98: South Africa Organs-on-Chips Industry Volume (K Unit) Forecast, by Application 2019 & 2032
- Table 99: Rest of Middle East and Africa Organs-on-Chips Industry Revenue (Million) Forecast, by Application 2019 & 2032
- Table 100: Rest of Middle East and Africa Organs-on-Chips Industry Volume (K Unit) Forecast, by Application 2019 & 2032
- Table 101: Global Organs-on-Chips Industry Revenue Million Forecast, by Organ Type 2019 & 2032
- Table 102: Global Organs-on-Chips Industry Volume K Unit Forecast, by Organ Type 2019 & 2032
- Table 103: Global Organs-on-Chips Industry Revenue Million Forecast, by Application 2019 & 2032
- Table 104: Global Organs-on-Chips Industry Volume K Unit Forecast, by Application 2019 & 2032
- Table 105: Global Organs-on-Chips Industry Revenue Million Forecast, by End User 2019 & 2032
- Table 106: Global Organs-on-Chips Industry Volume K Unit Forecast, by End User 2019 & 2032
- Table 107: Global Organs-on-Chips Industry Revenue Million Forecast, by Country 2019 & 2032
- Table 108: Global Organs-on-Chips Industry Volume K Unit Forecast, by Country 2019 & 2032
- Table 109: United States Organs-on-Chips Industry Revenue (Million) Forecast, by Application 2019 & 2032
- Table 110: United States Organs-on-Chips Industry Volume (K Unit) Forecast, by Application 2019 & 2032
- Table 111: Canada Organs-on-Chips Industry Revenue (Million) Forecast, by Application 2019 & 2032
- Table 112: Canada Organs-on-Chips Industry Volume (K Unit) Forecast, by Application 2019 & 2032
- Table 113: Mexico Organs-on-Chips Industry Revenue (Million) Forecast, by Application 2019 & 2032
- Table 114: Mexico Organs-on-Chips Industry Volume (K Unit) Forecast, by Application 2019 & 2032
- Table 115: Global Organs-on-Chips Industry Revenue Million Forecast, by Organ Type 2019 & 2032
- Table 116: Global Organs-on-Chips Industry Volume K Unit Forecast, by Organ Type 2019 & 2032
- Table 117: Global Organs-on-Chips Industry Revenue Million Forecast, by Application 2019 & 2032
- Table 118: Global Organs-on-Chips Industry Volume K Unit Forecast, by Application 2019 & 2032
- Table 119: Global Organs-on-Chips Industry Revenue Million Forecast, by End User 2019 & 2032
- Table 120: Global Organs-on-Chips Industry Volume K Unit Forecast, by End User 2019 & 2032
- Table 121: Global Organs-on-Chips Industry Revenue Million Forecast, by Country 2019 & 2032
- Table 122: Global Organs-on-Chips Industry Volume K Unit Forecast, by Country 2019 & 2032
- Table 123: Germany Organs-on-Chips Industry Revenue (Million) Forecast, by Application 2019 & 2032
- Table 124: Germany Organs-on-Chips Industry Volume (K Unit) Forecast, by Application 2019 & 2032
- Table 125: United Kingdom Organs-on-Chips Industry Revenue (Million) Forecast, by Application 2019 & 2032
- Table 126: United Kingdom Organs-on-Chips Industry Volume (K Unit) Forecast, by Application 2019 & 2032
- Table 127: France Organs-on-Chips Industry Revenue (Million) Forecast, by Application 2019 & 2032
- Table 128: France Organs-on-Chips Industry Volume (K Unit) Forecast, by Application 2019 & 2032
- Table 129: Italy Organs-on-Chips Industry Revenue (Million) Forecast, by Application 2019 & 2032
- Table 130: Italy Organs-on-Chips Industry Volume (K Unit) Forecast, by Application 2019 & 2032
- Table 131: Spain Organs-on-Chips Industry Revenue (Million) Forecast, by Application 2019 & 2032
- Table 132: Spain Organs-on-Chips Industry Volume (K Unit) Forecast, by Application 2019 & 2032
- Table 133: Rest of Europe Organs-on-Chips Industry Revenue (Million) Forecast, by Application 2019 & 2032
- Table 134: Rest of Europe Organs-on-Chips Industry Volume (K Unit) Forecast, by Application 2019 & 2032
- Table 135: Global Organs-on-Chips Industry Revenue Million Forecast, by Organ Type 2019 & 2032
- Table 136: Global Organs-on-Chips Industry Volume K Unit Forecast, by Organ Type 2019 & 2032
- Table 137: Global Organs-on-Chips Industry Revenue Million Forecast, by Application 2019 & 2032
- Table 138: Global Organs-on-Chips Industry Volume K Unit Forecast, by Application 2019 & 2032
- Table 139: Global Organs-on-Chips Industry Revenue Million Forecast, by End User 2019 & 2032
- Table 140: Global Organs-on-Chips Industry Volume K Unit Forecast, by End User 2019 & 2032
- Table 141: Global Organs-on-Chips Industry Revenue Million Forecast, by Country 2019 & 2032
- Table 142: Global Organs-on-Chips Industry Volume K Unit Forecast, by Country 2019 & 2032
- Table 143: China Organs-on-Chips Industry Revenue (Million) Forecast, by Application 2019 & 2032
- Table 144: China Organs-on-Chips Industry Volume (K Unit) Forecast, by Application 2019 & 2032
- Table 145: Japan Organs-on-Chips Industry Revenue (Million) Forecast, by Application 2019 & 2032
- Table 146: Japan Organs-on-Chips Industry Volume (K Unit) Forecast, by Application 2019 & 2032
- Table 147: India Organs-on-Chips Industry Revenue (Million) Forecast, by Application 2019 & 2032
- Table 148: India Organs-on-Chips Industry Volume (K Unit) Forecast, by Application 2019 & 2032
- Table 149: Australia Organs-on-Chips Industry Revenue (Million) Forecast, by Application 2019 & 2032
- Table 150: Australia Organs-on-Chips Industry Volume (K Unit) Forecast, by Application 2019 & 2032
- Table 151: South Korea Organs-on-Chips Industry Revenue (Million) Forecast, by Application 2019 & 2032
- Table 152: South Korea Organs-on-Chips Industry Volume (K Unit) Forecast, by Application 2019 & 2032
- Table 153: Rest of Asia Pacific Organs-on-Chips Industry Revenue (Million) Forecast, by Application 2019 & 2032
- Table 154: Rest of Asia Pacific Organs-on-Chips Industry Volume (K Unit) Forecast, by Application 2019 & 2032
- Table 155: Global Organs-on-Chips Industry Revenue Million Forecast, by Organ Type 2019 & 2032
- Table 156: Global Organs-on-Chips Industry Volume K Unit Forecast, by Organ Type 2019 & 2032
- Table 157: Global Organs-on-Chips Industry Revenue Million Forecast, by Application 2019 & 2032
- Table 158: Global Organs-on-Chips Industry Volume K Unit Forecast, by Application 2019 & 2032
- Table 159: Global Organs-on-Chips Industry Revenue Million Forecast, by End User 2019 & 2032
- Table 160: Global Organs-on-Chips Industry Volume K Unit Forecast, by End User 2019 & 2032
- Table 161: Global Organs-on-Chips Industry Revenue Million Forecast, by Country 2019 & 2032
- Table 162: Global Organs-on-Chips Industry Volume K Unit Forecast, by Country 2019 & 2032
Frequently Asked Questions
1. What is the projected Compound Annual Growth Rate (CAGR) of the Organs-on-Chips Industry?
The projected CAGR is approximately 30.94%.
2. Which companies are prominent players in the Organs-on-Chips Industry?
Key companies in the market include Elveflow, Emulate Inc, Bi/ond, AxoSim, Hesperos, MIMETAS BV, Altis Biosystems, BiomimX SRL, Valo Health (Tara Biosystems Inc ), Netri, Nortis Inc, TissUse GmbH, Allevi Inc, InSphero.
3. What are the main segments of the Organs-on-Chips Industry?
The market segments include Organ Type, Application, End User.
4. Can you provide details about the market size?
The market size is estimated to be USD 0.3 Million as of 2022.
5. What are some drivers contributing to market growth?
Requirement of Alternative for Animal Testing; Need for Early Detection of Drug Toxicity and New Products Launches.
6. What are the notable trends driving market growth?
Lung-related Application is Expected to Exhibit a Significant Growth Over the Forecast Period.
7. Are there any restraints impacting market growth?
Complexity of Organ-on-chip Models.
8. Can you provide examples of recent developments in the market?
May 2022 : Emulate upgraded its intestinal organ-on-a-chip for researchers studying inflammatory bowel disease.
9. What pricing options are available for accessing the report?
Pricing options include single-user, multi-user, and enterprise licenses priced at USD 4750, USD 5250, and USD 8750 respectively.
10. Is the market size provided in terms of value or volume?
The market size is provided in terms of value, measured in Million and volume, measured in K Unit.
11. Are there any specific market keywords associated with the report?
Yes, the market keyword associated with the report is "Organs-on-Chips Industry," which aids in identifying and referencing the specific market segment covered.
12. How do I determine which pricing option suits my needs best?
The pricing options vary based on user requirements and access needs. Individual users may opt for single-user licenses, while businesses requiring broader access may choose multi-user or enterprise licenses for cost-effective access to the report.
13. Are there any additional resources or data provided in the Organs-on-Chips Industry report?
While the report offers comprehensive insights, it's advisable to review the specific contents or supplementary materials provided to ascertain if additional resources or data are available.
14. How can I stay updated on further developments or reports in the Organs-on-Chips Industry?
To stay informed about further developments, trends, and reports in the Organs-on-Chips Industry, consider subscribing to industry newsletters, following relevant companies and organizations, or regularly checking reputable industry news sources and publications.
Methodology
Step 1 - Identification of Relevant Samples Size from Population Database


Step 2 - Approaches for Defining Global Market Size (Value, Volume* & Price*)

Note*: In applicable scenarios
Step 3 - Data Sources
Primary Research
- Web Analytics
- Survey Reports
- Research Institute
- Latest Research Reports
- Opinion Leaders
Secondary Research
- Annual Reports
- White Paper
- Latest Press Release
- Industry Association
- Paid Database
- Investor Presentations

Step 4 - Data Triangulation
Involves using different sources of information in order to increase the validity of a study
These sources are likely to be stakeholders in a program - participants, other researchers, program staff, other community members, and so on.
Then we put all data in single framework & apply various statistical tools to find out the dynamic on the market.
During the analysis stage, feedback from the stakeholder groups would be compared to determine areas of agreement as well as areas of divergence
