

Key Insights
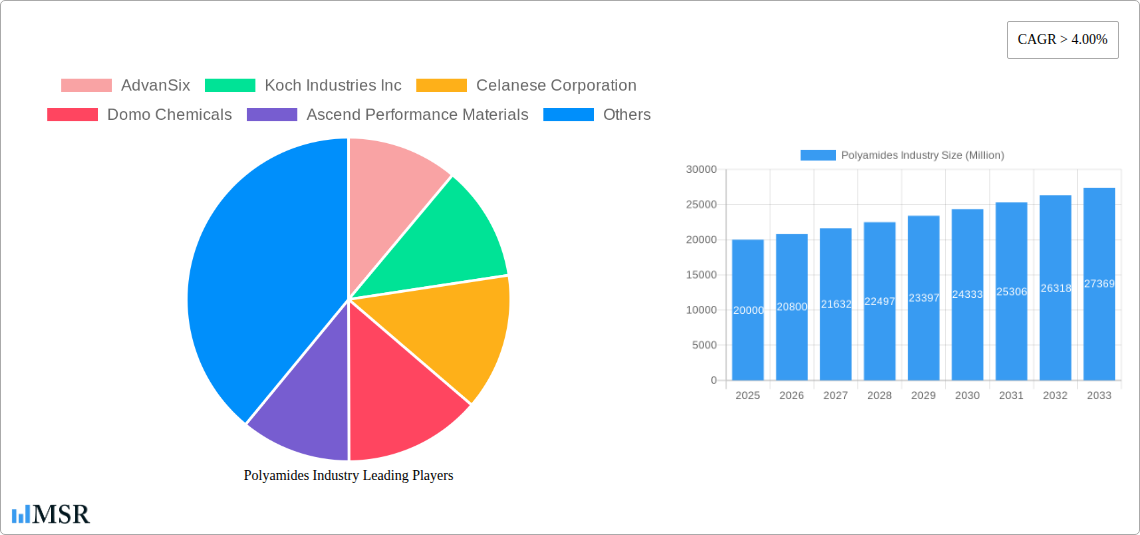
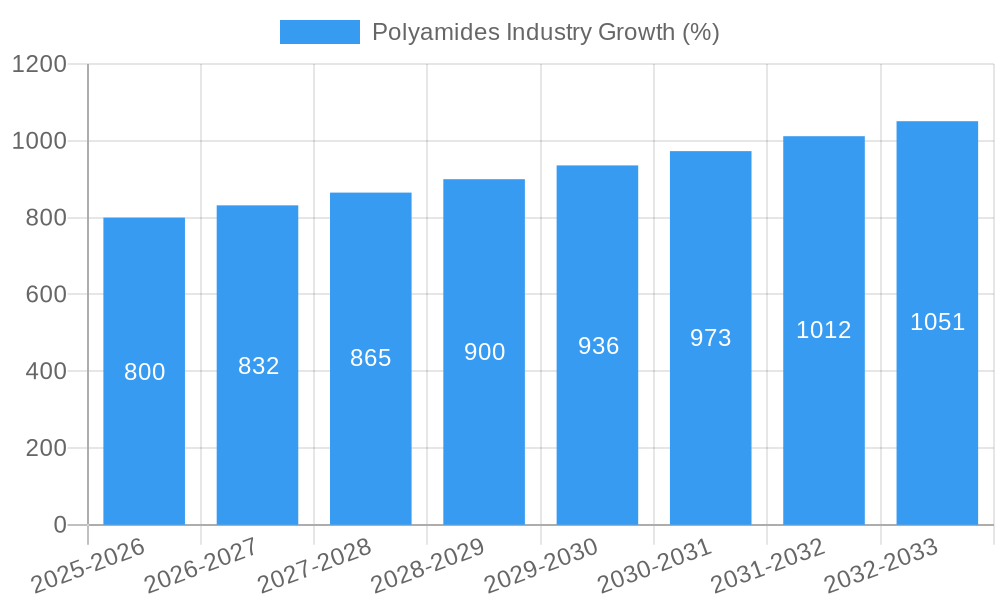
The global polyamides market is experiencing robust growth, projected to maintain a Compound Annual Growth Rate (CAGR) exceeding 4.00% from 2025 to 2033. This expansion is fueled by several key drivers. The increasing demand from the automotive industry, particularly for lightweighting applications, is a significant factor. The burgeoning construction sector, with its need for durable and high-performance materials in infrastructure projects and buildings, further contributes to market growth. Furthermore, the electronics and electrical sectors are adopting polyamides for their insulation and protective properties in various components. Technological advancements in polyamide formulations, leading to improved material properties such as enhanced strength, flexibility, and thermal resistance, are also driving market expansion. Growth is being observed across diverse resin types, including Aramid, Polyamide (PA6), and Polyphthalamide (PPA), each catering to specific application needs. Major players like AdvanSix, Koch Industries, Celanese, and BASF are strategically investing in research and development to maintain their market position and capitalize on emerging opportunities.
However, the market faces some challenges. Fluctuations in raw material prices, particularly for petroleum-based precursors, can impact profitability. Concerns about environmental sustainability and the lifecycle impact of polyamide production are also prompting increased scrutiny and driving the search for more sustainable alternatives. Despite these restraints, the overall market outlook remains positive, driven by sustained demand from key end-use industries and ongoing innovation in material science. The market segmentation by end-user industry (Aerospace, Automotive, Building & Construction, Electrical & Electronics, Industrial & Machinery, Packaging) and resin type (Aramid, Polyamide (PA6), Polyamide (PA66), Polyphthalamide) provides a detailed understanding of the market dynamics and allows for targeted strategies. Assuming a 2025 market size of $20 billion (a reasonable estimate given the considerable size of the involved industries and the provided CAGR), we can project substantial growth in the coming years.
Polyamides Industry Market Report: 2019-2033 Forecast
This comprehensive report provides a detailed analysis of the Polyamides Industry, covering market dynamics, key segments, leading players, and future growth prospects. The study period spans from 2019 to 2033, with 2025 as the base and estimated year. This report is essential for industry stakeholders, investors, and businesses seeking to understand and capitalize on the opportunities within this dynamic market. The global polyamides market is projected to reach xx Million by 2033, exhibiting a CAGR of xx% during the forecast period (2025-2033).
Polyamides Industry Market Concentration & Dynamics
The global polyamides market exhibits a moderately concentrated structure, with several major players holding significant market share. AdvanSix, Koch Industries Inc, Celanese Corporation, Domo Chemicals, Ascend Performance Materials, LANXESS, Highsun Holding Group, BASF SE, LIBOLO, and Hangzhou Juheshun New Materials Co Ltd are key players shaping the industry landscape. Market share dynamics are influenced by factors such as innovation, M&A activity, and regulatory changes. The industry is characterized by a robust innovation ecosystem, with ongoing research and development leading to the introduction of new polyamide grades with enhanced properties. Stricter environmental regulations are pushing manufacturers towards sustainable production methods and the development of bio-based polyamides. Substitute products, such as other engineering plastics, pose a competitive threat, especially in price-sensitive segments. End-user trends toward lightweighting and higher performance materials drive demand for advanced polyamide grades.
- Market Concentration: The top five players account for approximately xx% of the global market share (2024).
- M&A Activity: The past five years have witnessed xx major mergers and acquisitions in the polyamides industry, significantly impacting market consolidation.
- Innovation Ecosystem: Significant R&D investments drive the development of high-performance, sustainable polyamide solutions.
- Regulatory Landscape: Stringent environmental regulations globally are influencing manufacturing processes and product development.
- Substitute Products: Competition from other engineering plastics and bio-based alternatives continues to intensify.
Polyamides Industry Industry Insights & Trends
The global polyamides market is experiencing robust growth driven by increasing demand across diverse end-use industries. Key growth drivers include the automotive industry’s push for lightweighting and fuel efficiency, expanding electronic devices requiring high-performance polymers, and the construction sector's adoption of durable and sustainable building materials. Technological advancements in polyamide synthesis and processing are leading to the development of high-strength, high-temperature, and chemically resistant materials, further expanding applications. Evolving consumer preferences toward sustainable and eco-friendly products are driving the demand for bio-based and recycled polyamides. The market size was valued at xx Million in 2024 and is projected to reach xx Million by 2033, exhibiting a significant CAGR of xx%. The growing adoption of sustainable practices and increasing consumer awareness are positively impacting market growth.
Key Markets & Segments Leading Polyamides Industry
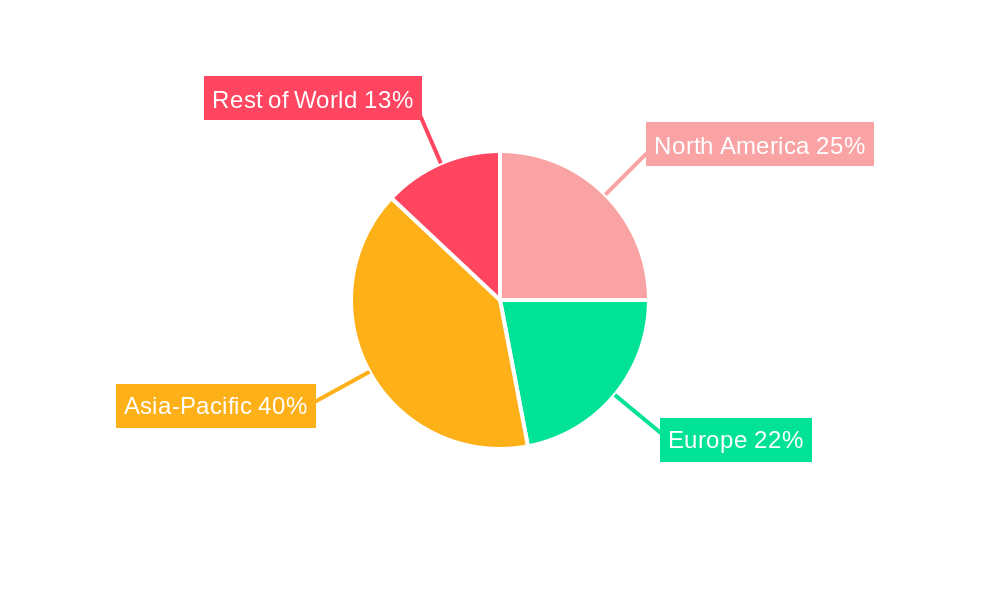
The automotive sector is currently the leading end-user industry for polyamides, followed by the electrical and electronics sector. The Asia-Pacific region dominates the global polyamide market due to rapid industrialization, significant automotive production, and strong economic growth. Within resin types, polyamide (PA) holds the largest market share owing to its versatility and wide range of applications.
- Dominant Region: Asia-Pacific (driven by China and India's rapid industrialization).
- Leading End-Use Industry: Automotive (lightweighting and fuel efficiency requirements).
- Largest Resin Type Segment: Polyamide (PA) (versatility and extensive applications).
Drivers:
- Automotive: Lightweighting trends, stringent fuel efficiency regulations, increasing vehicle production.
- Electrical & Electronics: Demand for high-performance insulation materials in electronics and electrical appliances.
- Building & Construction: Use in pipes, coatings, and other construction materials.
- Economic Growth: Expansion of industrial sectors in developing economies.
- Infrastructure Development: Growing investments in infrastructure projects.
Polyamides Industry Product Developments
Recent product innovations focus on enhancing material properties like strength, durability, and sustainability. Several manufacturers have introduced new polyamide grades with improved thermal resistance, chemical resistance, and flame retardancy. The development of bio-based and recycled polyamides addresses environmental concerns and reduces reliance on fossil fuels. These advancements are broadening the applications of polyamides in various sectors, providing manufacturers with a competitive edge.
Challenges in the Polyamides Industry Market
The polyamides industry faces challenges such as fluctuating raw material prices, supply chain disruptions, intense competition from substitute materials, and the increasing complexity of regulatory compliance. These factors can significantly impact profitability and market growth. For example, the xx% increase in raw material costs in 2024 affected profit margins across the industry.
Forces Driving Polyamides Industry Growth
Technological advancements, such as the development of high-performance polyamide grades with improved properties, drive market growth. Strong economic growth in emerging economies boosts demand, while supportive government policies promoting sustainable materials further accelerate market expansion. The automotive industry's shift towards electric vehicles is creating a substantial demand for lightweighting materials, further fueling the growth of the polyamides market.
Challenges in the Polyamides Industry Market
Long-term growth hinges on innovation in sustainable materials, strategic partnerships to secure raw material supplies and expand market reach, and successful penetration into new high-growth markets. Continued R&D investment in bio-based and recycled polyamides is crucial for long-term sustainability and competitive advantage.
Emerging Opportunities in Polyamides Industry
Emerging opportunities include expanding into new high-growth markets (e.g., renewable energy, aerospace), developing advanced polyamide composites with enhanced performance characteristics, and leveraging digital technologies for improved manufacturing efficiency and supply chain management. Growing consumer demand for sustainable products presents significant opportunities for manufacturers offering bio-based and recycled polyamides.
Leading Players in the Polyamides Industry Sector
- AdvanSix
- Koch Industries Inc
- Celanese Corporation
- Domo Chemicals
- Ascend Performance Materials
- LANXESS
- Highsun Holding Group
- BASF SE
- LIBOLO
- Hangzhou Juheshun New Materials Co Ltd
Key Milestones in Polyamides Industry Industry
- July 2022: BASF SE announced plans to expand its ultramid polyamide grade production capacity in India. This expansion demonstrates the growing demand for polyamides in high-growth markets.
- September 2022: LANXESS introduced Durethan ECO, a sustainable polyamide resin, showcasing the industry's commitment to environmentally friendly solutions.
- November 2022: Celanese Corporation acquired DuPont's Mobility & Materials business, significantly strengthening its position in the engineered thermoplastics market.
Strategic Outlook for Polyamides Industry Market
The polyamides market is poised for continued growth, driven by technological innovation, expanding applications, and the increasing adoption of sustainable materials. Strategic partnerships, targeted R&D investments, and expansion into new high-growth markets will be critical for sustained success. Focusing on developing high-performance, sustainable polyamide solutions will be crucial for capturing market share and achieving long-term growth.
Polyamides Industry Segmentation
-
1. End User Industry
- 1.1. Aerospace
- 1.2. Automotive
- 1.3. Building and Construction
- 1.4. Electrical and Electronics
- 1.5. Industrial and Machinery
- 1.6. Packaging
- 1.7. Other End-user Industries
-
2. Sub Resin Type
- 2.1. Aramid
- 2.2. Polyamide (PA) 6
- 2.3. Polyamide (PA) 66
- 2.4. Polyphthalamide
Polyamides Industry Segmentation By Geography
-
1. North America
- 1.1. United States
- 1.2. Canada
- 1.3. Mexico
-
2. South America
- 2.1. Brazil
- 2.2. Argentina
- 2.3. Rest of South America
-
3. Europe
- 3.1. United Kingdom
- 3.2. Germany
- 3.3. France
- 3.4. Italy
- 3.5. Spain
- 3.6. Russia
- 3.7. Benelux
- 3.8. Nordics
- 3.9. Rest of Europe
-
4. Middle East & Africa
- 4.1. Turkey
- 4.2. Israel
- 4.3. GCC
- 4.4. North Africa
- 4.5. South Africa
- 4.6. Rest of Middle East & Africa
-
5. Asia Pacific
- 5.1. China
- 5.2. India
- 5.3. Japan
- 5.4. South Korea
- 5.5. ASEAN
- 5.6. Oceania
- 5.7. Rest of Asia Pacific
Polyamides Industry REPORT HIGHLIGHTS
| Aspects | Details |
|---|---|
| Study Period | 2019-2033 |
| Base Year | 2024 |
| Estimated Year | 2025 |
| Forecast Period | 2025-2033 |
| Historical Period | 2019-2024 |
| Growth Rate | CAGR of > 4.00% from 2019-2033 |
| Segmentation |
|
Table of Contents
- 1. Introduction
- 1.1. Research Scope
- 1.2. Market Segmentation
- 1.3. Research Methodology
- 1.4. Definitions and Assumptions
- 2. Executive Summary
- 2.1. Introduction
- 3. Market Dynamics
- 3.1. Introduction
- 3.2. Market Drivers
- 3.2.1. Rapidly Growing Demand from the Poultry Industry; Increased Intake of Human Nutritional Supplements; Other Drivers
- 3.3. Market Restrains
- 3.3.1. Outbreak of Animal Diseases; Other Restraints
- 3.4. Market Trends
- 3.4.1. shift toward innovation and sustainability
- 4. Market Factor Analysis
- 4.1. Porters Five Forces
- 4.2. Supply/Value Chain
- 4.3. PESTEL analysis
- 4.4. Market Entropy
- 4.5. Patent/Trademark Analysis
- 5. Global Polyamides Industry Analysis, Insights and Forecast, 2019-2031
- 5.1. Market Analysis, Insights and Forecast - by End User Industry
- 5.1.1. Aerospace
- 5.1.2. Automotive
- 5.1.3. Building and Construction
- 5.1.4. Electrical and Electronics
- 5.1.5. Industrial and Machinery
- 5.1.6. Packaging
- 5.1.7. Other End-user Industries
- 5.2. Market Analysis, Insights and Forecast - by Sub Resin Type
- 5.2.1. Aramid
- 5.2.2. Polyamide (PA) 6
- 5.2.3. Polyamide (PA) 66
- 5.2.4. Polyphthalamide
- 5.3. Market Analysis, Insights and Forecast - by Region
- 5.3.1. North America
- 5.3.2. South America
- 5.3.3. Europe
- 5.3.4. Middle East & Africa
- 5.3.5. Asia Pacific
- 5.1. Market Analysis, Insights and Forecast - by End User Industry
- 6. North America Polyamides Industry Analysis, Insights and Forecast, 2019-2031
- 6.1. Market Analysis, Insights and Forecast - by End User Industry
- 6.1.1. Aerospace
- 6.1.2. Automotive
- 6.1.3. Building and Construction
- 6.1.4. Electrical and Electronics
- 6.1.5. Industrial and Machinery
- 6.1.6. Packaging
- 6.1.7. Other End-user Industries
- 6.2. Market Analysis, Insights and Forecast - by Sub Resin Type
- 6.2.1. Aramid
- 6.2.2. Polyamide (PA) 6
- 6.2.3. Polyamide (PA) 66
- 6.2.4. Polyphthalamide
- 6.1. Market Analysis, Insights and Forecast - by End User Industry
- 7. South America Polyamides Industry Analysis, Insights and Forecast, 2019-2031
- 7.1. Market Analysis, Insights and Forecast - by End User Industry
- 7.1.1. Aerospace
- 7.1.2. Automotive
- 7.1.3. Building and Construction
- 7.1.4. Electrical and Electronics
- 7.1.5. Industrial and Machinery
- 7.1.6. Packaging
- 7.1.7. Other End-user Industries
- 7.2. Market Analysis, Insights and Forecast - by Sub Resin Type
- 7.2.1. Aramid
- 7.2.2. Polyamide (PA) 6
- 7.2.3. Polyamide (PA) 66
- 7.2.4. Polyphthalamide
- 7.1. Market Analysis, Insights and Forecast - by End User Industry
- 8. Europe Polyamides Industry Analysis, Insights and Forecast, 2019-2031
- 8.1. Market Analysis, Insights and Forecast - by End User Industry
- 8.1.1. Aerospace
- 8.1.2. Automotive
- 8.1.3. Building and Construction
- 8.1.4. Electrical and Electronics
- 8.1.5. Industrial and Machinery
- 8.1.6. Packaging
- 8.1.7. Other End-user Industries
- 8.2. Market Analysis, Insights and Forecast - by Sub Resin Type
- 8.2.1. Aramid
- 8.2.2. Polyamide (PA) 6
- 8.2.3. Polyamide (PA) 66
- 8.2.4. Polyphthalamide
- 8.1. Market Analysis, Insights and Forecast - by End User Industry
- 9. Middle East & Africa Polyamides Industry Analysis, Insights and Forecast, 2019-2031
- 9.1. Market Analysis, Insights and Forecast - by End User Industry
- 9.1.1. Aerospace
- 9.1.2. Automotive
- 9.1.3. Building and Construction
- 9.1.4. Electrical and Electronics
- 9.1.5. Industrial and Machinery
- 9.1.6. Packaging
- 9.1.7. Other End-user Industries
- 9.2. Market Analysis, Insights and Forecast - by Sub Resin Type
- 9.2.1. Aramid
- 9.2.2. Polyamide (PA) 6
- 9.2.3. Polyamide (PA) 66
- 9.2.4. Polyphthalamide
- 9.1. Market Analysis, Insights and Forecast - by End User Industry
- 10. Asia Pacific Polyamides Industry Analysis, Insights and Forecast, 2019-2031
- 10.1. Market Analysis, Insights and Forecast - by End User Industry
- 10.1.1. Aerospace
- 10.1.2. Automotive
- 10.1.3. Building and Construction
- 10.1.4. Electrical and Electronics
- 10.1.5. Industrial and Machinery
- 10.1.6. Packaging
- 10.1.7. Other End-user Industries
- 10.2. Market Analysis, Insights and Forecast - by Sub Resin Type
- 10.2.1. Aramid
- 10.2.2. Polyamide (PA) 6
- 10.2.3. Polyamide (PA) 66
- 10.2.4. Polyphthalamide
- 10.1. Market Analysis, Insights and Forecast - by End User Industry
- 11. Competitive Analysis
- 11.1. Global Market Share Analysis 2024
- 11.2. Company Profiles
- 11.2.1 AdvanSix
- 11.2.1.1. Overview
- 11.2.1.2. Products
- 11.2.1.3. SWOT Analysis
- 11.2.1.4. Recent Developments
- 11.2.1.5. Financials (Based on Availability)
- 11.2.2 Koch Industries Inc
- 11.2.2.1. Overview
- 11.2.2.2. Products
- 11.2.2.3. SWOT Analysis
- 11.2.2.4. Recent Developments
- 11.2.2.5. Financials (Based on Availability)
- 11.2.3 Celanese Corporation
- 11.2.3.1. Overview
- 11.2.3.2. Products
- 11.2.3.3. SWOT Analysis
- 11.2.3.4. Recent Developments
- 11.2.3.5. Financials (Based on Availability)
- 11.2.4 Domo Chemicals
- 11.2.4.1. Overview
- 11.2.4.2. Products
- 11.2.4.3. SWOT Analysis
- 11.2.4.4. Recent Developments
- 11.2.4.5. Financials (Based on Availability)
- 11.2.5 Ascend Performance Materials
- 11.2.5.1. Overview
- 11.2.5.2. Products
- 11.2.5.3. SWOT Analysis
- 11.2.5.4. Recent Developments
- 11.2.5.5. Financials (Based on Availability)
- 11.2.6 LANXESS
- 11.2.6.1. Overview
- 11.2.6.2. Products
- 11.2.6.3. SWOT Analysis
- 11.2.6.4. Recent Developments
- 11.2.6.5. Financials (Based on Availability)
- 11.2.7 Highsun Holding Group
- 11.2.7.1. Overview
- 11.2.7.2. Products
- 11.2.7.3. SWOT Analysis
- 11.2.7.4. Recent Developments
- 11.2.7.5. Financials (Based on Availability)
- 11.2.8 BASF SE
- 11.2.8.1. Overview
- 11.2.8.2. Products
- 11.2.8.3. SWOT Analysis
- 11.2.8.4. Recent Developments
- 11.2.8.5. Financials (Based on Availability)
- 11.2.9 LIBOLO
- 11.2.9.1. Overview
- 11.2.9.2. Products
- 11.2.9.3. SWOT Analysis
- 11.2.9.4. Recent Developments
- 11.2.9.5. Financials (Based on Availability)
- 11.2.10 Hangzhou Juheshun New Materials Co Ltd
- 11.2.10.1. Overview
- 11.2.10.2. Products
- 11.2.10.3. SWOT Analysis
- 11.2.10.4. Recent Developments
- 11.2.10.5. Financials (Based on Availability)
- 11.2.1 AdvanSix
List of Figures
- Figure 1: Global Polyamides Industry Revenue Breakdown (Million, %) by Region 2024 & 2032
- Figure 2: Global Polyamides Industry Volume Breakdown (K Tons, %) by Region 2024 & 2032
- Figure 3: North America Polyamides Industry Revenue (Million), by End User Industry 2024 & 2032
- Figure 4: North America Polyamides Industry Volume (K Tons), by End User Industry 2024 & 2032
- Figure 5: North America Polyamides Industry Revenue Share (%), by End User Industry 2024 & 2032
- Figure 6: North America Polyamides Industry Volume Share (%), by End User Industry 2024 & 2032
- Figure 7: North America Polyamides Industry Revenue (Million), by Sub Resin Type 2024 & 2032
- Figure 8: North America Polyamides Industry Volume (K Tons), by Sub Resin Type 2024 & 2032
- Figure 9: North America Polyamides Industry Revenue Share (%), by Sub Resin Type 2024 & 2032
- Figure 10: North America Polyamides Industry Volume Share (%), by Sub Resin Type 2024 & 2032
- Figure 11: North America Polyamides Industry Revenue (Million), by Country 2024 & 2032
- Figure 12: North America Polyamides Industry Volume (K Tons), by Country 2024 & 2032
- Figure 13: North America Polyamides Industry Revenue Share (%), by Country 2024 & 2032
- Figure 14: North America Polyamides Industry Volume Share (%), by Country 2024 & 2032
- Figure 15: South America Polyamides Industry Revenue (Million), by End User Industry 2024 & 2032
- Figure 16: South America Polyamides Industry Volume (K Tons), by End User Industry 2024 & 2032
- Figure 17: South America Polyamides Industry Revenue Share (%), by End User Industry 2024 & 2032
- Figure 18: South America Polyamides Industry Volume Share (%), by End User Industry 2024 & 2032
- Figure 19: South America Polyamides Industry Revenue (Million), by Sub Resin Type 2024 & 2032
- Figure 20: South America Polyamides Industry Volume (K Tons), by Sub Resin Type 2024 & 2032
- Figure 21: South America Polyamides Industry Revenue Share (%), by Sub Resin Type 2024 & 2032
- Figure 22: South America Polyamides Industry Volume Share (%), by Sub Resin Type 2024 & 2032
- Figure 23: South America Polyamides Industry Revenue (Million), by Country 2024 & 2032
- Figure 24: South America Polyamides Industry Volume (K Tons), by Country 2024 & 2032
- Figure 25: South America Polyamides Industry Revenue Share (%), by Country 2024 & 2032
- Figure 26: South America Polyamides Industry Volume Share (%), by Country 2024 & 2032
- Figure 27: Europe Polyamides Industry Revenue (Million), by End User Industry 2024 & 2032
- Figure 28: Europe Polyamides Industry Volume (K Tons), by End User Industry 2024 & 2032
- Figure 29: Europe Polyamides Industry Revenue Share (%), by End User Industry 2024 & 2032
- Figure 30: Europe Polyamides Industry Volume Share (%), by End User Industry 2024 & 2032
- Figure 31: Europe Polyamides Industry Revenue (Million), by Sub Resin Type 2024 & 2032
- Figure 32: Europe Polyamides Industry Volume (K Tons), by Sub Resin Type 2024 & 2032
- Figure 33: Europe Polyamides Industry Revenue Share (%), by Sub Resin Type 2024 & 2032
- Figure 34: Europe Polyamides Industry Volume Share (%), by Sub Resin Type 2024 & 2032
- Figure 35: Europe Polyamides Industry Revenue (Million), by Country 2024 & 2032
- Figure 36: Europe Polyamides Industry Volume (K Tons), by Country 2024 & 2032
- Figure 37: Europe Polyamides Industry Revenue Share (%), by Country 2024 & 2032
- Figure 38: Europe Polyamides Industry Volume Share (%), by Country 2024 & 2032
- Figure 39: Middle East & Africa Polyamides Industry Revenue (Million), by End User Industry 2024 & 2032
- Figure 40: Middle East & Africa Polyamides Industry Volume (K Tons), by End User Industry 2024 & 2032
- Figure 41: Middle East & Africa Polyamides Industry Revenue Share (%), by End User Industry 2024 & 2032
- Figure 42: Middle East & Africa Polyamides Industry Volume Share (%), by End User Industry 2024 & 2032
- Figure 43: Middle East & Africa Polyamides Industry Revenue (Million), by Sub Resin Type 2024 & 2032
- Figure 44: Middle East & Africa Polyamides Industry Volume (K Tons), by Sub Resin Type 2024 & 2032
- Figure 45: Middle East & Africa Polyamides Industry Revenue Share (%), by Sub Resin Type 2024 & 2032
- Figure 46: Middle East & Africa Polyamides Industry Volume Share (%), by Sub Resin Type 2024 & 2032
- Figure 47: Middle East & Africa Polyamides Industry Revenue (Million), by Country 2024 & 2032
- Figure 48: Middle East & Africa Polyamides Industry Volume (K Tons), by Country 2024 & 2032
- Figure 49: Middle East & Africa Polyamides Industry Revenue Share (%), by Country 2024 & 2032
- Figure 50: Middle East & Africa Polyamides Industry Volume Share (%), by Country 2024 & 2032
- Figure 51: Asia Pacific Polyamides Industry Revenue (Million), by End User Industry 2024 & 2032
- Figure 52: Asia Pacific Polyamides Industry Volume (K Tons), by End User Industry 2024 & 2032
- Figure 53: Asia Pacific Polyamides Industry Revenue Share (%), by End User Industry 2024 & 2032
- Figure 54: Asia Pacific Polyamides Industry Volume Share (%), by End User Industry 2024 & 2032
- Figure 55: Asia Pacific Polyamides Industry Revenue (Million), by Sub Resin Type 2024 & 2032
- Figure 56: Asia Pacific Polyamides Industry Volume (K Tons), by Sub Resin Type 2024 & 2032
- Figure 57: Asia Pacific Polyamides Industry Revenue Share (%), by Sub Resin Type 2024 & 2032
- Figure 58: Asia Pacific Polyamides Industry Volume Share (%), by Sub Resin Type 2024 & 2032
- Figure 59: Asia Pacific Polyamides Industry Revenue (Million), by Country 2024 & 2032
- Figure 60: Asia Pacific Polyamides Industry Volume (K Tons), by Country 2024 & 2032
- Figure 61: Asia Pacific Polyamides Industry Revenue Share (%), by Country 2024 & 2032
- Figure 62: Asia Pacific Polyamides Industry Volume Share (%), by Country 2024 & 2032
List of Tables
- Table 1: Global Polyamides Industry Revenue Million Forecast, by Region 2019 & 2032
- Table 2: Global Polyamides Industry Volume K Tons Forecast, by Region 2019 & 2032
- Table 3: Global Polyamides Industry Revenue Million Forecast, by End User Industry 2019 & 2032
- Table 4: Global Polyamides Industry Volume K Tons Forecast, by End User Industry 2019 & 2032
- Table 5: Global Polyamides Industry Revenue Million Forecast, by Sub Resin Type 2019 & 2032
- Table 6: Global Polyamides Industry Volume K Tons Forecast, by Sub Resin Type 2019 & 2032
- Table 7: Global Polyamides Industry Revenue Million Forecast, by Region 2019 & 2032
- Table 8: Global Polyamides Industry Volume K Tons Forecast, by Region 2019 & 2032
- Table 9: Global Polyamides Industry Revenue Million Forecast, by End User Industry 2019 & 2032
- Table 10: Global Polyamides Industry Volume K Tons Forecast, by End User Industry 2019 & 2032
- Table 11: Global Polyamides Industry Revenue Million Forecast, by Sub Resin Type 2019 & 2032
- Table 12: Global Polyamides Industry Volume K Tons Forecast, by Sub Resin Type 2019 & 2032
- Table 13: Global Polyamides Industry Revenue Million Forecast, by Country 2019 & 2032
- Table 14: Global Polyamides Industry Volume K Tons Forecast, by Country 2019 & 2032
- Table 15: United States Polyamides Industry Revenue (Million) Forecast, by Application 2019 & 2032
- Table 16: United States Polyamides Industry Volume (K Tons) Forecast, by Application 2019 & 2032
- Table 17: Canada Polyamides Industry Revenue (Million) Forecast, by Application 2019 & 2032
- Table 18: Canada Polyamides Industry Volume (K Tons) Forecast, by Application 2019 & 2032
- Table 19: Mexico Polyamides Industry Revenue (Million) Forecast, by Application 2019 & 2032
- Table 20: Mexico Polyamides Industry Volume (K Tons) Forecast, by Application 2019 & 2032
- Table 21: Global Polyamides Industry Revenue Million Forecast, by End User Industry 2019 & 2032
- Table 22: Global Polyamides Industry Volume K Tons Forecast, by End User Industry 2019 & 2032
- Table 23: Global Polyamides Industry Revenue Million Forecast, by Sub Resin Type 2019 & 2032
- Table 24: Global Polyamides Industry Volume K Tons Forecast, by Sub Resin Type 2019 & 2032
- Table 25: Global Polyamides Industry Revenue Million Forecast, by Country 2019 & 2032
- Table 26: Global Polyamides Industry Volume K Tons Forecast, by Country 2019 & 2032
- Table 27: Brazil Polyamides Industry Revenue (Million) Forecast, by Application 2019 & 2032
- Table 28: Brazil Polyamides Industry Volume (K Tons) Forecast, by Application 2019 & 2032
- Table 29: Argentina Polyamides Industry Revenue (Million) Forecast, by Application 2019 & 2032
- Table 30: Argentina Polyamides Industry Volume (K Tons) Forecast, by Application 2019 & 2032
- Table 31: Rest of South America Polyamides Industry Revenue (Million) Forecast, by Application 2019 & 2032
- Table 32: Rest of South America Polyamides Industry Volume (K Tons) Forecast, by Application 2019 & 2032
- Table 33: Global Polyamides Industry Revenue Million Forecast, by End User Industry 2019 & 2032
- Table 34: Global Polyamides Industry Volume K Tons Forecast, by End User Industry 2019 & 2032
- Table 35: Global Polyamides Industry Revenue Million Forecast, by Sub Resin Type 2019 & 2032
- Table 36: Global Polyamides Industry Volume K Tons Forecast, by Sub Resin Type 2019 & 2032
- Table 37: Global Polyamides Industry Revenue Million Forecast, by Country 2019 & 2032
- Table 38: Global Polyamides Industry Volume K Tons Forecast, by Country 2019 & 2032
- Table 39: United Kingdom Polyamides Industry Revenue (Million) Forecast, by Application 2019 & 2032
- Table 40: United Kingdom Polyamides Industry Volume (K Tons) Forecast, by Application 2019 & 2032
- Table 41: Germany Polyamides Industry Revenue (Million) Forecast, by Application 2019 & 2032
- Table 42: Germany Polyamides Industry Volume (K Tons) Forecast, by Application 2019 & 2032
- Table 43: France Polyamides Industry Revenue (Million) Forecast, by Application 2019 & 2032
- Table 44: France Polyamides Industry Volume (K Tons) Forecast, by Application 2019 & 2032
- Table 45: Italy Polyamides Industry Revenue (Million) Forecast, by Application 2019 & 2032
- Table 46: Italy Polyamides Industry Volume (K Tons) Forecast, by Application 2019 & 2032
- Table 47: Spain Polyamides Industry Revenue (Million) Forecast, by Application 2019 & 2032
- Table 48: Spain Polyamides Industry Volume (K Tons) Forecast, by Application 2019 & 2032
- Table 49: Russia Polyamides Industry Revenue (Million) Forecast, by Application 2019 & 2032
- Table 50: Russia Polyamides Industry Volume (K Tons) Forecast, by Application 2019 & 2032
- Table 51: Benelux Polyamides Industry Revenue (Million) Forecast, by Application 2019 & 2032
- Table 52: Benelux Polyamides Industry Volume (K Tons) Forecast, by Application 2019 & 2032
- Table 53: Nordics Polyamides Industry Revenue (Million) Forecast, by Application 2019 & 2032
- Table 54: Nordics Polyamides Industry Volume (K Tons) Forecast, by Application 2019 & 2032
- Table 55: Rest of Europe Polyamides Industry Revenue (Million) Forecast, by Application 2019 & 2032
- Table 56: Rest of Europe Polyamides Industry Volume (K Tons) Forecast, by Application 2019 & 2032
- Table 57: Global Polyamides Industry Revenue Million Forecast, by End User Industry 2019 & 2032
- Table 58: Global Polyamides Industry Volume K Tons Forecast, by End User Industry 2019 & 2032
- Table 59: Global Polyamides Industry Revenue Million Forecast, by Sub Resin Type 2019 & 2032
- Table 60: Global Polyamides Industry Volume K Tons Forecast, by Sub Resin Type 2019 & 2032
- Table 61: Global Polyamides Industry Revenue Million Forecast, by Country 2019 & 2032
- Table 62: Global Polyamides Industry Volume K Tons Forecast, by Country 2019 & 2032
- Table 63: Turkey Polyamides Industry Revenue (Million) Forecast, by Application 2019 & 2032
- Table 64: Turkey Polyamides Industry Volume (K Tons) Forecast, by Application 2019 & 2032
- Table 65: Israel Polyamides Industry Revenue (Million) Forecast, by Application 2019 & 2032
- Table 66: Israel Polyamides Industry Volume (K Tons) Forecast, by Application 2019 & 2032
- Table 67: GCC Polyamides Industry Revenue (Million) Forecast, by Application 2019 & 2032
- Table 68: GCC Polyamides Industry Volume (K Tons) Forecast, by Application 2019 & 2032
- Table 69: North Africa Polyamides Industry Revenue (Million) Forecast, by Application 2019 & 2032
- Table 70: North Africa Polyamides Industry Volume (K Tons) Forecast, by Application 2019 & 2032
- Table 71: South Africa Polyamides Industry Revenue (Million) Forecast, by Application 2019 & 2032
- Table 72: South Africa Polyamides Industry Volume (K Tons) Forecast, by Application 2019 & 2032
- Table 73: Rest of Middle East & Africa Polyamides Industry Revenue (Million) Forecast, by Application 2019 & 2032
- Table 74: Rest of Middle East & Africa Polyamides Industry Volume (K Tons) Forecast, by Application 2019 & 2032
- Table 75: Global Polyamides Industry Revenue Million Forecast, by End User Industry 2019 & 2032
- Table 76: Global Polyamides Industry Volume K Tons Forecast, by End User Industry 2019 & 2032
- Table 77: Global Polyamides Industry Revenue Million Forecast, by Sub Resin Type 2019 & 2032
- Table 78: Global Polyamides Industry Volume K Tons Forecast, by Sub Resin Type 2019 & 2032
- Table 79: Global Polyamides Industry Revenue Million Forecast, by Country 2019 & 2032
- Table 80: Global Polyamides Industry Volume K Tons Forecast, by Country 2019 & 2032
- Table 81: China Polyamides Industry Revenue (Million) Forecast, by Application 2019 & 2032
- Table 82: China Polyamides Industry Volume (K Tons) Forecast, by Application 2019 & 2032
- Table 83: India Polyamides Industry Revenue (Million) Forecast, by Application 2019 & 2032
- Table 84: India Polyamides Industry Volume (K Tons) Forecast, by Application 2019 & 2032
- Table 85: Japan Polyamides Industry Revenue (Million) Forecast, by Application 2019 & 2032
- Table 86: Japan Polyamides Industry Volume (K Tons) Forecast, by Application 2019 & 2032
- Table 87: South Korea Polyamides Industry Revenue (Million) Forecast, by Application 2019 & 2032
- Table 88: South Korea Polyamides Industry Volume (K Tons) Forecast, by Application 2019 & 2032
- Table 89: ASEAN Polyamides Industry Revenue (Million) Forecast, by Application 2019 & 2032
- Table 90: ASEAN Polyamides Industry Volume (K Tons) Forecast, by Application 2019 & 2032
- Table 91: Oceania Polyamides Industry Revenue (Million) Forecast, by Application 2019 & 2032
- Table 92: Oceania Polyamides Industry Volume (K Tons) Forecast, by Application 2019 & 2032
- Table 93: Rest of Asia Pacific Polyamides Industry Revenue (Million) Forecast, by Application 2019 & 2032
- Table 94: Rest of Asia Pacific Polyamides Industry Volume (K Tons) Forecast, by Application 2019 & 2032
Frequently Asked Questions
1. What is the projected Compound Annual Growth Rate (CAGR) of the Polyamides Industry?
The projected CAGR is approximately > 4.00%.
2. Which companies are prominent players in the Polyamides Industry?
Key companies in the market include AdvanSix, Koch Industries Inc, Celanese Corporation, Domo Chemicals, Ascend Performance Materials, LANXESS, Highsun Holding Group, BASF SE, LIBOLO, Hangzhou Juheshun New Materials Co Ltd.
3. What are the main segments of the Polyamides Industry?
The market segments include End User Industry, Sub Resin Type.
4. Can you provide details about the market size?
The market size is estimated to be USD XX Million as of 2022.
5. What are some drivers contributing to market growth?
Rapidly Growing Demand from the Poultry Industry; Increased Intake of Human Nutritional Supplements; Other Drivers.
6. What are the notable trends driving market growth?
shift toward innovation and sustainability.
7. Are there any restraints impacting market growth?
Outbreak of Animal Diseases; Other Restraints.
8. Can you provide examples of recent developments in the market?
November 2022: Celanese Corporation completed the acquisition of the Mobility & Materials (“M&M”) business of DuPont. This acquisition enhanced the company's product portfolio of engineered thermoplastics through the addition of well-recognized brands and intellectual properties of DuPont.September 2022: LANXESS introduced a sustainable polyamide resin, Durethan ECO, which consists of recycled fibers made from waste glass to reduce its carbon footprint.July 2022: BASF SE announced plans to expand its ultramid polyamide grade production capacity in India to meet the growing demand from automotive, electrical and electronics, industrial, and consumer goods applications.
9. What pricing options are available for accessing the report?
Pricing options include single-user, multi-user, and enterprise licenses priced at USD 3800, USD 4500, and USD 5800 respectively.
10. Is the market size provided in terms of value or volume?
The market size is provided in terms of value, measured in Million and volume, measured in K Tons.
11. Are there any specific market keywords associated with the report?
Yes, the market keyword associated with the report is "Polyamides Industry," which aids in identifying and referencing the specific market segment covered.
12. How do I determine which pricing option suits my needs best?
The pricing options vary based on user requirements and access needs. Individual users may opt for single-user licenses, while businesses requiring broader access may choose multi-user or enterprise licenses for cost-effective access to the report.
13. Are there any additional resources or data provided in the Polyamides Industry report?
While the report offers comprehensive insights, it's advisable to review the specific contents or supplementary materials provided to ascertain if additional resources or data are available.
14. How can I stay updated on further developments or reports in the Polyamides Industry?
To stay informed about further developments, trends, and reports in the Polyamides Industry, consider subscribing to industry newsletters, following relevant companies and organizations, or regularly checking reputable industry news sources and publications.
Methodology
Step 1 - Identification of Relevant Samples Size from Population Database


Step 2 - Approaches for Defining Global Market Size (Value, Volume* & Price*)

Note*: In applicable scenarios
Step 3 - Data Sources
Primary Research
- Web Analytics
- Survey Reports
- Research Institute
- Latest Research Reports
- Opinion Leaders
Secondary Research
- Annual Reports
- White Paper
- Latest Press Release
- Industry Association
- Paid Database
- Investor Presentations

Step 4 - Data Triangulation
Involves using different sources of information in order to increase the validity of a study
These sources are likely to be stakeholders in a program - participants, other researchers, program staff, other community members, and so on.
Then we put all data in single framework & apply various statistical tools to find out the dynamic on the market.
During the analysis stage, feedback from the stakeholder groups would be compared to determine areas of agreement as well as areas of divergence
