

Key Insights
The global sizing agent market, valued at $3.9 billion in 2025, is projected to experience robust growth, driven by a compound annual growth rate (CAGR) of 4% from 2025 to 2033. This expansion is fueled by several key factors. The burgeoning textile and paper industries represent significant demand drivers, with advancements in sustainable sizing techniques further boosting market adoption. The increasing focus on enhanced product quality and performance across various applications, including cosmetics, food and beverages, and pharmaceuticals, also contributes to market growth. Growth is further propelled by the rising demand for high-performance sizing agents in specialized applications, such as advanced composites and high-strength materials. While the market faces certain challenges, such as fluctuating raw material prices and stringent environmental regulations, the overall growth trajectory remains positive. Innovation in sustainable and bio-based sizing agents is expected to mitigate some of these constraints, creating new opportunities for market players. Regional growth will likely be diverse, with established markets in North America and Europe experiencing steady growth, while rapidly developing economies in Asia-Pacific, particularly China and India, are anticipated to show significant expansion potential.
The competitive landscape is characterized by a mix of established multinational corporations and regional players. Companies are focusing on strategic partnerships, collaborations, and mergers and acquisitions to enhance their market presence and product portfolios. Furthermore, the market is witnessing a growing trend toward specialization, with companies focusing on developing niche sizing agents for specific applications. This specialization is leading to increased innovation and the development of more efficient and sustainable sizing solutions. The increasing focus on sustainable practices, coupled with stringent environmental regulations, will also drive the adoption of eco-friendly sizing agents in the coming years. The market is expected to witness a continuous shift towards advanced sizing techniques and the adoption of innovative formulations in liquid, powder, paste, and granule forms to cater to diverse industry requirements.

Sizing Agent Industry Market Report: 2019-2033
This comprehensive report provides a detailed analysis of the global sizing agent industry, offering invaluable insights for stakeholders, investors, and industry professionals. With a study period spanning 2019-2033, a base year of 2025, and an estimated and forecast period of 2025-2033, this report unveils the market's dynamics, trends, and future potential. The global sizing agent market is projected to reach a value of $XX Billion by 2033, exhibiting a CAGR of XX% during the forecast period.
Sizing Agent Industry Market Concentration & Dynamics
The global sizing agent market exhibits a moderately concentrated landscape, with key players such as Solenis, Buckman, and Avebe holding significant market share. However, the market is also characterized by a diverse range of regional and specialized players, fostering a competitive yet dynamic environment. Market share data reveals that the top five players collectively account for approximately XX% of the global market in 2025.
Market Dynamics:
- Innovation Ecosystems: Significant investments in R&D are driving innovation in both natural and synthetic sizing agents, leading to the development of advanced sizing techniques and formulations.
- Regulatory Frameworks: Stringent environmental regulations regarding chemical usage are influencing the demand for eco-friendly sizing agents, stimulating the growth of the natural segment.
- Substitute Products: The availability of alternative materials and techniques presents a competitive challenge to traditional sizing agents.
- End-User Trends: Growing demand from key sectors like textiles and paper is a major growth driver. Shifts in consumer preferences towards sustainable products are further impacting market dynamics.
- M&A Activities: The past five years have witnessed approximately XX M&A deals in the sizing agent industry, driven by strategic consolidation and expansion efforts by major players.
Sizing Agent Industry Insights & Trends
The global sizing agent market is experiencing robust growth, driven by a multitude of factors. The market size reached $XX Billion in 2025 and is projected to reach $XX Billion by 2033. Key growth drivers include expanding applications in diverse industries, increasing demand for high-performance sizing agents, and the rising adoption of advanced sizing techniques.
Technological advancements, particularly in the development of sustainable and high-performance sizing agents, are revolutionizing the industry. The growing demand for eco-friendly products from environmentally conscious consumers is also significantly influencing market trends. Furthermore, the increasing focus on improving product efficiency and reducing production costs is driving the adoption of innovative sizing techniques and technologies. The shift towards digitalization and automation in manufacturing processes is further enhancing market growth.

Key Markets & Segments Leading Sizing Agent Industry
The Textile & Fiber segment currently dominates the sizing agent market, driven by the burgeoning textile industry, particularly in developing economies. The Paper & Paperboard segment also holds significant market share due to the high demand for sizing agents in paper manufacturing.
Dominant Regions & Segments:
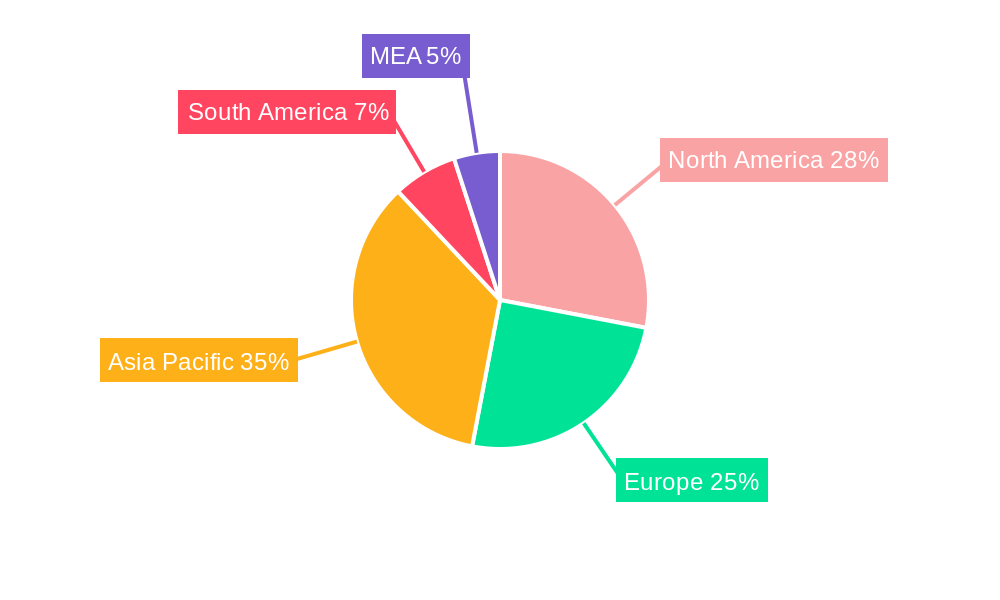
- Region: Asia-Pacific is the leading region, fueled by robust economic growth and expanding industrialization.
- Application: Textile & Fiber remains the dominant application segment due to high demand from the apparel and textile industries.
- Type: Synthetic sizing agents currently hold a larger market share compared to natural sizing agents, due to their superior performance characteristics.
- Technique: Conventional sizing techniques still dominate, though the adoption of advanced sizing techniques is steadily increasing.
- Form: Liquid sizing agents enjoy the largest market share, owing to their ease of application and versatility.
Growth Drivers by Segment:
- Textile & Fiber: Strong growth in the apparel industry, increasing demand for high-quality textiles.
- Paper & Paperboard: Rising consumption of paper and paperboard products globally.
- Cosmetics & Personal Care: Growing demand for high-performance and sustainable cosmetic products.
Sizing Agent Industry Product Developments
Recent years have witnessed notable advancements in sizing agent technology, including the introduction of biodegradable and bio-based sizing agents, improved performance characteristics, and enhanced application methods. This focus on innovation is enhancing product efficiency, reducing environmental impact, and creating a competitive edge for manufacturers.
Challenges in the Sizing Agent Industry Market
The sizing agent industry faces challenges such as stringent environmental regulations impacting production costs and the need for continuous innovation to compete with emerging substitutes. Fluctuations in raw material prices and supply chain disruptions also pose significant obstacles. Competition from established and emerging players further intensifies the market's complexities. These challenges collectively impact the industry's profitability and growth trajectory. For example, the increase in raw material costs by XX% in 2024 resulted in a YY% decrease in profit margins for several key players.
Forces Driving Sizing Agent Industry Growth
Key growth drivers include increasing industrialization, particularly in developing economies, rising demand for high-performance materials across various industries, and growing consumer preference for sustainable and eco-friendly products. Technological advancements resulting in improved product efficiency and cost-effectiveness further accelerate market growth. Favorable government policies promoting industrial development and environmental sustainability also contribute significantly.
Long-Term Growth Catalysts in the Sizing Agent Industry
Long-term growth hinges on continued innovation in sustainable sizing agent technologies, strategic partnerships to enhance supply chains, and expansions into new and emerging markets, particularly in regions with rapid industrial growth. Investment in R&D to develop next-generation sizing agents with improved performance and reduced environmental impact will be crucial for sustaining long-term market leadership.
Emerging Opportunities in Sizing Agent Industry
Emerging opportunities lie in the development of specialized sizing agents for niche applications, the adoption of advanced manufacturing techniques for improved efficiency, and the exploration of new markets in sectors like bio-based materials and sustainable packaging. Furthermore, the growing focus on personalized and customized sizing solutions presents a lucrative avenue for future growth.
Leading Players in the Sizing Agent Industry Sector
- Aries Chemical Inc
- Drop Chemicals SA
- Avebe
- Buckman
- LAROS
- Refnol Resins & Chemicals Ltd
- Eco Polychem Pvt Ltd
- Huixian Tiankai Paper Making Agent Co Ltd
- Angel Starch & Food Private Limited
- Harima Chemicals Group Inc
- Associated Chemical
- Finor Piplaj Chemical Limited
- MATANGI INTERNATIONAL
- Solenis
- Mare SpA
Key Milestones in Sizing Agent Industry Industry
- 2020: Introduction of a biodegradable sizing agent by Buckman.
- 2021: Merger between two leading players in the European market resulting in increased market share.
- 2022: Launch of a new high-performance sizing agent by Avebe.
- 2023: Significant investment in R&D by Solenis focusing on sustainable sizing agent technology.
- 2024: Implementation of stricter environmental regulations impacting the production of certain sizing agents.
Strategic Outlook for Sizing Agent Industry Market
The sizing agent industry is poised for sustained growth, driven by technological innovation, expanding applications, and rising demand in key markets. Strategic investments in R&D, sustainable manufacturing practices, and strategic partnerships will be crucial for companies to capitalize on the industry's vast potential. The focus on eco-friendly and high-performance products will be paramount in securing long-term market leadership.
Sizing Agent Industry Segmentation
-
1. Type
- 1.1. Natural
- 1.2. Synthetic
-
2. Application
- 2.1. Textiles
- 2.2. Paper and Paper Board
- 2.3. Food and Beverage
- 2.4. Other Applications
Sizing Agent Industry Segmentation By Geography
-
1. Asia Pacific
- 1.1. China
- 1.2. India
- 1.3. Japan
- 1.4. South Korea
- 1.5. Rest of Asia Pacific
-
2. North America
- 2.1. United States
- 2.2. Canada
- 2.3. Mexico
-
3. Europe
- 3.1. Germany
- 3.2. United Kingdom
- 3.3. Italy
- 3.4. France
- 3.5. Rest of Europe
-
4. South America
- 4.1. Brazil
- 4.2. Argentina
- 4.3. Rest of South America
-
5. Middle East and Africa
- 5.1. Saudi Arabia
- 5.2. South Africa
- 5.3. Rest of Middle East and Africa
Sizing Agent Industry REPORT HIGHLIGHTS
| Aspects | Details |
|---|---|
| Study Period | 2019-2033 |
| Base Year | 2024 |
| Estimated Year | 2025 |
| Forecast Period | 2025-2033 |
| Historical Period | 2019-2024 |
| Growth Rate | CAGR of 4% from 2019-2033 |
| Segmentation |
|
Table of Contents
- 1. Introduction
- 1.1. Research Scope
- 1.2. Market Segmentation
- 1.3. Research Methodology
- 1.4. Definitions and Assumptions
- 2. Executive Summary
- 2.1. Introduction
- 3. Market Dynamics
- 3.1. Introduction
- 3.2. Market Drivers
- 3.2.1. ; Growing Demand from the Textile Industry; Increasing Demand from the Paper Manufacturing Industries
- 3.3. Market Restrains
- 3.3.1. ; Stringent Environmental Regulations; Unfavorable Conditions Arising Due to the COVID-19 Outbreak
- 3.4. Market Trends
- 3.4.1. Growing Demand from the Textile Manufacturing Industry
- 4. Market Factor Analysis
- 4.1. Porters Five Forces
- 4.2. Supply/Value Chain
- 4.3. PESTEL analysis
- 4.4. Market Entropy
- 4.5. Patent/Trademark Analysis
- 5. Global Sizing Agent Industry Analysis, Insights and Forecast, 2019-2031
- 5.1. Market Analysis, Insights and Forecast - by Type
- 5.1.1. Natural
- 5.1.2. Synthetic
- 5.2. Market Analysis, Insights and Forecast - by Application
- 5.2.1. Textiles
- 5.2.2. Paper and Paper Board
- 5.2.3. Food and Beverage
- 5.2.4. Other Applications
- 5.3. Market Analysis, Insights and Forecast - by Region
- 5.3.1. Asia Pacific
- 5.3.2. North America
- 5.3.3. Europe
- 5.3.4. South America
- 5.3.5. Middle East and Africa
- 5.1. Market Analysis, Insights and Forecast - by Type
- 6. Asia Pacific Sizing Agent Industry Analysis, Insights and Forecast, 2019-2031
- 6.1. Market Analysis, Insights and Forecast - by Type
- 6.1.1. Natural
- 6.1.2. Synthetic
- 6.2. Market Analysis, Insights and Forecast - by Application
- 6.2.1. Textiles
- 6.2.2. Paper and Paper Board
- 6.2.3. Food and Beverage
- 6.2.4. Other Applications
- 6.1. Market Analysis, Insights and Forecast - by Type
- 7. North America Sizing Agent Industry Analysis, Insights and Forecast, 2019-2031
- 7.1. Market Analysis, Insights and Forecast - by Type
- 7.1.1. Natural
- 7.1.2. Synthetic
- 7.2. Market Analysis, Insights and Forecast - by Application
- 7.2.1. Textiles
- 7.2.2. Paper and Paper Board
- 7.2.3. Food and Beverage
- 7.2.4. Other Applications
- 7.1. Market Analysis, Insights and Forecast - by Type
- 8. Europe Sizing Agent Industry Analysis, Insights and Forecast, 2019-2031
- 8.1. Market Analysis, Insights and Forecast - by Type
- 8.1.1. Natural
- 8.1.2. Synthetic
- 8.2. Market Analysis, Insights and Forecast - by Application
- 8.2.1. Textiles
- 8.2.2. Paper and Paper Board
- 8.2.3. Food and Beverage
- 8.2.4. Other Applications
- 8.1. Market Analysis, Insights and Forecast - by Type
- 9. South America Sizing Agent Industry Analysis, Insights and Forecast, 2019-2031
- 9.1. Market Analysis, Insights and Forecast - by Type
- 9.1.1. Natural
- 9.1.2. Synthetic
- 9.2. Market Analysis, Insights and Forecast - by Application
- 9.2.1. Textiles
- 9.2.2. Paper and Paper Board
- 9.2.3. Food and Beverage
- 9.2.4. Other Applications
- 9.1. Market Analysis, Insights and Forecast - by Type
- 10. Middle East and Africa Sizing Agent Industry Analysis, Insights and Forecast, 2019-2031
- 10.1. Market Analysis, Insights and Forecast - by Type
- 10.1.1. Natural
- 10.1.2. Synthetic
- 10.2. Market Analysis, Insights and Forecast - by Application
- 10.2.1. Textiles
- 10.2.2. Paper and Paper Board
- 10.2.3. Food and Beverage
- 10.2.4. Other Applications
- 10.1. Market Analysis, Insights and Forecast - by Type
- 11. North America Sizing Agent Industry Analysis, Insights and Forecast, 2019-2031
- 11.1. Market Analysis, Insights and Forecast - By Country/Sub-region
- 11.1.1 United States
- 11.1.2 Canada
- 11.1.3 Mexico
- 12. Europe Sizing Agent Industry Analysis, Insights and Forecast, 2019-2031
- 12.1. Market Analysis, Insights and Forecast - By Country/Sub-region
- 12.1.1 Germany
- 12.1.2 France
- 12.1.3 Italy
- 12.1.4 United Kingdom
- 12.1.5 Netherlands
- 12.1.6 Rest of Europe
- 13. Asia Pacific Sizing Agent Industry Analysis, Insights and Forecast, 2019-2031
- 13.1. Market Analysis, Insights and Forecast - By Country/Sub-region
- 13.1.1 China
- 13.1.2 Japan
- 13.1.3 India
- 13.1.4 South Korea
- 13.1.5 Taiwan
- 13.1.6 Australia
- 13.1.7 Rest of Asia-Pacific
- 14. South America Sizing Agent Industry Analysis, Insights and Forecast, 2019-2031
- 14.1. Market Analysis, Insights and Forecast - By Country/Sub-region
- 14.1.1 Brazil
- 14.1.2 Argentina
- 14.1.3 Rest of South America
- 15. MEA Sizing Agent Industry Analysis, Insights and Forecast, 2019-2031
- 15.1. Market Analysis, Insights and Forecast - By Country/Sub-region
- 15.1.1 Middle East
- 15.1.2 Africa
- 16. Competitive Analysis
- 16.1. Global Market Share Analysis 2024
- 16.2. Company Profiles
- 16.2.1 Aries Chemical Inc
- 16.2.1.1. Overview
- 16.2.1.2. Products
- 16.2.1.3. SWOT Analysis
- 16.2.1.4. Recent Developments
- 16.2.1.5. Financials (Based on Availability)
- 16.2.2 Drop Chemicals SA
- 16.2.2.1. Overview
- 16.2.2.2. Products
- 16.2.2.3. SWOT Analysis
- 16.2.2.4. Recent Developments
- 16.2.2.5. Financials (Based on Availability)
- 16.2.3 Avebe
- 16.2.3.1. Overview
- 16.2.3.2. Products
- 16.2.3.3. SWOT Analysis
- 16.2.3.4. Recent Developments
- 16.2.3.5. Financials (Based on Availability)
- 16.2.4 Buckman
- 16.2.4.1. Overview
- 16.2.4.2. Products
- 16.2.4.3. SWOT Analysis
- 16.2.4.4. Recent Developments
- 16.2.4.5. Financials (Based on Availability)
- 16.2.5 LAROS
- 16.2.5.1. Overview
- 16.2.5.2. Products
- 16.2.5.3. SWOT Analysis
- 16.2.5.4. Recent Developments
- 16.2.5.5. Financials (Based on Availability)
- 16.2.6 Refnol Resins & Chemicals Ltd
- 16.2.6.1. Overview
- 16.2.6.2. Products
- 16.2.6.3. SWOT Analysis
- 16.2.6.4. Recent Developments
- 16.2.6.5. Financials (Based on Availability)
- 16.2.7 Eco Polychem Pvt Ltd
- 16.2.7.1. Overview
- 16.2.7.2. Products
- 16.2.7.3. SWOT Analysis
- 16.2.7.4. Recent Developments
- 16.2.7.5. Financials (Based on Availability)
- 16.2.8 Huixian Tiankai Paper Making Agent Co Ltd
- 16.2.8.1. Overview
- 16.2.8.2. Products
- 16.2.8.3. SWOT Analysis
- 16.2.8.4. Recent Developments
- 16.2.8.5. Financials (Based on Availability)
- 16.2.9 Angel Starch & Food Private Limited
- 16.2.9.1. Overview
- 16.2.9.2. Products
- 16.2.9.3. SWOT Analysis
- 16.2.9.4. Recent Developments
- 16.2.9.5. Financials (Based on Availability)
- 16.2.10 Harima Chemicals Group Inc
- 16.2.10.1. Overview
- 16.2.10.2. Products
- 16.2.10.3. SWOT Analysis
- 16.2.10.4. Recent Developments
- 16.2.10.5. Financials (Based on Availability)
- 16.2.11 Associated Chemical
- 16.2.11.1. Overview
- 16.2.11.2. Products
- 16.2.11.3. SWOT Analysis
- 16.2.11.4. Recent Developments
- 16.2.11.5. Financials (Based on Availability)
- 16.2.12 Finor Piplaj Chemical Limited
- 16.2.12.1. Overview
- 16.2.12.2. Products
- 16.2.12.3. SWOT Analysis
- 16.2.12.4. Recent Developments
- 16.2.12.5. Financials (Based on Availability)
- 16.2.13 MATANGI INTERNATIONAL
- 16.2.13.1. Overview
- 16.2.13.2. Products
- 16.2.13.3. SWOT Analysis
- 16.2.13.4. Recent Developments
- 16.2.13.5. Financials (Based on Availability)
- 16.2.14 Solenis
- 16.2.14.1. Overview
- 16.2.14.2. Products
- 16.2.14.3. SWOT Analysis
- 16.2.14.4. Recent Developments
- 16.2.14.5. Financials (Based on Availability)
- 16.2.15 Mare SpA
- 16.2.15.1. Overview
- 16.2.15.2. Products
- 16.2.15.3. SWOT Analysis
- 16.2.15.4. Recent Developments
- 16.2.15.5. Financials (Based on Availability)
- 16.2.1 Aries Chemical Inc
List of Figures
- Figure 1: Global Sizing Agent Industry Revenue Breakdown (Billion, %) by Region 2024 & 2032
- Figure 2: Global Sizing Agent Industry Volume Breakdown (K Tons, %) by Region 2024 & 2032
- Figure 3: North America Sizing Agent Industry Revenue (Billion), by Country 2024 & 2032
- Figure 4: North America Sizing Agent Industry Volume (K Tons), by Country 2024 & 2032
- Figure 5: North America Sizing Agent Industry Revenue Share (%), by Country 2024 & 2032
- Figure 6: North America Sizing Agent Industry Volume Share (%), by Country 2024 & 2032
- Figure 7: Europe Sizing Agent Industry Revenue (Billion), by Country 2024 & 2032
- Figure 8: Europe Sizing Agent Industry Volume (K Tons), by Country 2024 & 2032
- Figure 9: Europe Sizing Agent Industry Revenue Share (%), by Country 2024 & 2032
- Figure 10: Europe Sizing Agent Industry Volume Share (%), by Country 2024 & 2032
- Figure 11: Asia Pacific Sizing Agent Industry Revenue (Billion), by Country 2024 & 2032
- Figure 12: Asia Pacific Sizing Agent Industry Volume (K Tons), by Country 2024 & 2032
- Figure 13: Asia Pacific Sizing Agent Industry Revenue Share (%), by Country 2024 & 2032
- Figure 14: Asia Pacific Sizing Agent Industry Volume Share (%), by Country 2024 & 2032
- Figure 15: South America Sizing Agent Industry Revenue (Billion), by Country 2024 & 2032
- Figure 16: South America Sizing Agent Industry Volume (K Tons), by Country 2024 & 2032
- Figure 17: South America Sizing Agent Industry Revenue Share (%), by Country 2024 & 2032
- Figure 18: South America Sizing Agent Industry Volume Share (%), by Country 2024 & 2032
- Figure 19: MEA Sizing Agent Industry Revenue (Billion), by Country 2024 & 2032
- Figure 20: MEA Sizing Agent Industry Volume (K Tons), by Country 2024 & 2032
- Figure 21: MEA Sizing Agent Industry Revenue Share (%), by Country 2024 & 2032
- Figure 22: MEA Sizing Agent Industry Volume Share (%), by Country 2024 & 2032
- Figure 23: Asia Pacific Sizing Agent Industry Revenue (Billion), by Type 2024 & 2032
- Figure 24: Asia Pacific Sizing Agent Industry Volume (K Tons), by Type 2024 & 2032
- Figure 25: Asia Pacific Sizing Agent Industry Revenue Share (%), by Type 2024 & 2032
- Figure 26: Asia Pacific Sizing Agent Industry Volume Share (%), by Type 2024 & 2032
- Figure 27: Asia Pacific Sizing Agent Industry Revenue (Billion), by Application 2024 & 2032
- Figure 28: Asia Pacific Sizing Agent Industry Volume (K Tons), by Application 2024 & 2032
- Figure 29: Asia Pacific Sizing Agent Industry Revenue Share (%), by Application 2024 & 2032
- Figure 30: Asia Pacific Sizing Agent Industry Volume Share (%), by Application 2024 & 2032
- Figure 31: Asia Pacific Sizing Agent Industry Revenue (Billion), by Country 2024 & 2032
- Figure 32: Asia Pacific Sizing Agent Industry Volume (K Tons), by Country 2024 & 2032
- Figure 33: Asia Pacific Sizing Agent Industry Revenue Share (%), by Country 2024 & 2032
- Figure 34: Asia Pacific Sizing Agent Industry Volume Share (%), by Country 2024 & 2032
- Figure 35: North America Sizing Agent Industry Revenue (Billion), by Type 2024 & 2032
- Figure 36: North America Sizing Agent Industry Volume (K Tons), by Type 2024 & 2032
- Figure 37: North America Sizing Agent Industry Revenue Share (%), by Type 2024 & 2032
- Figure 38: North America Sizing Agent Industry Volume Share (%), by Type 2024 & 2032
- Figure 39: North America Sizing Agent Industry Revenue (Billion), by Application 2024 & 2032
- Figure 40: North America Sizing Agent Industry Volume (K Tons), by Application 2024 & 2032
- Figure 41: North America Sizing Agent Industry Revenue Share (%), by Application 2024 & 2032
- Figure 42: North America Sizing Agent Industry Volume Share (%), by Application 2024 & 2032
- Figure 43: North America Sizing Agent Industry Revenue (Billion), by Country 2024 & 2032
- Figure 44: North America Sizing Agent Industry Volume (K Tons), by Country 2024 & 2032
- Figure 45: North America Sizing Agent Industry Revenue Share (%), by Country 2024 & 2032
- Figure 46: North America Sizing Agent Industry Volume Share (%), by Country 2024 & 2032
- Figure 47: Europe Sizing Agent Industry Revenue (Billion), by Type 2024 & 2032
- Figure 48: Europe Sizing Agent Industry Volume (K Tons), by Type 2024 & 2032
- Figure 49: Europe Sizing Agent Industry Revenue Share (%), by Type 2024 & 2032
- Figure 50: Europe Sizing Agent Industry Volume Share (%), by Type 2024 & 2032
- Figure 51: Europe Sizing Agent Industry Revenue (Billion), by Application 2024 & 2032
- Figure 52: Europe Sizing Agent Industry Volume (K Tons), by Application 2024 & 2032
- Figure 53: Europe Sizing Agent Industry Revenue Share (%), by Application 2024 & 2032
- Figure 54: Europe Sizing Agent Industry Volume Share (%), by Application 2024 & 2032
- Figure 55: Europe Sizing Agent Industry Revenue (Billion), by Country 2024 & 2032
- Figure 56: Europe Sizing Agent Industry Volume (K Tons), by Country 2024 & 2032
- Figure 57: Europe Sizing Agent Industry Revenue Share (%), by Country 2024 & 2032
- Figure 58: Europe Sizing Agent Industry Volume Share (%), by Country 2024 & 2032
- Figure 59: South America Sizing Agent Industry Revenue (Billion), by Type 2024 & 2032
- Figure 60: South America Sizing Agent Industry Volume (K Tons), by Type 2024 & 2032
- Figure 61: South America Sizing Agent Industry Revenue Share (%), by Type 2024 & 2032
- Figure 62: South America Sizing Agent Industry Volume Share (%), by Type 2024 & 2032
- Figure 63: South America Sizing Agent Industry Revenue (Billion), by Application 2024 & 2032
- Figure 64: South America Sizing Agent Industry Volume (K Tons), by Application 2024 & 2032
- Figure 65: South America Sizing Agent Industry Revenue Share (%), by Application 2024 & 2032
- Figure 66: South America Sizing Agent Industry Volume Share (%), by Application 2024 & 2032
- Figure 67: South America Sizing Agent Industry Revenue (Billion), by Country 2024 & 2032
- Figure 68: South America Sizing Agent Industry Volume (K Tons), by Country 2024 & 2032
- Figure 69: South America Sizing Agent Industry Revenue Share (%), by Country 2024 & 2032
- Figure 70: South America Sizing Agent Industry Volume Share (%), by Country 2024 & 2032
- Figure 71: Middle East and Africa Sizing Agent Industry Revenue (Billion), by Type 2024 & 2032
- Figure 72: Middle East and Africa Sizing Agent Industry Volume (K Tons), by Type 2024 & 2032
- Figure 73: Middle East and Africa Sizing Agent Industry Revenue Share (%), by Type 2024 & 2032
- Figure 74: Middle East and Africa Sizing Agent Industry Volume Share (%), by Type 2024 & 2032
- Figure 75: Middle East and Africa Sizing Agent Industry Revenue (Billion), by Application 2024 & 2032
- Figure 76: Middle East and Africa Sizing Agent Industry Volume (K Tons), by Application 2024 & 2032
- Figure 77: Middle East and Africa Sizing Agent Industry Revenue Share (%), by Application 2024 & 2032
- Figure 78: Middle East and Africa Sizing Agent Industry Volume Share (%), by Application 2024 & 2032
- Figure 79: Middle East and Africa Sizing Agent Industry Revenue (Billion), by Country 2024 & 2032
- Figure 80: Middle East and Africa Sizing Agent Industry Volume (K Tons), by Country 2024 & 2032
- Figure 81: Middle East and Africa Sizing Agent Industry Revenue Share (%), by Country 2024 & 2032
- Figure 82: Middle East and Africa Sizing Agent Industry Volume Share (%), by Country 2024 & 2032
List of Tables
- Table 1: Global Sizing Agent Industry Revenue Billion Forecast, by Region 2019 & 2032
- Table 2: Global Sizing Agent Industry Volume K Tons Forecast, by Region 2019 & 2032
- Table 3: Global Sizing Agent Industry Revenue Billion Forecast, by Type 2019 & 2032
- Table 4: Global Sizing Agent Industry Volume K Tons Forecast, by Type 2019 & 2032
- Table 5: Global Sizing Agent Industry Revenue Billion Forecast, by Application 2019 & 2032
- Table 6: Global Sizing Agent Industry Volume K Tons Forecast, by Application 2019 & 2032
- Table 7: Global Sizing Agent Industry Revenue Billion Forecast, by Region 2019 & 2032
- Table 8: Global Sizing Agent Industry Volume K Tons Forecast, by Region 2019 & 2032
- Table 9: Global Sizing Agent Industry Revenue Billion Forecast, by Country 2019 & 2032
- Table 10: Global Sizing Agent Industry Volume K Tons Forecast, by Country 2019 & 2032
- Table 11: United States Sizing Agent Industry Revenue (Billion) Forecast, by Application 2019 & 2032
- Table 12: United States Sizing Agent Industry Volume (K Tons) Forecast, by Application 2019 & 2032
- Table 13: Canada Sizing Agent Industry Revenue (Billion) Forecast, by Application 2019 & 2032
- Table 14: Canada Sizing Agent Industry Volume (K Tons) Forecast, by Application 2019 & 2032
- Table 15: Mexico Sizing Agent Industry Revenue (Billion) Forecast, by Application 2019 & 2032
- Table 16: Mexico Sizing Agent Industry Volume (K Tons) Forecast, by Application 2019 & 2032
- Table 17: Global Sizing Agent Industry Revenue Billion Forecast, by Country 2019 & 2032
- Table 18: Global Sizing Agent Industry Volume K Tons Forecast, by Country 2019 & 2032
- Table 19: Germany Sizing Agent Industry Revenue (Billion) Forecast, by Application 2019 & 2032
- Table 20: Germany Sizing Agent Industry Volume (K Tons) Forecast, by Application 2019 & 2032
- Table 21: France Sizing Agent Industry Revenue (Billion) Forecast, by Application 2019 & 2032
- Table 22: France Sizing Agent Industry Volume (K Tons) Forecast, by Application 2019 & 2032
- Table 23: Italy Sizing Agent Industry Revenue (Billion) Forecast, by Application 2019 & 2032
- Table 24: Italy Sizing Agent Industry Volume (K Tons) Forecast, by Application 2019 & 2032
- Table 25: United Kingdom Sizing Agent Industry Revenue (Billion) Forecast, by Application 2019 & 2032
- Table 26: United Kingdom Sizing Agent Industry Volume (K Tons) Forecast, by Application 2019 & 2032
- Table 27: Netherlands Sizing Agent Industry Revenue (Billion) Forecast, by Application 2019 & 2032
- Table 28: Netherlands Sizing Agent Industry Volume (K Tons) Forecast, by Application 2019 & 2032
- Table 29: Rest of Europe Sizing Agent Industry Revenue (Billion) Forecast, by Application 2019 & 2032
- Table 30: Rest of Europe Sizing Agent Industry Volume (K Tons) Forecast, by Application 2019 & 2032
- Table 31: Global Sizing Agent Industry Revenue Billion Forecast, by Country 2019 & 2032
- Table 32: Global Sizing Agent Industry Volume K Tons Forecast, by Country 2019 & 2032
- Table 33: China Sizing Agent Industry Revenue (Billion) Forecast, by Application 2019 & 2032
- Table 34: China Sizing Agent Industry Volume (K Tons) Forecast, by Application 2019 & 2032
- Table 35: Japan Sizing Agent Industry Revenue (Billion) Forecast, by Application 2019 & 2032
- Table 36: Japan Sizing Agent Industry Volume (K Tons) Forecast, by Application 2019 & 2032
- Table 37: India Sizing Agent Industry Revenue (Billion) Forecast, by Application 2019 & 2032
- Table 38: India Sizing Agent Industry Volume (K Tons) Forecast, by Application 2019 & 2032
- Table 39: South Korea Sizing Agent Industry Revenue (Billion) Forecast, by Application 2019 & 2032
- Table 40: South Korea Sizing Agent Industry Volume (K Tons) Forecast, by Application 2019 & 2032
- Table 41: Taiwan Sizing Agent Industry Revenue (Billion) Forecast, by Application 2019 & 2032
- Table 42: Taiwan Sizing Agent Industry Volume (K Tons) Forecast, by Application 2019 & 2032
- Table 43: Australia Sizing Agent Industry Revenue (Billion) Forecast, by Application 2019 & 2032
- Table 44: Australia Sizing Agent Industry Volume (K Tons) Forecast, by Application 2019 & 2032
- Table 45: Rest of Asia-Pacific Sizing Agent Industry Revenue (Billion) Forecast, by Application 2019 & 2032
- Table 46: Rest of Asia-Pacific Sizing Agent Industry Volume (K Tons) Forecast, by Application 2019 & 2032
- Table 47: Global Sizing Agent Industry Revenue Billion Forecast, by Country 2019 & 2032
- Table 48: Global Sizing Agent Industry Volume K Tons Forecast, by Country 2019 & 2032
- Table 49: Brazil Sizing Agent Industry Revenue (Billion) Forecast, by Application 2019 & 2032
- Table 50: Brazil Sizing Agent Industry Volume (K Tons) Forecast, by Application 2019 & 2032
- Table 51: Argentina Sizing Agent Industry Revenue (Billion) Forecast, by Application 2019 & 2032
- Table 52: Argentina Sizing Agent Industry Volume (K Tons) Forecast, by Application 2019 & 2032
- Table 53: Rest of South America Sizing Agent Industry Revenue (Billion) Forecast, by Application 2019 & 2032
- Table 54: Rest of South America Sizing Agent Industry Volume (K Tons) Forecast, by Application 2019 & 2032
- Table 55: Global Sizing Agent Industry Revenue Billion Forecast, by Country 2019 & 2032
- Table 56: Global Sizing Agent Industry Volume K Tons Forecast, by Country 2019 & 2032
- Table 57: Middle East Sizing Agent Industry Revenue (Billion) Forecast, by Application 2019 & 2032
- Table 58: Middle East Sizing Agent Industry Volume (K Tons) Forecast, by Application 2019 & 2032
- Table 59: Africa Sizing Agent Industry Revenue (Billion) Forecast, by Application 2019 & 2032
- Table 60: Africa Sizing Agent Industry Volume (K Tons) Forecast, by Application 2019 & 2032
- Table 61: Global Sizing Agent Industry Revenue Billion Forecast, by Type 2019 & 2032
- Table 62: Global Sizing Agent Industry Volume K Tons Forecast, by Type 2019 & 2032
- Table 63: Global Sizing Agent Industry Revenue Billion Forecast, by Application 2019 & 2032
- Table 64: Global Sizing Agent Industry Volume K Tons Forecast, by Application 2019 & 2032
- Table 65: Global Sizing Agent Industry Revenue Billion Forecast, by Country 2019 & 2032
- Table 66: Global Sizing Agent Industry Volume K Tons Forecast, by Country 2019 & 2032
- Table 67: China Sizing Agent Industry Revenue (Billion) Forecast, by Application 2019 & 2032
- Table 68: China Sizing Agent Industry Volume (K Tons) Forecast, by Application 2019 & 2032
- Table 69: India Sizing Agent Industry Revenue (Billion) Forecast, by Application 2019 & 2032
- Table 70: India Sizing Agent Industry Volume (K Tons) Forecast, by Application 2019 & 2032
- Table 71: Japan Sizing Agent Industry Revenue (Billion) Forecast, by Application 2019 & 2032
- Table 72: Japan Sizing Agent Industry Volume (K Tons) Forecast, by Application 2019 & 2032
- Table 73: South Korea Sizing Agent Industry Revenue (Billion) Forecast, by Application 2019 & 2032
- Table 74: South Korea Sizing Agent Industry Volume (K Tons) Forecast, by Application 2019 & 2032
- Table 75: Rest of Asia Pacific Sizing Agent Industry Revenue (Billion) Forecast, by Application 2019 & 2032
- Table 76: Rest of Asia Pacific Sizing Agent Industry Volume (K Tons) Forecast, by Application 2019 & 2032
- Table 77: Global Sizing Agent Industry Revenue Billion Forecast, by Type 2019 & 2032
- Table 78: Global Sizing Agent Industry Volume K Tons Forecast, by Type 2019 & 2032
- Table 79: Global Sizing Agent Industry Revenue Billion Forecast, by Application 2019 & 2032
- Table 80: Global Sizing Agent Industry Volume K Tons Forecast, by Application 2019 & 2032
- Table 81: Global Sizing Agent Industry Revenue Billion Forecast, by Country 2019 & 2032
- Table 82: Global Sizing Agent Industry Volume K Tons Forecast, by Country 2019 & 2032
- Table 83: United States Sizing Agent Industry Revenue (Billion) Forecast, by Application 2019 & 2032
- Table 84: United States Sizing Agent Industry Volume (K Tons) Forecast, by Application 2019 & 2032
- Table 85: Canada Sizing Agent Industry Revenue (Billion) Forecast, by Application 2019 & 2032
- Table 86: Canada Sizing Agent Industry Volume (K Tons) Forecast, by Application 2019 & 2032
- Table 87: Mexico Sizing Agent Industry Revenue (Billion) Forecast, by Application 2019 & 2032
- Table 88: Mexico Sizing Agent Industry Volume (K Tons) Forecast, by Application 2019 & 2032
- Table 89: Global Sizing Agent Industry Revenue Billion Forecast, by Type 2019 & 2032
- Table 90: Global Sizing Agent Industry Volume K Tons Forecast, by Type 2019 & 2032
- Table 91: Global Sizing Agent Industry Revenue Billion Forecast, by Application 2019 & 2032
- Table 92: Global Sizing Agent Industry Volume K Tons Forecast, by Application 2019 & 2032
- Table 93: Global Sizing Agent Industry Revenue Billion Forecast, by Country 2019 & 2032
- Table 94: Global Sizing Agent Industry Volume K Tons Forecast, by Country 2019 & 2032
- Table 95: Germany Sizing Agent Industry Revenue (Billion) Forecast, by Application 2019 & 2032
- Table 96: Germany Sizing Agent Industry Volume (K Tons) Forecast, by Application 2019 & 2032
- Table 97: United Kingdom Sizing Agent Industry Revenue (Billion) Forecast, by Application 2019 & 2032
- Table 98: United Kingdom Sizing Agent Industry Volume (K Tons) Forecast, by Application 2019 & 2032
- Table 99: Italy Sizing Agent Industry Revenue (Billion) Forecast, by Application 2019 & 2032
- Table 100: Italy Sizing Agent Industry Volume (K Tons) Forecast, by Application 2019 & 2032
- Table 101: France Sizing Agent Industry Revenue (Billion) Forecast, by Application 2019 & 2032
- Table 102: France Sizing Agent Industry Volume (K Tons) Forecast, by Application 2019 & 2032
- Table 103: Rest of Europe Sizing Agent Industry Revenue (Billion) Forecast, by Application 2019 & 2032
- Table 104: Rest of Europe Sizing Agent Industry Volume (K Tons) Forecast, by Application 2019 & 2032
- Table 105: Global Sizing Agent Industry Revenue Billion Forecast, by Type 2019 & 2032
- Table 106: Global Sizing Agent Industry Volume K Tons Forecast, by Type 2019 & 2032
- Table 107: Global Sizing Agent Industry Revenue Billion Forecast, by Application 2019 & 2032
- Table 108: Global Sizing Agent Industry Volume K Tons Forecast, by Application 2019 & 2032
- Table 109: Global Sizing Agent Industry Revenue Billion Forecast, by Country 2019 & 2032
- Table 110: Global Sizing Agent Industry Volume K Tons Forecast, by Country 2019 & 2032
- Table 111: Brazil Sizing Agent Industry Revenue (Billion) Forecast, by Application 2019 & 2032
- Table 112: Brazil Sizing Agent Industry Volume (K Tons) Forecast, by Application 2019 & 2032
- Table 113: Argentina Sizing Agent Industry Revenue (Billion) Forecast, by Application 2019 & 2032
- Table 114: Argentina Sizing Agent Industry Volume (K Tons) Forecast, by Application 2019 & 2032
- Table 115: Rest of South America Sizing Agent Industry Revenue (Billion) Forecast, by Application 2019 & 2032
- Table 116: Rest of South America Sizing Agent Industry Volume (K Tons) Forecast, by Application 2019 & 2032
- Table 117: Global Sizing Agent Industry Revenue Billion Forecast, by Type 2019 & 2032
- Table 118: Global Sizing Agent Industry Volume K Tons Forecast, by Type 2019 & 2032
- Table 119: Global Sizing Agent Industry Revenue Billion Forecast, by Application 2019 & 2032
- Table 120: Global Sizing Agent Industry Volume K Tons Forecast, by Application 2019 & 2032
- Table 121: Global Sizing Agent Industry Revenue Billion Forecast, by Country 2019 & 2032
- Table 122: Global Sizing Agent Industry Volume K Tons Forecast, by Country 2019 & 2032
- Table 123: Saudi Arabia Sizing Agent Industry Revenue (Billion) Forecast, by Application 2019 & 2032
- Table 124: Saudi Arabia Sizing Agent Industry Volume (K Tons) Forecast, by Application 2019 & 2032
- Table 125: South Africa Sizing Agent Industry Revenue (Billion) Forecast, by Application 2019 & 2032
- Table 126: South Africa Sizing Agent Industry Volume (K Tons) Forecast, by Application 2019 & 2032
- Table 127: Rest of Middle East and Africa Sizing Agent Industry Revenue (Billion) Forecast, by Application 2019 & 2032
- Table 128: Rest of Middle East and Africa Sizing Agent Industry Volume (K Tons) Forecast, by Application 2019 & 2032
Frequently Asked Questions
1. What is the projected Compound Annual Growth Rate (CAGR) of the Sizing Agent Industry?
The projected CAGR is approximately 4%.
2. Which companies are prominent players in the Sizing Agent Industry?
Key companies in the market include Aries Chemical Inc, Drop Chemicals SA, Avebe, Buckman, LAROS, Refnol Resins & Chemicals Ltd, Eco Polychem Pvt Ltd, Huixian Tiankai Paper Making Agent Co Ltd, Angel Starch & Food Private Limited, Harima Chemicals Group Inc, Associated Chemical, Finor Piplaj Chemical Limited, MATANGI INTERNATIONAL, Solenis, Mare SpA.
3. What are the main segments of the Sizing Agent Industry?
The market segments include Type, Application.
4. Can you provide details about the market size?
The market size is estimated to be USD 3.9 Billion as of 2022.
5. What are some drivers contributing to market growth?
; Growing Demand from the Textile Industry; Increasing Demand from the Paper Manufacturing Industries.
6. What are the notable trends driving market growth?
Growing Demand from the Textile Manufacturing Industry.
7. Are there any restraints impacting market growth?
; Stringent Environmental Regulations; Unfavorable Conditions Arising Due to the COVID-19 Outbreak.
8. Can you provide examples of recent developments in the market?
N/A
9. What pricing options are available for accessing the report?
Pricing options include single-user, multi-user, and enterprise licenses priced at USD 4750, USD 5250, and USD 8750 respectively.
10. Is the market size provided in terms of value or volume?
The market size is provided in terms of value, measured in Billion and volume, measured in K Tons.
11. Are there any specific market keywords associated with the report?
Yes, the market keyword associated with the report is "Sizing Agent Industry," which aids in identifying and referencing the specific market segment covered.
12. How do I determine which pricing option suits my needs best?
The pricing options vary based on user requirements and access needs. Individual users may opt for single-user licenses, while businesses requiring broader access may choose multi-user or enterprise licenses for cost-effective access to the report.
13. Are there any additional resources or data provided in the Sizing Agent Industry report?
While the report offers comprehensive insights, it's advisable to review the specific contents or supplementary materials provided to ascertain if additional resources or data are available.
14. How can I stay updated on further developments or reports in the Sizing Agent Industry?
To stay informed about further developments, trends, and reports in the Sizing Agent Industry, consider subscribing to industry newsletters, following relevant companies and organizations, or regularly checking reputable industry news sources and publications.
Methodology
Step 1 - Identification of Relevant Samples Size from Population Database


Step 2 - Approaches for Defining Global Market Size (Value, Volume* & Price*)

Note*: In applicable scenarios
Step 3 - Data Sources
Primary Research
- Web Analytics
- Survey Reports
- Research Institute
- Latest Research Reports
- Opinion Leaders
Secondary Research
- Annual Reports
- White Paper
- Latest Press Release
- Industry Association
- Paid Database
- Investor Presentations

Step 4 - Data Triangulation
Involves using different sources of information in order to increase the validity of a study
These sources are likely to be stakeholders in a program - participants, other researchers, program staff, other community members, and so on.
Then we put all data in single framework & apply various statistical tools to find out the dynamic on the market.
During the analysis stage, feedback from the stakeholder groups would be compared to determine areas of agreement as well as areas of divergence
