

Key Insights
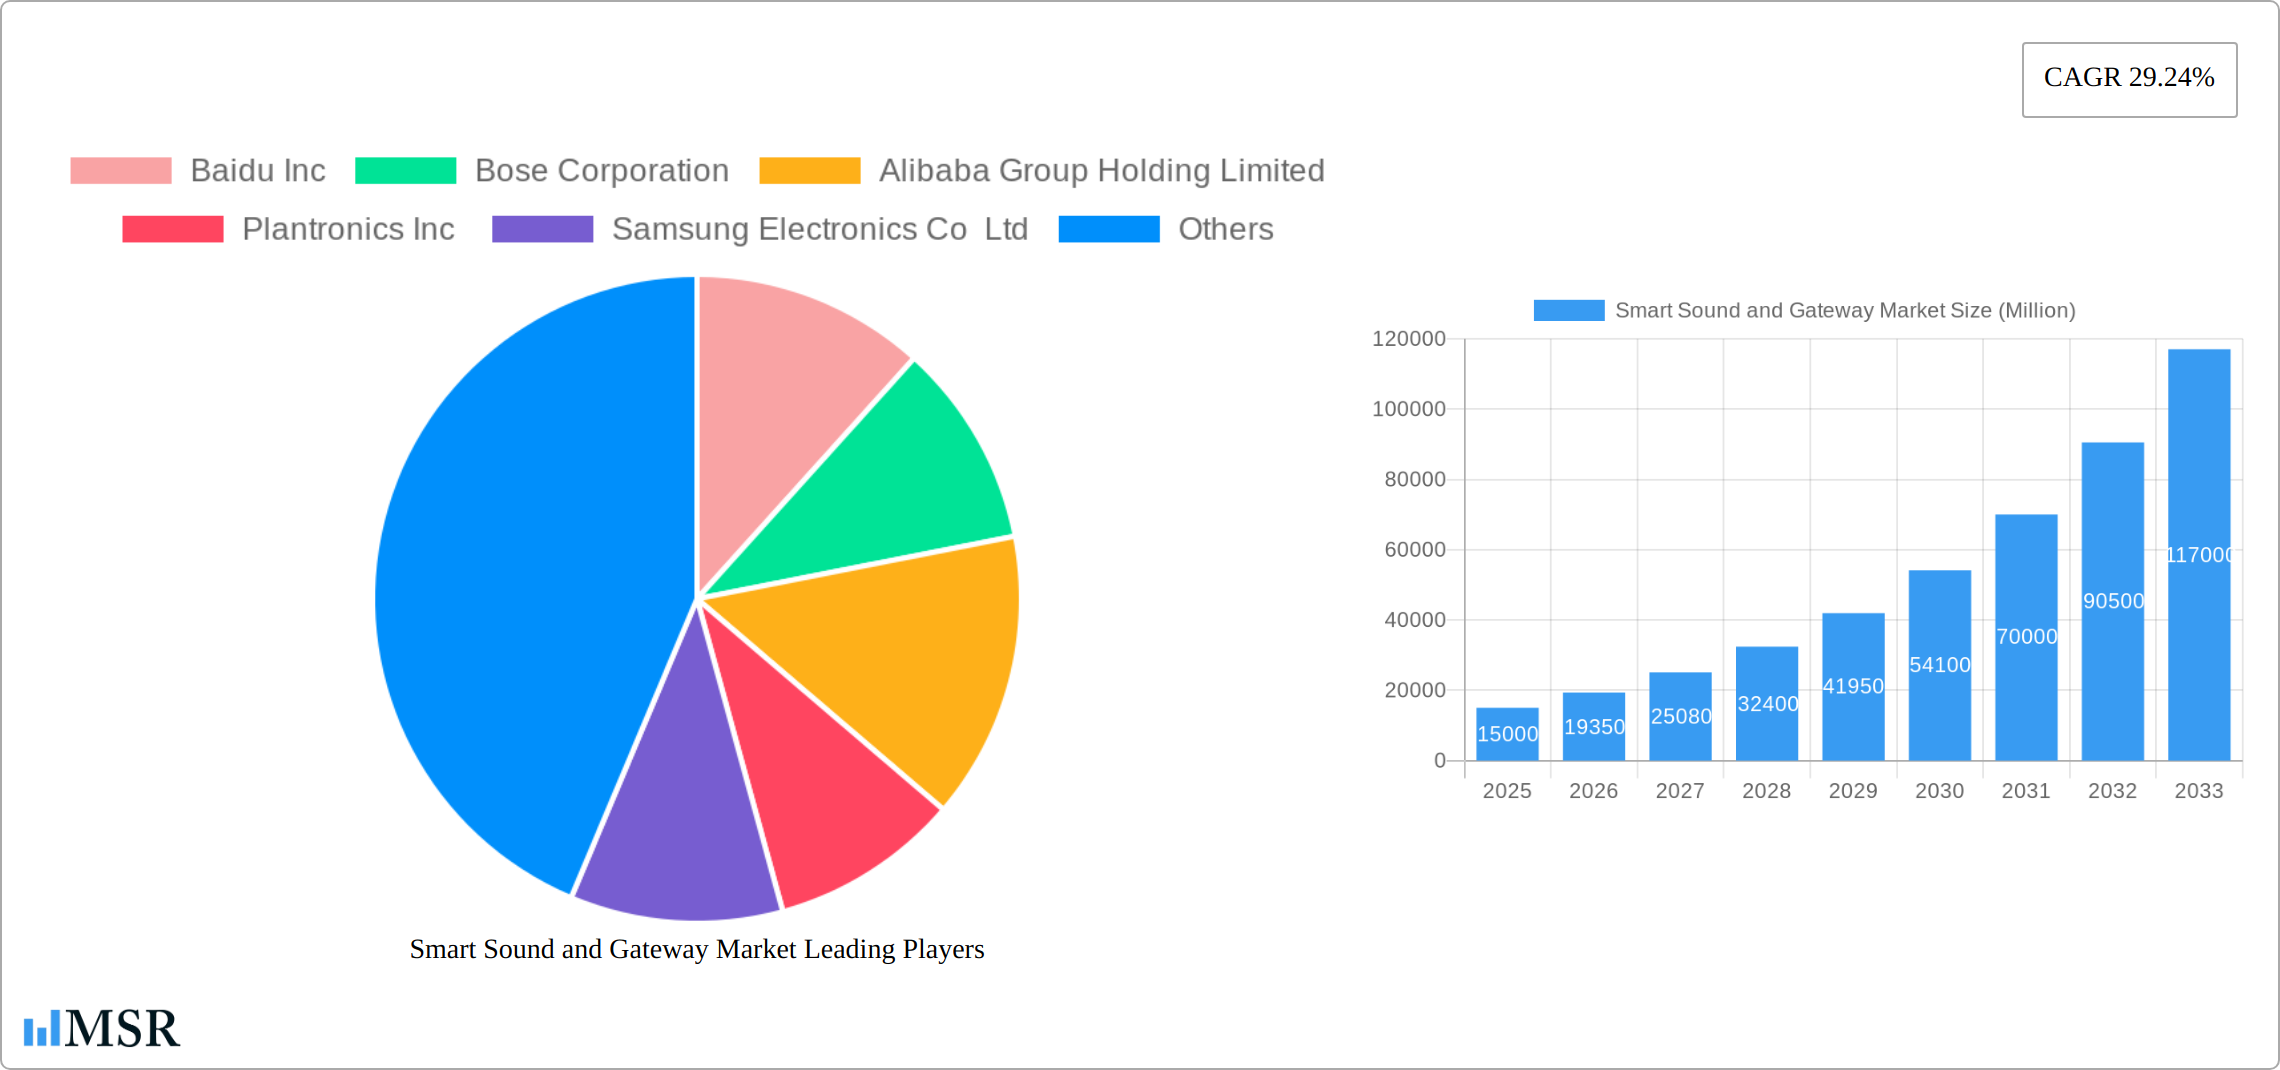
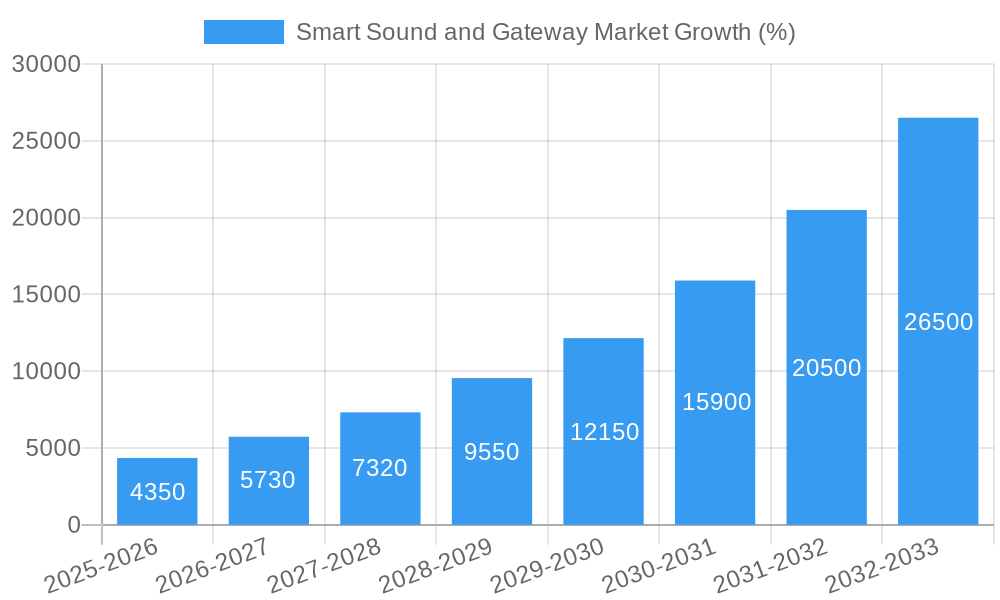
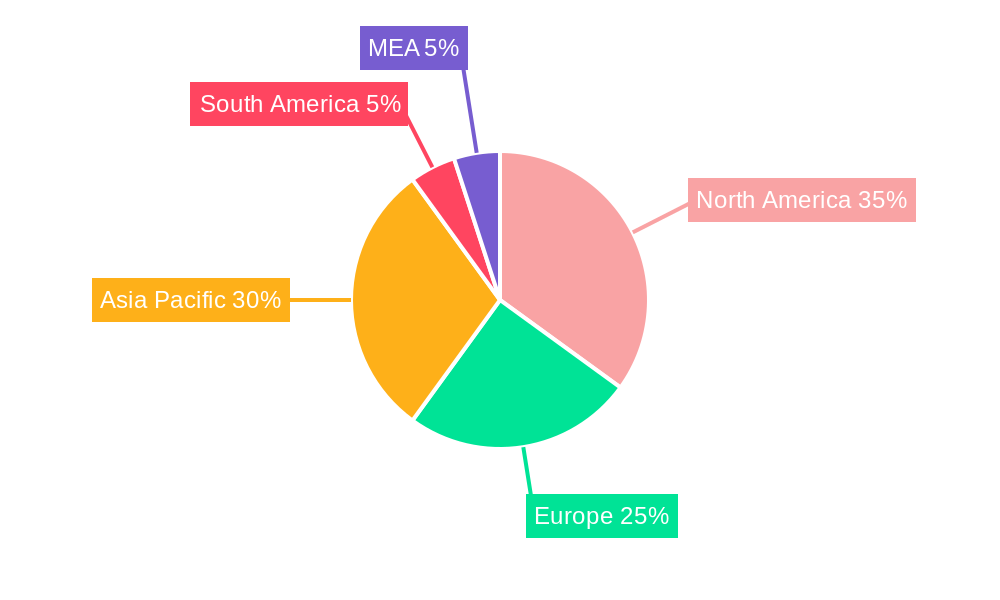
The smart sound and gateway market, encompassing smart speakers, hearables, and virtual assistants like Alexa, Google Assistant, and Siri, is experiencing robust growth. Driven by increasing demand for voice-controlled devices, seamless home automation, and enhanced entertainment experiences, the market is projected to maintain a significant Compound Annual Growth Rate (CAGR) of 29.24% from 2025 to 2033. This expansion is fueled by technological advancements leading to improved sound quality, enhanced AI capabilities, and broader device integration. The integration of virtual assistants into various smart home ecosystems is a key driver, facilitating a more connected and convenient living experience. North America and Asia Pacific are currently leading the market, with significant growth potential in developing economies as affordability and awareness increase. However, challenges remain, including data privacy concerns, the high initial cost of adoption, and the potential for market saturation in certain regions. Competition among major players such as Amazon, Google, Apple, and Baidu remains fierce, leading to innovation in features, functionality, and pricing strategies.
The segmentation of the market into hardware (smart speakers and hearables) and software (virtual assistants) presents unique opportunities. While smart speakers dominate current market share, the growth of hearables, driven by miniaturization and enhanced functionality, is expected to significantly impact the overall market dynamics. The proliferation of multiple virtual assistant support speakers further adds complexity and opportunity, particularly as interoperability improves. The long-term outlook for the smart sound and gateway market remains positive, with sustained growth anticipated due to continuing technological innovation and the increasing integration of these devices into various aspects of daily life. However, companies must address concerns related to user privacy and data security to ensure sustainable market growth and maintain consumer trust.
Smart Sound and Gateway Market: A Comprehensive Report (2019-2033)
This comprehensive report provides an in-depth analysis of the global Smart Sound and Gateway Market, offering invaluable insights for industry stakeholders, investors, and strategic decision-makers. The study covers the period from 2019 to 2033, with a focus on the estimated year 2025 and a forecast period of 2025-2033. The report projects a market value exceeding $XX Million by 2033, driven by technological advancements and evolving consumer preferences. Key players analyzed include Baidu Inc, Bose Corporation, Alibaba Group Holding Limited, Plantronics Inc, Samsung Electronics Co Ltd, Google LLC (Alphabet Inc), Sonos Inc, Xiaomi Inc, Amazon.com Inc, and Apple Inc., across segments such as Alexa, Google Assistant, Siri, AliGenie, Xiao AI, and various smart speaker and hearable solutions.
Smart Sound and Gateway Market Market Concentration & Dynamics
The Smart Sound and Gateway Market exhibits a moderately concentrated landscape, with a few dominant players holding significant market share. Market concentration is further analyzed by assessing the Herfindahl-Hirschman Index (HHI) and the four-firm concentration ratio (CR4). The market is dynamic, shaped by rapid technological innovation, evolving regulatory frameworks, and intense competition.
- Market Share: Amazon and Google hold a combined market share exceeding XX%, followed by Apple and Xiaomi, each with a market share of approximately XX%. Other players constitute the remaining XX%.
- M&A Activities: The historical period (2019-2024) witnessed approximately XX M&A deals, primarily focused on expanding product portfolios and enhancing technological capabilities. The forecast period anticipates a surge in M&A activity, driven by consolidation efforts and strategic expansions.
- Innovation Ecosystems: Significant innovation is driven by collaborations between technology giants and smaller startups, fostering development in areas like AI-powered voice assistants and enhanced audio capabilities.
- Regulatory Frameworks: Data privacy regulations and cybersecurity concerns are increasingly influencing market dynamics, impacting product development and consumer adoption.
- Substitute Products: Traditional audio devices and other home automation solutions pose a competitive threat, highlighting the need for differentiation and value-added services.
- End-User Trends: The growing demand for personalized audio experiences, seamless home automation integration, and improved voice assistant capabilities drives market growth.
Smart Sound and Gateway Market Industry Insights & Trends
The global Smart Sound and Gateway Market is experiencing robust growth, with a Compound Annual Growth Rate (CAGR) of XX% during the forecast period (2025-2033). This growth is fueled by several key factors. The market size in 2025 is estimated at $XX Million, projected to reach $XX Million by 2033. Technological advancements like improved voice recognition, enhanced sound quality, and sophisticated AI algorithms are driving the adoption of smart speakers and hearables. The increasing integration of smart sound devices into smart homes is further propelling market expansion. Moreover, the growing popularity of virtual assistants, particularly Alexa, Google Assistant, and Siri, coupled with increasing consumer disposable income in developing economies, are significant contributors to market growth. The market exhibits a substantial potential in emerging markets, with significant growth opportunities in regions like Asia-Pacific. Evolving consumer behavior, such as increased demand for convenient and personalized audio experiences, contributes to market expansion. However, challenges such as data privacy concerns and the need for continuous technological innovation need to be addressed.
Key Markets & Segments Leading Smart Sound and Gateway Market
The North American region currently dominates the Smart Sound and Gateway Market, driven by high technological adoption rates and strong consumer demand. However, the Asia-Pacific region is expected to witness the fastest growth during the forecast period.
Dominant Segments:
- Virtual Assistant: Alexa and Google Assistant hold the largest market share among virtual assistants, owing to their wide availability and extensive ecosystem of supported devices and services. Siri, AliGenie, and Xiao AI are also gaining traction in their respective regions.
- Multiple Virtual Assistant Support Speakers: This segment is witnessing increasing demand as consumers seek greater flexibility and compatibility with their existing smart home ecosystems.
- Smart Speaker (Only Hardware): This segment continues to show strong growth, propelled by the increasing affordability and availability of smart speakers.
- Hearables (Only Hardware): The hearables market is experiencing robust growth, fueled by innovations in noise cancellation, health monitoring features, and personalized audio experiences.
Drivers:
- North America: High disposable income, early adoption of technology, and extensive availability of smart home ecosystems.
- Asia-Pacific: Rapid economic growth, increasing smartphone penetration, and a young, tech-savvy population.
- Europe: Rising demand for voice-activated devices and increasing integration of smart speakers into home automation systems.
Smart Sound and Gateway Market Product Developments
Recent innovations focus on enhanced audio quality, improved voice recognition accuracy, and seamless integration with other smart home devices. Advanced features like noise cancellation, spatial audio, and personalized sound profiles are becoming increasingly common. The integration of AI-powered features for enhanced user experience, and the development of compact and stylish designs, are key to maintaining a competitive edge.
Challenges in the Smart Sound and Gateway Market Market
The market faces challenges including:
- Data Privacy Concerns: The collection and use of user data by smart speakers and hearables raise significant privacy concerns, impacting consumer trust and adoption rates.
- Supply Chain Disruptions: Global supply chain complexities and component shortages can negatively impact production and delivery timelines.
- Intense Competition: The market is highly competitive, with established technology giants and emerging players vying for market share, leading to price wars and margin pressures. This competition results in approximately XX% reduction in profit margins annually.
Forces Driving Smart Sound and Gateway Market Growth
Several factors fuel market growth:
- Technological Advancements: Continuous advancements in voice recognition, AI, and audio processing technologies enhance user experience and drive demand.
- Economic Growth: Rising disposable incomes in developing economies boost consumer spending on smart sound and gateway devices.
- Government Initiatives: Government support for smart city and IoT initiatives drives smart device adoption.
Challenges in the Smart Sound and Gateway Market Market
Long-term growth hinges on overcoming challenges, including fostering greater consumer trust through robust data protection measures, improving supply chain resilience, and addressing interoperability issues among devices from different manufacturers. Strategic partnerships and collaborations are essential for accelerating innovation and market penetration.
Emerging Opportunities in Smart Sound and Gateway Market
Emerging opportunities include:
- Expansion into New Markets: Untapped potential exists in emerging economies with rising consumer spending and smartphone penetration.
- Integration with Healthcare: Smart speakers and hearables can be integrated with healthcare systems for remote monitoring and personalized care.
- Enhanced Personalization: Advanced AI algorithms can offer highly personalized audio experiences and smart home functionalities.
Leading Players in the Smart Sound and Gateway Market Sector
- Baidu Inc
- Bose Corporation
- Alibaba Group Holding Limited
- Plantronics Inc
- Samsung Electronics Co Ltd
- Google LLC (Alphabet Inc)
- Sonos Inc
- Xiaomi Inc
- Amazon.com Inc
- Apple Inc
Key Milestones in Smart Sound and Gateway Market Industry
- 2020-Q4: Amazon launches the Alexa-enabled Echo Show 10, integrating video calling capabilities.
- 2021-Q1: Google integrates Google Assistant with more third-party smart home devices.
- 2022-Q2: Apple expands Siri’s functionality within its home ecosystem.
- 2023-Q3: Xiaomi releases a new line of smart speakers with advanced audio features.
Strategic Outlook for Smart Sound and Gateway Market Market
The Smart Sound and Gateway Market shows immense potential for future growth, fueled by continued technological innovation and increasing consumer adoption. Strategic opportunities lie in developing innovative products with enhanced functionalities, expanding into new market segments, and forging strategic partnerships to accelerate market penetration. Focusing on data privacy and security, while improving interoperability across devices, is crucial for long-term success.
Smart Sound and Gateway Market Segmentation
-
1. Virtual Assistant
- 1.1. Alexa
- 1.2. Google Assistant
- 1.3. Siri
- 1.4. AliGenie
- 1.5. Xiao AI
- 1.6. Multiple Virtual Assistant Support Speakers
- 1.7. Other Virtual Assistants
-
2. Solution
- 2.1. Smart Speaker (Only Hardware)
- 2.2. Hearables (Only Hardware)
Smart Sound and Gateway Market Segmentation By Geography
-
1. North America
- 1.1. United States
- 1.2. Canada
-
2. Europe
- 2.1. Germany
- 2.2. United Kingdom
- 2.3. France
- 2.4. Spain
- 2.5. Rest of Europe
-
3. Asia Pacific
- 3.1. China
- 3.2. Japan
- 3.3. Rest of Asia Pacific
- 4. Rest of the World
Smart Sound and Gateway Market REPORT HIGHLIGHTS
| Aspects | Details |
|---|---|
| Study Period | 2019-2033 |
| Base Year | 2024 |
| Estimated Year | 2025 |
| Forecast Period | 2025-2033 |
| Historical Period | 2019-2024 |
| Growth Rate | CAGR of 29.24% from 2019-2033 |
| Segmentation |
|
Table of Contents
- 1. Introduction
- 1.1. Research Scope
- 1.2. Market Segmentation
- 1.3. Research Methodology
- 1.4. Definitions and Assumptions
- 2. Executive Summary
- 2.1. Introduction
- 3. Market Dynamics
- 3.1. Introduction
- 3.2. Market Drivers
- 3.2.1. Increasing Number of Smart Homes; Growing Consumer Propensity toward Connected Devices
- 3.3. Market Restrains
- 3.3.1. Increasing Preference for Live Person Interaction
- 3.4. Market Trends
- 3.4.1. Google Assistant to witness a Significant Market Share
- 4. Market Factor Analysis
- 4.1. Porters Five Forces
- 4.2. Supply/Value Chain
- 4.3. PESTEL analysis
- 4.4. Market Entropy
- 4.5. Patent/Trademark Analysis
- 5. Global Smart Sound and Gateway Market Analysis, Insights and Forecast, 2019-2031
- 5.1. Market Analysis, Insights and Forecast - by Virtual Assistant
- 5.1.1. Alexa
- 5.1.2. Google Assistant
- 5.1.3. Siri
- 5.1.4. AliGenie
- 5.1.5. Xiao AI
- 5.1.6. Multiple Virtual Assistant Support Speakers
- 5.1.7. Other Virtual Assistants
- 5.2. Market Analysis, Insights and Forecast - by Solution
- 5.2.1. Smart Speaker (Only Hardware)
- 5.2.2. Hearables (Only Hardware)
- 5.3. Market Analysis, Insights and Forecast - by Region
- 5.3.1. North America
- 5.3.2. Europe
- 5.3.3. Asia Pacific
- 5.3.4. Rest of the World
- 5.1. Market Analysis, Insights and Forecast - by Virtual Assistant
- 6. North America Smart Sound and Gateway Market Analysis, Insights and Forecast, 2019-2031
- 6.1. Market Analysis, Insights and Forecast - by Virtual Assistant
- 6.1.1. Alexa
- 6.1.2. Google Assistant
- 6.1.3. Siri
- 6.1.4. AliGenie
- 6.1.5. Xiao AI
- 6.1.6. Multiple Virtual Assistant Support Speakers
- 6.1.7. Other Virtual Assistants
- 6.2. Market Analysis, Insights and Forecast - by Solution
- 6.2.1. Smart Speaker (Only Hardware)
- 6.2.2. Hearables (Only Hardware)
- 6.1. Market Analysis, Insights and Forecast - by Virtual Assistant
- 7. Europe Smart Sound and Gateway Market Analysis, Insights and Forecast, 2019-2031
- 7.1. Market Analysis, Insights and Forecast - by Virtual Assistant
- 7.1.1. Alexa
- 7.1.2. Google Assistant
- 7.1.3. Siri
- 7.1.4. AliGenie
- 7.1.5. Xiao AI
- 7.1.6. Multiple Virtual Assistant Support Speakers
- 7.1.7. Other Virtual Assistants
- 7.2. Market Analysis, Insights and Forecast - by Solution
- 7.2.1. Smart Speaker (Only Hardware)
- 7.2.2. Hearables (Only Hardware)
- 7.1. Market Analysis, Insights and Forecast - by Virtual Assistant
- 8. Asia Pacific Smart Sound and Gateway Market Analysis, Insights and Forecast, 2019-2031
- 8.1. Market Analysis, Insights and Forecast - by Virtual Assistant
- 8.1.1. Alexa
- 8.1.2. Google Assistant
- 8.1.3. Siri
- 8.1.4. AliGenie
- 8.1.5. Xiao AI
- 8.1.6. Multiple Virtual Assistant Support Speakers
- 8.1.7. Other Virtual Assistants
- 8.2. Market Analysis, Insights and Forecast - by Solution
- 8.2.1. Smart Speaker (Only Hardware)
- 8.2.2. Hearables (Only Hardware)
- 8.1. Market Analysis, Insights and Forecast - by Virtual Assistant
- 9. Rest of the World Smart Sound and Gateway Market Analysis, Insights and Forecast, 2019-2031
- 9.1. Market Analysis, Insights and Forecast - by Virtual Assistant
- 9.1.1. Alexa
- 9.1.2. Google Assistant
- 9.1.3. Siri
- 9.1.4. AliGenie
- 9.1.5. Xiao AI
- 9.1.6. Multiple Virtual Assistant Support Speakers
- 9.1.7. Other Virtual Assistants
- 9.2. Market Analysis, Insights and Forecast - by Solution
- 9.2.1. Smart Speaker (Only Hardware)
- 9.2.2. Hearables (Only Hardware)
- 9.1. Market Analysis, Insights and Forecast - by Virtual Assistant
- 10. North America Smart Sound and Gateway Market Analysis, Insights and Forecast, 2019-2031
- 10.1. Market Analysis, Insights and Forecast - By Country/Sub-region
- 10.1.1 United States
- 10.1.2 Canada
- 10.1.3 Mexico
- 11. Europe Smart Sound and Gateway Market Analysis, Insights and Forecast, 2019-2031
- 11.1. Market Analysis, Insights and Forecast - By Country/Sub-region
- 11.1.1 Germany
- 11.1.2 United Kingdom
- 11.1.3 France
- 11.1.4 Spain
- 11.1.5 Italy
- 11.1.6 Spain
- 11.1.7 Belgium
- 11.1.8 Netherland
- 11.1.9 Nordics
- 11.1.10 Rest of Europe
- 12. Asia Pacific Smart Sound and Gateway Market Analysis, Insights and Forecast, 2019-2031
- 12.1. Market Analysis, Insights and Forecast - By Country/Sub-region
- 12.1.1 China
- 12.1.2 Japan
- 12.1.3 India
- 12.1.4 South Korea
- 12.1.5 Southeast Asia
- 12.1.6 Australia
- 12.1.7 Indonesia
- 12.1.8 Phillipes
- 12.1.9 Singapore
- 12.1.10 Thailandc
- 12.1.11 Rest of Asia Pacific
- 13. South America Smart Sound and Gateway Market Analysis, Insights and Forecast, 2019-2031
- 13.1. Market Analysis, Insights and Forecast - By Country/Sub-region
- 13.1.1 Brazil
- 13.1.2 Argentina
- 13.1.3 Peru
- 13.1.4 Chile
- 13.1.5 Colombia
- 13.1.6 Ecuador
- 13.1.7 Venezuela
- 13.1.8 Rest of South America
- 14. North America Smart Sound and Gateway Market Analysis, Insights and Forecast, 2019-2031
- 14.1. Market Analysis, Insights and Forecast - By Country/Sub-region
- 14.1.1 United States
- 14.1.2 Canada
- 14.1.3 Mexico
- 15. MEA Smart Sound and Gateway Market Analysis, Insights and Forecast, 2019-2031
- 15.1. Market Analysis, Insights and Forecast - By Country/Sub-region
- 15.1.1 United Arab Emirates
- 15.1.2 Saudi Arabia
- 15.1.3 South Africa
- 15.1.4 Rest of Middle East and Africa
- 16. Competitive Analysis
- 16.1. Global Market Share Analysis 2024
- 16.2. Company Profiles
- 16.2.1 Baidu Inc
- 16.2.1.1. Overview
- 16.2.1.2. Products
- 16.2.1.3. SWOT Analysis
- 16.2.1.4. Recent Developments
- 16.2.1.5. Financials (Based on Availability)
- 16.2.2 Bose Corporation
- 16.2.2.1. Overview
- 16.2.2.2. Products
- 16.2.2.3. SWOT Analysis
- 16.2.2.4. Recent Developments
- 16.2.2.5. Financials (Based on Availability)
- 16.2.3 Alibaba Group Holding Limited
- 16.2.3.1. Overview
- 16.2.3.2. Products
- 16.2.3.3. SWOT Analysis
- 16.2.3.4. Recent Developments
- 16.2.3.5. Financials (Based on Availability)
- 16.2.4 Plantronics Inc
- 16.2.4.1. Overview
- 16.2.4.2. Products
- 16.2.4.3. SWOT Analysis
- 16.2.4.4. Recent Developments
- 16.2.4.5. Financials (Based on Availability)
- 16.2.5 Samsung Electronics Co Ltd
- 16.2.5.1. Overview
- 16.2.5.2. Products
- 16.2.5.3. SWOT Analysis
- 16.2.5.4. Recent Developments
- 16.2.5.5. Financials (Based on Availability)
- 16.2.6 Google LLC (Alphabet Inc )
- 16.2.6.1. Overview
- 16.2.6.2. Products
- 16.2.6.3. SWOT Analysis
- 16.2.6.4. Recent Developments
- 16.2.6.5. Financials (Based on Availability)
- 16.2.7 Sonos Inc
- 16.2.7.1. Overview
- 16.2.7.2. Products
- 16.2.7.3. SWOT Analysis
- 16.2.7.4. Recent Developments
- 16.2.7.5. Financials (Based on Availability)
- 16.2.8 Xiaomi Inc
- 16.2.8.1. Overview
- 16.2.8.2. Products
- 16.2.8.3. SWOT Analysis
- 16.2.8.4. Recent Developments
- 16.2.8.5. Financials (Based on Availability)
- 16.2.9 Amazon com Inc
- 16.2.9.1. Overview
- 16.2.9.2. Products
- 16.2.9.3. SWOT Analysis
- 16.2.9.4. Recent Developments
- 16.2.9.5. Financials (Based on Availability)
- 16.2.10 Apple Inc
- 16.2.10.1. Overview
- 16.2.10.2. Products
- 16.2.10.3. SWOT Analysis
- 16.2.10.4. Recent Developments
- 16.2.10.5. Financials (Based on Availability)
- 16.2.1 Baidu Inc
List of Figures
- Figure 1: Global Smart Sound and Gateway Market Revenue Breakdown (Million, %) by Region 2024 & 2032
- Figure 2: Global Smart Sound and Gateway Market Volume Breakdown (K Unit, %) by Region 2024 & 2032
- Figure 3: North America Smart Sound and Gateway Market Revenue (Million), by Country 2024 & 2032
- Figure 4: North America Smart Sound and Gateway Market Volume (K Unit), by Country 2024 & 2032
- Figure 5: North America Smart Sound and Gateway Market Revenue Share (%), by Country 2024 & 2032
- Figure 6: North America Smart Sound and Gateway Market Volume Share (%), by Country 2024 & 2032
- Figure 7: Europe Smart Sound and Gateway Market Revenue (Million), by Country 2024 & 2032
- Figure 8: Europe Smart Sound and Gateway Market Volume (K Unit), by Country 2024 & 2032
- Figure 9: Europe Smart Sound and Gateway Market Revenue Share (%), by Country 2024 & 2032
- Figure 10: Europe Smart Sound and Gateway Market Volume Share (%), by Country 2024 & 2032
- Figure 11: Asia Pacific Smart Sound and Gateway Market Revenue (Million), by Country 2024 & 2032
- Figure 12: Asia Pacific Smart Sound and Gateway Market Volume (K Unit), by Country 2024 & 2032
- Figure 13: Asia Pacific Smart Sound and Gateway Market Revenue Share (%), by Country 2024 & 2032
- Figure 14: Asia Pacific Smart Sound and Gateway Market Volume Share (%), by Country 2024 & 2032
- Figure 15: South America Smart Sound and Gateway Market Revenue (Million), by Country 2024 & 2032
- Figure 16: South America Smart Sound and Gateway Market Volume (K Unit), by Country 2024 & 2032
- Figure 17: South America Smart Sound and Gateway Market Revenue Share (%), by Country 2024 & 2032
- Figure 18: South America Smart Sound and Gateway Market Volume Share (%), by Country 2024 & 2032
- Figure 19: North America Smart Sound and Gateway Market Revenue (Million), by Country 2024 & 2032
- Figure 20: North America Smart Sound and Gateway Market Volume (K Unit), by Country 2024 & 2032
- Figure 21: North America Smart Sound and Gateway Market Revenue Share (%), by Country 2024 & 2032
- Figure 22: North America Smart Sound and Gateway Market Volume Share (%), by Country 2024 & 2032
- Figure 23: MEA Smart Sound and Gateway Market Revenue (Million), by Country 2024 & 2032
- Figure 24: MEA Smart Sound and Gateway Market Volume (K Unit), by Country 2024 & 2032
- Figure 25: MEA Smart Sound and Gateway Market Revenue Share (%), by Country 2024 & 2032
- Figure 26: MEA Smart Sound and Gateway Market Volume Share (%), by Country 2024 & 2032
- Figure 27: North America Smart Sound and Gateway Market Revenue (Million), by Virtual Assistant 2024 & 2032
- Figure 28: North America Smart Sound and Gateway Market Volume (K Unit), by Virtual Assistant 2024 & 2032
- Figure 29: North America Smart Sound and Gateway Market Revenue Share (%), by Virtual Assistant 2024 & 2032
- Figure 30: North America Smart Sound and Gateway Market Volume Share (%), by Virtual Assistant 2024 & 2032
- Figure 31: North America Smart Sound and Gateway Market Revenue (Million), by Solution 2024 & 2032
- Figure 32: North America Smart Sound and Gateway Market Volume (K Unit), by Solution 2024 & 2032
- Figure 33: North America Smart Sound and Gateway Market Revenue Share (%), by Solution 2024 & 2032
- Figure 34: North America Smart Sound and Gateway Market Volume Share (%), by Solution 2024 & 2032
- Figure 35: North America Smart Sound and Gateway Market Revenue (Million), by Country 2024 & 2032
- Figure 36: North America Smart Sound and Gateway Market Volume (K Unit), by Country 2024 & 2032
- Figure 37: North America Smart Sound and Gateway Market Revenue Share (%), by Country 2024 & 2032
- Figure 38: North America Smart Sound and Gateway Market Volume Share (%), by Country 2024 & 2032
- Figure 39: Europe Smart Sound and Gateway Market Revenue (Million), by Virtual Assistant 2024 & 2032
- Figure 40: Europe Smart Sound and Gateway Market Volume (K Unit), by Virtual Assistant 2024 & 2032
- Figure 41: Europe Smart Sound and Gateway Market Revenue Share (%), by Virtual Assistant 2024 & 2032
- Figure 42: Europe Smart Sound and Gateway Market Volume Share (%), by Virtual Assistant 2024 & 2032
- Figure 43: Europe Smart Sound and Gateway Market Revenue (Million), by Solution 2024 & 2032
- Figure 44: Europe Smart Sound and Gateway Market Volume (K Unit), by Solution 2024 & 2032
- Figure 45: Europe Smart Sound and Gateway Market Revenue Share (%), by Solution 2024 & 2032
- Figure 46: Europe Smart Sound and Gateway Market Volume Share (%), by Solution 2024 & 2032
- Figure 47: Europe Smart Sound and Gateway Market Revenue (Million), by Country 2024 & 2032
- Figure 48: Europe Smart Sound and Gateway Market Volume (K Unit), by Country 2024 & 2032
- Figure 49: Europe Smart Sound and Gateway Market Revenue Share (%), by Country 2024 & 2032
- Figure 50: Europe Smart Sound and Gateway Market Volume Share (%), by Country 2024 & 2032
- Figure 51: Asia Pacific Smart Sound and Gateway Market Revenue (Million), by Virtual Assistant 2024 & 2032
- Figure 52: Asia Pacific Smart Sound and Gateway Market Volume (K Unit), by Virtual Assistant 2024 & 2032
- Figure 53: Asia Pacific Smart Sound and Gateway Market Revenue Share (%), by Virtual Assistant 2024 & 2032
- Figure 54: Asia Pacific Smart Sound and Gateway Market Volume Share (%), by Virtual Assistant 2024 & 2032
- Figure 55: Asia Pacific Smart Sound and Gateway Market Revenue (Million), by Solution 2024 & 2032
- Figure 56: Asia Pacific Smart Sound and Gateway Market Volume (K Unit), by Solution 2024 & 2032
- Figure 57: Asia Pacific Smart Sound and Gateway Market Revenue Share (%), by Solution 2024 & 2032
- Figure 58: Asia Pacific Smart Sound and Gateway Market Volume Share (%), by Solution 2024 & 2032
- Figure 59: Asia Pacific Smart Sound and Gateway Market Revenue (Million), by Country 2024 & 2032
- Figure 60: Asia Pacific Smart Sound and Gateway Market Volume (K Unit), by Country 2024 & 2032
- Figure 61: Asia Pacific Smart Sound and Gateway Market Revenue Share (%), by Country 2024 & 2032
- Figure 62: Asia Pacific Smart Sound and Gateway Market Volume Share (%), by Country 2024 & 2032
- Figure 63: Rest of the World Smart Sound and Gateway Market Revenue (Million), by Virtual Assistant 2024 & 2032
- Figure 64: Rest of the World Smart Sound and Gateway Market Volume (K Unit), by Virtual Assistant 2024 & 2032
- Figure 65: Rest of the World Smart Sound and Gateway Market Revenue Share (%), by Virtual Assistant 2024 & 2032
- Figure 66: Rest of the World Smart Sound and Gateway Market Volume Share (%), by Virtual Assistant 2024 & 2032
- Figure 67: Rest of the World Smart Sound and Gateway Market Revenue (Million), by Solution 2024 & 2032
- Figure 68: Rest of the World Smart Sound and Gateway Market Volume (K Unit), by Solution 2024 & 2032
- Figure 69: Rest of the World Smart Sound and Gateway Market Revenue Share (%), by Solution 2024 & 2032
- Figure 70: Rest of the World Smart Sound and Gateway Market Volume Share (%), by Solution 2024 & 2032
- Figure 71: Rest of the World Smart Sound and Gateway Market Revenue (Million), by Country 2024 & 2032
- Figure 72: Rest of the World Smart Sound and Gateway Market Volume (K Unit), by Country 2024 & 2032
- Figure 73: Rest of the World Smart Sound and Gateway Market Revenue Share (%), by Country 2024 & 2032
- Figure 74: Rest of the World Smart Sound and Gateway Market Volume Share (%), by Country 2024 & 2032
List of Tables
- Table 1: Global Smart Sound and Gateway Market Revenue Million Forecast, by Region 2019 & 2032
- Table 2: Global Smart Sound and Gateway Market Volume K Unit Forecast, by Region 2019 & 2032
- Table 3: Global Smart Sound and Gateway Market Revenue Million Forecast, by Virtual Assistant 2019 & 2032
- Table 4: Global Smart Sound and Gateway Market Volume K Unit Forecast, by Virtual Assistant 2019 & 2032
- Table 5: Global Smart Sound and Gateway Market Revenue Million Forecast, by Solution 2019 & 2032
- Table 6: Global Smart Sound and Gateway Market Volume K Unit Forecast, by Solution 2019 & 2032
- Table 7: Global Smart Sound and Gateway Market Revenue Million Forecast, by Region 2019 & 2032
- Table 8: Global Smart Sound and Gateway Market Volume K Unit Forecast, by Region 2019 & 2032
- Table 9: Global Smart Sound and Gateway Market Revenue Million Forecast, by Country 2019 & 2032
- Table 10: Global Smart Sound and Gateway Market Volume K Unit Forecast, by Country 2019 & 2032
- Table 11: United States Smart Sound and Gateway Market Revenue (Million) Forecast, by Application 2019 & 2032
- Table 12: United States Smart Sound and Gateway Market Volume (K Unit) Forecast, by Application 2019 & 2032
- Table 13: Canada Smart Sound and Gateway Market Revenue (Million) Forecast, by Application 2019 & 2032
- Table 14: Canada Smart Sound and Gateway Market Volume (K Unit) Forecast, by Application 2019 & 2032
- Table 15: Mexico Smart Sound and Gateway Market Revenue (Million) Forecast, by Application 2019 & 2032
- Table 16: Mexico Smart Sound and Gateway Market Volume (K Unit) Forecast, by Application 2019 & 2032
- Table 17: Global Smart Sound and Gateway Market Revenue Million Forecast, by Country 2019 & 2032
- Table 18: Global Smart Sound and Gateway Market Volume K Unit Forecast, by Country 2019 & 2032
- Table 19: Germany Smart Sound and Gateway Market Revenue (Million) Forecast, by Application 2019 & 2032
- Table 20: Germany Smart Sound and Gateway Market Volume (K Unit) Forecast, by Application 2019 & 2032
- Table 21: United Kingdom Smart Sound and Gateway Market Revenue (Million) Forecast, by Application 2019 & 2032
- Table 22: United Kingdom Smart Sound and Gateway Market Volume (K Unit) Forecast, by Application 2019 & 2032
- Table 23: France Smart Sound and Gateway Market Revenue (Million) Forecast, by Application 2019 & 2032
- Table 24: France Smart Sound and Gateway Market Volume (K Unit) Forecast, by Application 2019 & 2032
- Table 25: Spain Smart Sound and Gateway Market Revenue (Million) Forecast, by Application 2019 & 2032
- Table 26: Spain Smart Sound and Gateway Market Volume (K Unit) Forecast, by Application 2019 & 2032
- Table 27: Italy Smart Sound and Gateway Market Revenue (Million) Forecast, by Application 2019 & 2032
- Table 28: Italy Smart Sound and Gateway Market Volume (K Unit) Forecast, by Application 2019 & 2032
- Table 29: Spain Smart Sound and Gateway Market Revenue (Million) Forecast, by Application 2019 & 2032
- Table 30: Spain Smart Sound and Gateway Market Volume (K Unit) Forecast, by Application 2019 & 2032
- Table 31: Belgium Smart Sound and Gateway Market Revenue (Million) Forecast, by Application 2019 & 2032
- Table 32: Belgium Smart Sound and Gateway Market Volume (K Unit) Forecast, by Application 2019 & 2032
- Table 33: Netherland Smart Sound and Gateway Market Revenue (Million) Forecast, by Application 2019 & 2032
- Table 34: Netherland Smart Sound and Gateway Market Volume (K Unit) Forecast, by Application 2019 & 2032
- Table 35: Nordics Smart Sound and Gateway Market Revenue (Million) Forecast, by Application 2019 & 2032
- Table 36: Nordics Smart Sound and Gateway Market Volume (K Unit) Forecast, by Application 2019 & 2032
- Table 37: Rest of Europe Smart Sound and Gateway Market Revenue (Million) Forecast, by Application 2019 & 2032
- Table 38: Rest of Europe Smart Sound and Gateway Market Volume (K Unit) Forecast, by Application 2019 & 2032
- Table 39: Global Smart Sound and Gateway Market Revenue Million Forecast, by Country 2019 & 2032
- Table 40: Global Smart Sound and Gateway Market Volume K Unit Forecast, by Country 2019 & 2032
- Table 41: China Smart Sound and Gateway Market Revenue (Million) Forecast, by Application 2019 & 2032
- Table 42: China Smart Sound and Gateway Market Volume (K Unit) Forecast, by Application 2019 & 2032
- Table 43: Japan Smart Sound and Gateway Market Revenue (Million) Forecast, by Application 2019 & 2032
- Table 44: Japan Smart Sound and Gateway Market Volume (K Unit) Forecast, by Application 2019 & 2032
- Table 45: India Smart Sound and Gateway Market Revenue (Million) Forecast, by Application 2019 & 2032
- Table 46: India Smart Sound and Gateway Market Volume (K Unit) Forecast, by Application 2019 & 2032
- Table 47: South Korea Smart Sound and Gateway Market Revenue (Million) Forecast, by Application 2019 & 2032
- Table 48: South Korea Smart Sound and Gateway Market Volume (K Unit) Forecast, by Application 2019 & 2032
- Table 49: Southeast Asia Smart Sound and Gateway Market Revenue (Million) Forecast, by Application 2019 & 2032
- Table 50: Southeast Asia Smart Sound and Gateway Market Volume (K Unit) Forecast, by Application 2019 & 2032
- Table 51: Australia Smart Sound and Gateway Market Revenue (Million) Forecast, by Application 2019 & 2032
- Table 52: Australia Smart Sound and Gateway Market Volume (K Unit) Forecast, by Application 2019 & 2032
- Table 53: Indonesia Smart Sound and Gateway Market Revenue (Million) Forecast, by Application 2019 & 2032
- Table 54: Indonesia Smart Sound and Gateway Market Volume (K Unit) Forecast, by Application 2019 & 2032
- Table 55: Phillipes Smart Sound and Gateway Market Revenue (Million) Forecast, by Application 2019 & 2032
- Table 56: Phillipes Smart Sound and Gateway Market Volume (K Unit) Forecast, by Application 2019 & 2032
- Table 57: Singapore Smart Sound and Gateway Market Revenue (Million) Forecast, by Application 2019 & 2032
- Table 58: Singapore Smart Sound and Gateway Market Volume (K Unit) Forecast, by Application 2019 & 2032
- Table 59: Thailandc Smart Sound and Gateway Market Revenue (Million) Forecast, by Application 2019 & 2032
- Table 60: Thailandc Smart Sound and Gateway Market Volume (K Unit) Forecast, by Application 2019 & 2032
- Table 61: Rest of Asia Pacific Smart Sound and Gateway Market Revenue (Million) Forecast, by Application 2019 & 2032
- Table 62: Rest of Asia Pacific Smart Sound and Gateway Market Volume (K Unit) Forecast, by Application 2019 & 2032
- Table 63: Global Smart Sound and Gateway Market Revenue Million Forecast, by Country 2019 & 2032
- Table 64: Global Smart Sound and Gateway Market Volume K Unit Forecast, by Country 2019 & 2032
- Table 65: Brazil Smart Sound and Gateway Market Revenue (Million) Forecast, by Application 2019 & 2032
- Table 66: Brazil Smart Sound and Gateway Market Volume (K Unit) Forecast, by Application 2019 & 2032
- Table 67: Argentina Smart Sound and Gateway Market Revenue (Million) Forecast, by Application 2019 & 2032
- Table 68: Argentina Smart Sound and Gateway Market Volume (K Unit) Forecast, by Application 2019 & 2032
- Table 69: Peru Smart Sound and Gateway Market Revenue (Million) Forecast, by Application 2019 & 2032
- Table 70: Peru Smart Sound and Gateway Market Volume (K Unit) Forecast, by Application 2019 & 2032
- Table 71: Chile Smart Sound and Gateway Market Revenue (Million) Forecast, by Application 2019 & 2032
- Table 72: Chile Smart Sound and Gateway Market Volume (K Unit) Forecast, by Application 2019 & 2032
- Table 73: Colombia Smart Sound and Gateway Market Revenue (Million) Forecast, by Application 2019 & 2032
- Table 74: Colombia Smart Sound and Gateway Market Volume (K Unit) Forecast, by Application 2019 & 2032
- Table 75: Ecuador Smart Sound and Gateway Market Revenue (Million) Forecast, by Application 2019 & 2032
- Table 76: Ecuador Smart Sound and Gateway Market Volume (K Unit) Forecast, by Application 2019 & 2032
- Table 77: Venezuela Smart Sound and Gateway Market Revenue (Million) Forecast, by Application 2019 & 2032
- Table 78: Venezuela Smart Sound and Gateway Market Volume (K Unit) Forecast, by Application 2019 & 2032
- Table 79: Rest of South America Smart Sound and Gateway Market Revenue (Million) Forecast, by Application 2019 & 2032
- Table 80: Rest of South America Smart Sound and Gateway Market Volume (K Unit) Forecast, by Application 2019 & 2032
- Table 81: Global Smart Sound and Gateway Market Revenue Million Forecast, by Country 2019 & 2032
- Table 82: Global Smart Sound and Gateway Market Volume K Unit Forecast, by Country 2019 & 2032
- Table 83: United States Smart Sound and Gateway Market Revenue (Million) Forecast, by Application 2019 & 2032
- Table 84: United States Smart Sound and Gateway Market Volume (K Unit) Forecast, by Application 2019 & 2032
- Table 85: Canada Smart Sound and Gateway Market Revenue (Million) Forecast, by Application 2019 & 2032
- Table 86: Canada Smart Sound and Gateway Market Volume (K Unit) Forecast, by Application 2019 & 2032
- Table 87: Mexico Smart Sound and Gateway Market Revenue (Million) Forecast, by Application 2019 & 2032
- Table 88: Mexico Smart Sound and Gateway Market Volume (K Unit) Forecast, by Application 2019 & 2032
- Table 89: Global Smart Sound and Gateway Market Revenue Million Forecast, by Country 2019 & 2032
- Table 90: Global Smart Sound and Gateway Market Volume K Unit Forecast, by Country 2019 & 2032
- Table 91: United Arab Emirates Smart Sound and Gateway Market Revenue (Million) Forecast, by Application 2019 & 2032
- Table 92: United Arab Emirates Smart Sound and Gateway Market Volume (K Unit) Forecast, by Application 2019 & 2032
- Table 93: Saudi Arabia Smart Sound and Gateway Market Revenue (Million) Forecast, by Application 2019 & 2032
- Table 94: Saudi Arabia Smart Sound and Gateway Market Volume (K Unit) Forecast, by Application 2019 & 2032
- Table 95: South Africa Smart Sound and Gateway Market Revenue (Million) Forecast, by Application 2019 & 2032
- Table 96: South Africa Smart Sound and Gateway Market Volume (K Unit) Forecast, by Application 2019 & 2032
- Table 97: Rest of Middle East and Africa Smart Sound and Gateway Market Revenue (Million) Forecast, by Application 2019 & 2032
- Table 98: Rest of Middle East and Africa Smart Sound and Gateway Market Volume (K Unit) Forecast, by Application 2019 & 2032
- Table 99: Global Smart Sound and Gateway Market Revenue Million Forecast, by Virtual Assistant 2019 & 2032
- Table 100: Global Smart Sound and Gateway Market Volume K Unit Forecast, by Virtual Assistant 2019 & 2032
- Table 101: Global Smart Sound and Gateway Market Revenue Million Forecast, by Solution 2019 & 2032
- Table 102: Global Smart Sound and Gateway Market Volume K Unit Forecast, by Solution 2019 & 2032
- Table 103: Global Smart Sound and Gateway Market Revenue Million Forecast, by Country 2019 & 2032
- Table 104: Global Smart Sound and Gateway Market Volume K Unit Forecast, by Country 2019 & 2032
- Table 105: United States Smart Sound and Gateway Market Revenue (Million) Forecast, by Application 2019 & 2032
- Table 106: United States Smart Sound and Gateway Market Volume (K Unit) Forecast, by Application 2019 & 2032
- Table 107: Canada Smart Sound and Gateway Market Revenue (Million) Forecast, by Application 2019 & 2032
- Table 108: Canada Smart Sound and Gateway Market Volume (K Unit) Forecast, by Application 2019 & 2032
- Table 109: Global Smart Sound and Gateway Market Revenue Million Forecast, by Virtual Assistant 2019 & 2032
- Table 110: Global Smart Sound and Gateway Market Volume K Unit Forecast, by Virtual Assistant 2019 & 2032
- Table 111: Global Smart Sound and Gateway Market Revenue Million Forecast, by Solution 2019 & 2032
- Table 112: Global Smart Sound and Gateway Market Volume K Unit Forecast, by Solution 2019 & 2032
- Table 113: Global Smart Sound and Gateway Market Revenue Million Forecast, by Country 2019 & 2032
- Table 114: Global Smart Sound and Gateway Market Volume K Unit Forecast, by Country 2019 & 2032
- Table 115: Germany Smart Sound and Gateway Market Revenue (Million) Forecast, by Application 2019 & 2032
- Table 116: Germany Smart Sound and Gateway Market Volume (K Unit) Forecast, by Application 2019 & 2032
- Table 117: United Kingdom Smart Sound and Gateway Market Revenue (Million) Forecast, by Application 2019 & 2032
- Table 118: United Kingdom Smart Sound and Gateway Market Volume (K Unit) Forecast, by Application 2019 & 2032
- Table 119: France Smart Sound and Gateway Market Revenue (Million) Forecast, by Application 2019 & 2032
- Table 120: France Smart Sound and Gateway Market Volume (K Unit) Forecast, by Application 2019 & 2032
- Table 121: Spain Smart Sound and Gateway Market Revenue (Million) Forecast, by Application 2019 & 2032
- Table 122: Spain Smart Sound and Gateway Market Volume (K Unit) Forecast, by Application 2019 & 2032
- Table 123: Rest of Europe Smart Sound and Gateway Market Revenue (Million) Forecast, by Application 2019 & 2032
- Table 124: Rest of Europe Smart Sound and Gateway Market Volume (K Unit) Forecast, by Application 2019 & 2032
- Table 125: Global Smart Sound and Gateway Market Revenue Million Forecast, by Virtual Assistant 2019 & 2032
- Table 126: Global Smart Sound and Gateway Market Volume K Unit Forecast, by Virtual Assistant 2019 & 2032
- Table 127: Global Smart Sound and Gateway Market Revenue Million Forecast, by Solution 2019 & 2032
- Table 128: Global Smart Sound and Gateway Market Volume K Unit Forecast, by Solution 2019 & 2032
- Table 129: Global Smart Sound and Gateway Market Revenue Million Forecast, by Country 2019 & 2032
- Table 130: Global Smart Sound and Gateway Market Volume K Unit Forecast, by Country 2019 & 2032
- Table 131: China Smart Sound and Gateway Market Revenue (Million) Forecast, by Application 2019 & 2032
- Table 132: China Smart Sound and Gateway Market Volume (K Unit) Forecast, by Application 2019 & 2032
- Table 133: Japan Smart Sound and Gateway Market Revenue (Million) Forecast, by Application 2019 & 2032
- Table 134: Japan Smart Sound and Gateway Market Volume (K Unit) Forecast, by Application 2019 & 2032
- Table 135: Rest of Asia Pacific Smart Sound and Gateway Market Revenue (Million) Forecast, by Application 2019 & 2032
- Table 136: Rest of Asia Pacific Smart Sound and Gateway Market Volume (K Unit) Forecast, by Application 2019 & 2032
- Table 137: Global Smart Sound and Gateway Market Revenue Million Forecast, by Virtual Assistant 2019 & 2032
- Table 138: Global Smart Sound and Gateway Market Volume K Unit Forecast, by Virtual Assistant 2019 & 2032
- Table 139: Global Smart Sound and Gateway Market Revenue Million Forecast, by Solution 2019 & 2032
- Table 140: Global Smart Sound and Gateway Market Volume K Unit Forecast, by Solution 2019 & 2032
- Table 141: Global Smart Sound and Gateway Market Revenue Million Forecast, by Country 2019 & 2032
- Table 142: Global Smart Sound and Gateway Market Volume K Unit Forecast, by Country 2019 & 2032
Frequently Asked Questions
1. What is the projected Compound Annual Growth Rate (CAGR) of the Smart Sound and Gateway Market?
The projected CAGR is approximately 29.24%.
2. Which companies are prominent players in the Smart Sound and Gateway Market?
Key companies in the market include Baidu Inc, Bose Corporation, Alibaba Group Holding Limited, Plantronics Inc , Samsung Electronics Co Ltd, Google LLC (Alphabet Inc ), Sonos Inc, Xiaomi Inc, Amazon com Inc, Apple Inc.
3. What are the main segments of the Smart Sound and Gateway Market?
The market segments include Virtual Assistant , Solution .
4. Can you provide details about the market size?
The market size is estimated to be USD XX Million as of 2022.
5. What are some drivers contributing to market growth?
Increasing Number of Smart Homes; Growing Consumer Propensity toward Connected Devices.
6. What are the notable trends driving market growth?
Google Assistant to witness a Significant Market Share.
7. Are there any restraints impacting market growth?
Increasing Preference for Live Person Interaction.
8. Can you provide examples of recent developments in the market?
N/A
9. What pricing options are available for accessing the report?
Pricing options include single-user, multi-user, and enterprise licenses priced at USD 4750, USD 5250, and USD 8750 respectively.
10. Is the market size provided in terms of value or volume?
The market size is provided in terms of value, measured in Million and volume, measured in K Unit.
11. Are there any specific market keywords associated with the report?
Yes, the market keyword associated with the report is "Smart Sound and Gateway Market," which aids in identifying and referencing the specific market segment covered.
12. How do I determine which pricing option suits my needs best?
The pricing options vary based on user requirements and access needs. Individual users may opt for single-user licenses, while businesses requiring broader access may choose multi-user or enterprise licenses for cost-effective access to the report.
13. Are there any additional resources or data provided in the Smart Sound and Gateway Market report?
While the report offers comprehensive insights, it's advisable to review the specific contents or supplementary materials provided to ascertain if additional resources or data are available.
14. How can I stay updated on further developments or reports in the Smart Sound and Gateway Market?
To stay informed about further developments, trends, and reports in the Smart Sound and Gateway Market, consider subscribing to industry newsletters, following relevant companies and organizations, or regularly checking reputable industry news sources and publications.
Methodology
Step 1 - Identification of Relevant Samples Size from Population Database


Step 2 - Approaches for Defining Global Market Size (Value, Volume* & Price*)

Note*: In applicable scenarios
Step 3 - Data Sources
Primary Research
- Web Analytics
- Survey Reports
- Research Institute
- Latest Research Reports
- Opinion Leaders
Secondary Research
- Annual Reports
- White Paper
- Latest Press Release
- Industry Association
- Paid Database
- Investor Presentations

Step 4 - Data Triangulation
Involves using different sources of information in order to increase the validity of a study
These sources are likely to be stakeholders in a program - participants, other researchers, program staff, other community members, and so on.
Then we put all data in single framework & apply various statistical tools to find out the dynamic on the market.
During the analysis stage, feedback from the stakeholder groups would be compared to determine areas of agreement as well as areas of divergence
