

Key Insights
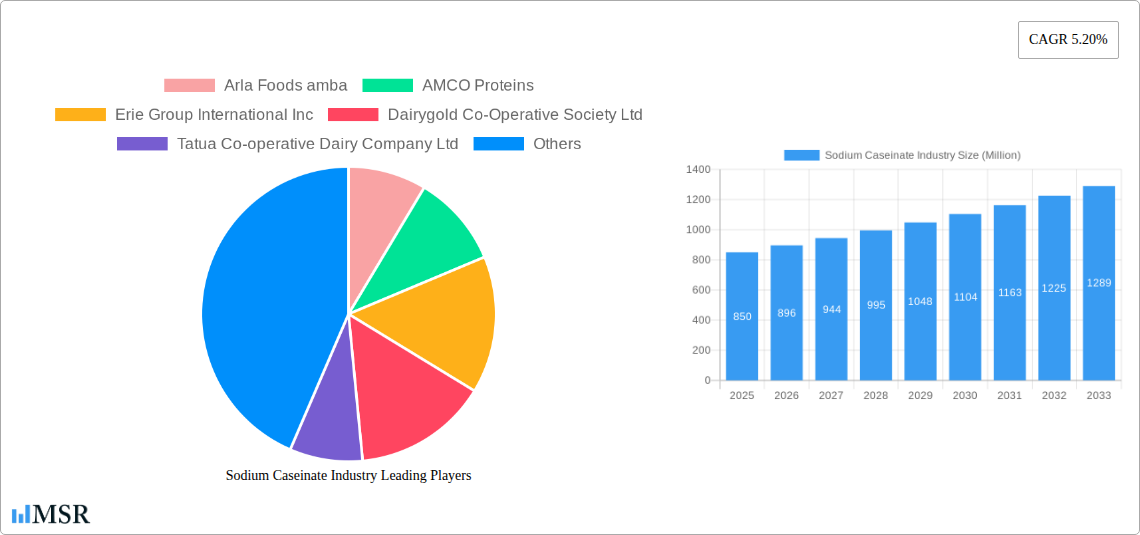
The global sodium caseinate market, a key segment within the broader caseinates industry, is experiencing robust growth, driven by its versatile applications across diverse sectors. With a Compound Annual Growth Rate (CAGR) of 5.20% from 2019-2024, the market's value is projected to continue its upward trajectory throughout the forecast period (2025-2033). Key drivers include the increasing demand for functional food ingredients, particularly in the food and beverage sector, where sodium caseinate serves as an excellent emulsifier, stabilizer, and texturizer. Its use in dietary supplements and pharmaceuticals is also contributing to market expansion, fueled by the growing health-conscious population and advancements in nutritional products. The food and beverage application segment currently holds the largest market share, owing to its widespread use in dairy products, baked goods, and processed meats. However, significant growth potential exists within the dietary supplements and pharmaceutical sectors, driven by innovations in specialized formulations and increasing consumer awareness of nutritional benefits. While challenges such as fluctuations in milk prices and stringent regulatory requirements exist, the market's positive outlook is reinforced by ongoing research and development efforts focused on improving sodium caseinate's functionality and expanding its applications. Competitive landscape analysis reveals a mix of large multinational corporations and regional players, leading to a dynamic market characterized by both innovation and consolidation.
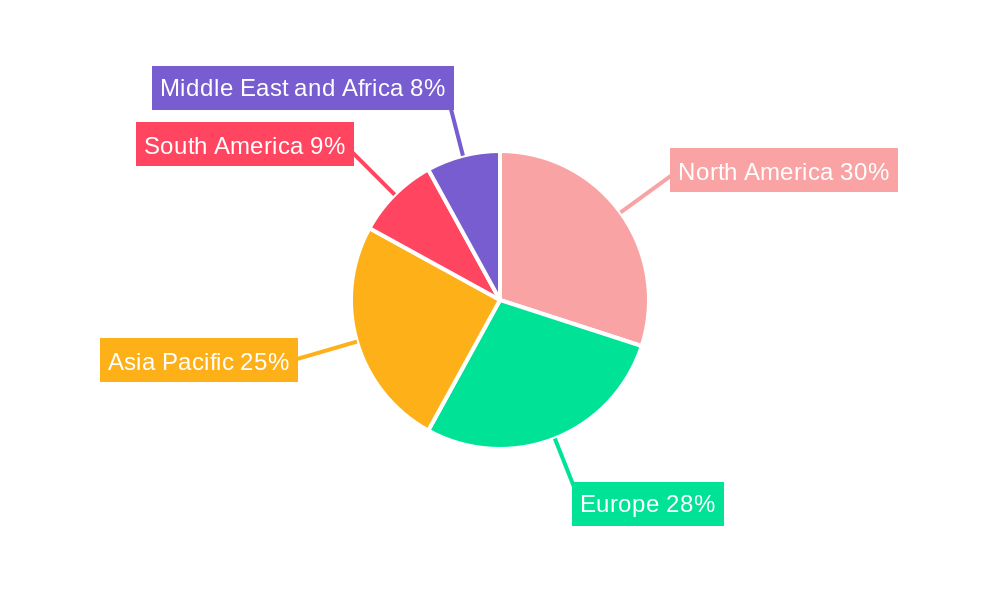
The regional distribution of the sodium caseinate market reflects global consumption patterns, with North America and Europe currently holding significant shares. However, Asia-Pacific is projected to witness the fastest growth rate in the coming years, driven by rising disposable incomes, changing dietary habits, and increased demand for processed foods. South America and the Middle East & Africa also present considerable growth opportunities. This growth is expected to be propelled by increased investment in food processing infrastructure and rising consumer awareness of protein-rich food products. The market segmentation by casein type (Rennet Casein, Acid Casein) further highlights the nuances within this industry. The preference for specific casein types will continue to evolve based on functional requirements and cost-effectiveness. Continuous innovation in manufacturing processes, coupled with the strategic expansion of existing and new players, are critical to successfully navigating the evolving dynamics within this lucrative market. The forecast period promises to be characterized by continuous adaptation to consumer demands and technological advancements.
Sodium Caseinate Industry: A Comprehensive Market Report (2019-2033)
This in-depth report provides a comprehensive analysis of the Sodium Caseinate industry, offering actionable insights for stakeholders across the value chain. From market size and growth projections to key players and emerging trends, this report is an essential resource for understanding the current landscape and future potential of this vital sector. The study period covers 2019-2033, with a base year of 2025 and a forecast period of 2025-2033. The historical period analyzed is 2019-2024. The global Sodium Caseinate market is estimated to be valued at $XX Million in 2025.
Sodium Caseinate Industry Market Concentration & Dynamics
The Sodium Caseinate market exhibits a moderately concentrated structure, with several major players holding significant market share. The industry is characterized by a dynamic interplay of factors including technological innovation, stringent regulatory frameworks, and the presence of substitute products. Mergers and acquisitions (M&A) activities play a crucial role in shaping market dynamics. In the historical period, the number of M&A deals was estimated at xx, reflecting a consolidation trend within the industry. Key players such as Fonterra Co-operative Group Limited and FrieslandCampina NV have exhibited aggressive growth strategies. Market share is anticipated to fluctuate according to product innovation and M&A activity. End-user trends, particularly in the food and beverage sector, significantly influence market growth. Substitute products such as soy protein and whey protein exert competitive pressure, demanding continuous innovation to maintain market share.
Sodium Caseinate Industry Insights & Trends
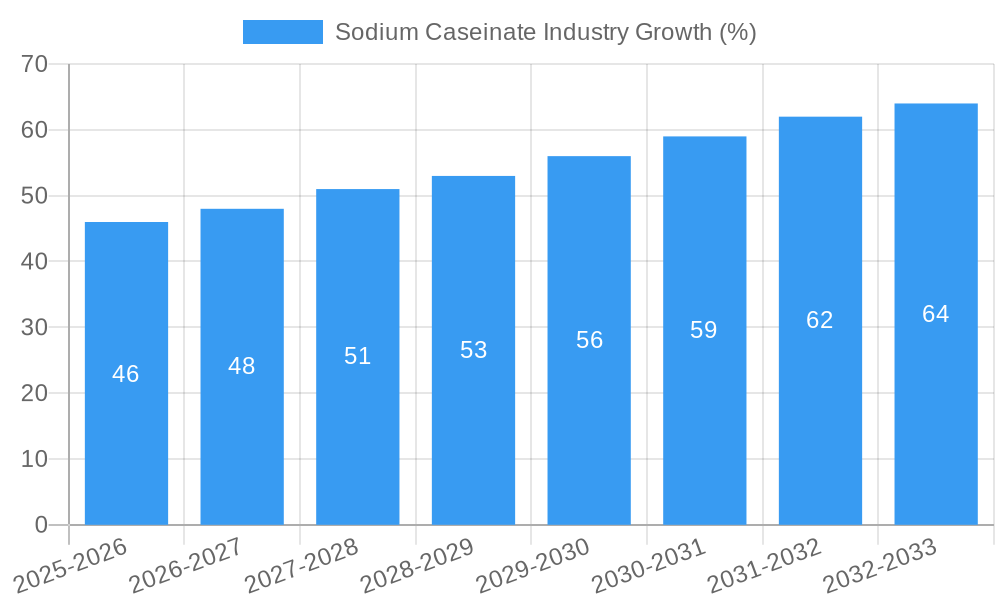
The Sodium Caseinate market experienced significant growth during the historical period (2019-2024), with a Compound Annual Growth Rate (CAGR) of xx%. This growth is primarily driven by the increasing demand for dairy-based ingredients in the food and beverage industry, fueled by changing consumer preferences toward healthier and more nutritious food products. Technological disruptions, such as advancements in casein processing and purification techniques, have further boosted market growth. Evolving consumer behaviors, specifically the rising demand for functional foods and dietary supplements containing protein, have propelled the market's expansion. The forecast period (2025-2033) is projected to witness continued expansion, driven by factors such as rising disposable incomes in developing economies, increased health consciousness, and continued innovation within the industry. The market is anticipated to reach $XX Million by 2033.
Key Markets & Segments Leading Sodium Caseinate Industry
The Sodium Caseinate market is segmented by caseinate type (Calcium, Potassium, Sodium, Other), application (Food and Beverage, Dietary Supplements, Pharmaceuticals, Other), and casein type (Rennet Casein, Acid Casein). While specific market share data is unavailable without further research, the Food and Beverage segment currently dominates the market, with significant applications in dairy products, infant formulas, and bakery items. The Sodium Caseinate type holds a substantial share within the overall caseinate market.
Drivers for Dominant Segments:
- Food & Beverage: Growing demand for protein-rich food products, expansion of the processed food industry, rising health consciousness, and increased disposable incomes.
- Sodium Caseinate: Superior functional properties, including emulsifying, stabilizing, and thickening capabilities compared to other caseinate types.
- Rennet Casein: Traditional production methods and established use in various applications.
Regional Dominance: North America and Europe are expected to remain leading regions, followed by Asia-Pacific, due to factors such as established food processing industries, and strong consumer demand for functional food products.
Sodium Caseinate Industry Product Developments
Recent years have witnessed significant product innovations within the Sodium Caseinate industry, focusing on improving functionality and enhancing product quality. Manufacturers are investing in advanced processing technologies to produce higher-quality caseinate with improved solubility, emulsification, and stability. These improvements are enhancing the usability of sodium caseinate in various applications, contributing to greater adoption across diverse sectors. For example, the development of customized Sodium Caseinate formulations with specific functionalities is improving the efficiency and appeal of the product to different market segments.
Challenges in the Sodium Caseinate Industry Market
The Sodium Caseinate industry faces challenges such as regulatory hurdles related to food safety and labeling requirements, fluctuations in raw material prices (milk), and intense competition from substitute protein sources. Supply chain disruptions, particularly those caused by global events, can also lead to production delays and cost increases. These factors have quantifiable impacts on profitability and market stability. For instance, during 2022, raw material price increases impacted profit margins by an estimated xx%.
Forces Driving Sodium Caseinate Industry Growth
Several factors are driving the growth of the Sodium Caseinate industry. These include increasing consumer demand for protein-rich foods, expansion of the functional food market, technological advancements in casein processing, and the rising popularity of dietary supplements. Government regulations promoting the use of dairy ingredients in certain food products also contribute positively to the industry's expansion. Further, the growth of emerging economies and rising disposable incomes in these regions are also driving market growth.
Long-Term Growth Catalysts in the Sodium Caseinate Industry
Long-term growth will be driven by strategic partnerships between manufacturers and food companies, leading to increased innovation and product development. Expansion into new markets, particularly in developing countries, presents significant opportunities. Furthermore, continued technological advancements in casein processing and purification will enhance the quality and functionality of sodium caseinate, leading to increased demand.
Emerging Opportunities in Sodium Caseinate Industry
Emerging opportunities for the Sodium Caseinate industry include the expansion into novel applications, such as plant-based protein alternatives and personalized nutrition products. Developing innovative formulations for specific needs, such as enhanced solubility, improved texture and taste, will open new avenues for growth. The use of sodium caseinate in clean-label products is also a significant emerging opportunity.
Leading Players in the Sodium Caseinate Industry Sector
- Arla Foods amba
- AMCO Proteins
- Erie Group International Inc
- Dairygold Co-Operative Society Ltd
- Tatua Co-operative Dairy Company Ltd
- Royal FrieslandCampina NV
- Kerry Group PLC
- Fonterra Co-operative Group Limited
- Glanbia PLC
- Groupe Lactalis
- Hoogwegt International BV
Key Milestones in Sodium Caseinate Industry
- March 2021: FrieslandCampina launched a new portfolio of dairy-derived ingredients, including Excellion Calcium Caseinate S, for sports nutrition brands, expanding applications in the functional food sector.
- January 2022: Hoogwegt and Royal A-ware formed a strategic partnership to boost sales of milk powders and cream, strengthening market positioning and distribution capabilities.
- May 2022: Fonterra launched a new online dairy platform, enhancing customer access to dairy ingredients, including specialty dairy proteins, and improving market reach.
Strategic Outlook for Sodium Caseinate Industry Market
The Sodium Caseinate market holds significant future potential. Continued innovation, strategic partnerships, and expansion into new applications and markets will drive substantial growth over the forecast period. The focus on sustainability and clean-label ingredients will present further opportunities for market expansion, particularly in health-conscious consumer segments. The market is poised for continued expansion, benefiting from the global shift towards healthier and more functional foods.
Sodium Caseinate Industry Segmentation
-
1. Casein Type
- 1.1. Rennet Casein
- 1.2. Acid Casein
-
2. Caseinate Type
- 2.1. Calcium
- 2.2. Potassium
- 2.3. Sodium
- 2.4. Other Caseinate Types
-
3. Application
- 3.1. Food and Beverage
- 3.2. Dietary Supplements
- 3.3. Pharmaceuticals
- 3.4. Other Applications
Sodium Caseinate Industry Segmentation By Geography
-
1. North America
- 1.1. United States
- 1.2. Canada
- 1.3. Mexico
- 1.4. Rest of North America
-
2. Europe
- 2.1. Spain
- 2.2. United Kingdom
- 2.3. Germany
- 2.4. France
- 2.5. Italy
- 2.6. Russia
- 2.7. Rest of Europe
-
3. Asia Pacific
- 3.1. China
- 3.2. Japan
- 3.3. India
- 3.4. Australia
- 3.5. Rest of Asia Pacific
-
4. South America
- 4.1. Brazil
- 4.2. Argentina
- 4.3. Rest of South America
-
5. Middle East and Africa
- 5.1. South Africa
- 5.2. Saudi Arabia
- 5.3. Rest of Middle East and Africa
Sodium Caseinate Industry REPORT HIGHLIGHTS
| Aspects | Details |
|---|---|
| Study Period | 2019-2033 |
| Base Year | 2024 |
| Estimated Year | 2025 |
| Forecast Period | 2025-2033 |
| Historical Period | 2019-2024 |
| Growth Rate | CAGR of 5.20% from 2019-2033 |
| Segmentation |
|
Table of Contents
- 1. Introduction
- 1.1. Research Scope
- 1.2. Market Segmentation
- 1.3. Research Methodology
- 1.4. Definitions and Assumptions
- 2. Executive Summary
- 2.1. Introduction
- 3. Market Dynamics
- 3.1. Introduction
- 3.2. Market Drivers
- 3.2.1. Health Benefits Promoting Apple Cider Vinegar Demand; Unfiltered Apple Cider Vinegar Being Popular
- 3.3. Market Restrains
- 3.3.1. Rising Demand for Other Vinegar Types
- 3.4. Market Trends
- 3.4.1. Increasing Application of Casein and Caseinates in Protein-rich Food Products
- 4. Market Factor Analysis
- 4.1. Porters Five Forces
- 4.2. Supply/Value Chain
- 4.3. PESTEL analysis
- 4.4. Market Entropy
- 4.5. Patent/Trademark Analysis
- 5. Global Sodium Caseinate Industry Analysis, Insights and Forecast, 2019-2031
- 5.1. Market Analysis, Insights and Forecast - by Casein Type
- 5.1.1. Rennet Casein
- 5.1.2. Acid Casein
- 5.2. Market Analysis, Insights and Forecast - by Caseinate Type
- 5.2.1. Calcium
- 5.2.2. Potassium
- 5.2.3. Sodium
- 5.2.4. Other Caseinate Types
- 5.3. Market Analysis, Insights and Forecast - by Application
- 5.3.1. Food and Beverage
- 5.3.2. Dietary Supplements
- 5.3.3. Pharmaceuticals
- 5.3.4. Other Applications
- 5.4. Market Analysis, Insights and Forecast - by Region
- 5.4.1. North America
- 5.4.2. Europe
- 5.4.3. Asia Pacific
- 5.4.4. South America
- 5.4.5. Middle East and Africa
- 5.1. Market Analysis, Insights and Forecast - by Casein Type
- 6. North America Sodium Caseinate Industry Analysis, Insights and Forecast, 2019-2031
- 6.1. Market Analysis, Insights and Forecast - by Casein Type
- 6.1.1. Rennet Casein
- 6.1.2. Acid Casein
- 6.2. Market Analysis, Insights and Forecast - by Caseinate Type
- 6.2.1. Calcium
- 6.2.2. Potassium
- 6.2.3. Sodium
- 6.2.4. Other Caseinate Types
- 6.3. Market Analysis, Insights and Forecast - by Application
- 6.3.1. Food and Beverage
- 6.3.2. Dietary Supplements
- 6.3.3. Pharmaceuticals
- 6.3.4. Other Applications
- 6.1. Market Analysis, Insights and Forecast - by Casein Type
- 7. Europe Sodium Caseinate Industry Analysis, Insights and Forecast, 2019-2031
- 7.1. Market Analysis, Insights and Forecast - by Casein Type
- 7.1.1. Rennet Casein
- 7.1.2. Acid Casein
- 7.2. Market Analysis, Insights and Forecast - by Caseinate Type
- 7.2.1. Calcium
- 7.2.2. Potassium
- 7.2.3. Sodium
- 7.2.4. Other Caseinate Types
- 7.3. Market Analysis, Insights and Forecast - by Application
- 7.3.1. Food and Beverage
- 7.3.2. Dietary Supplements
- 7.3.3. Pharmaceuticals
- 7.3.4. Other Applications
- 7.1. Market Analysis, Insights and Forecast - by Casein Type
- 8. Asia Pacific Sodium Caseinate Industry Analysis, Insights and Forecast, 2019-2031
- 8.1. Market Analysis, Insights and Forecast - by Casein Type
- 8.1.1. Rennet Casein
- 8.1.2. Acid Casein
- 8.2. Market Analysis, Insights and Forecast - by Caseinate Type
- 8.2.1. Calcium
- 8.2.2. Potassium
- 8.2.3. Sodium
- 8.2.4. Other Caseinate Types
- 8.3. Market Analysis, Insights and Forecast - by Application
- 8.3.1. Food and Beverage
- 8.3.2. Dietary Supplements
- 8.3.3. Pharmaceuticals
- 8.3.4. Other Applications
- 8.1. Market Analysis, Insights and Forecast - by Casein Type
- 9. South America Sodium Caseinate Industry Analysis, Insights and Forecast, 2019-2031
- 9.1. Market Analysis, Insights and Forecast - by Casein Type
- 9.1.1. Rennet Casein
- 9.1.2. Acid Casein
- 9.2. Market Analysis, Insights and Forecast - by Caseinate Type
- 9.2.1. Calcium
- 9.2.2. Potassium
- 9.2.3. Sodium
- 9.2.4. Other Caseinate Types
- 9.3. Market Analysis, Insights and Forecast - by Application
- 9.3.1. Food and Beverage
- 9.3.2. Dietary Supplements
- 9.3.3. Pharmaceuticals
- 9.3.4. Other Applications
- 9.1. Market Analysis, Insights and Forecast - by Casein Type
- 10. Middle East and Africa Sodium Caseinate Industry Analysis, Insights and Forecast, 2019-2031
- 10.1. Market Analysis, Insights and Forecast - by Casein Type
- 10.1.1. Rennet Casein
- 10.1.2. Acid Casein
- 10.2. Market Analysis, Insights and Forecast - by Caseinate Type
- 10.2.1. Calcium
- 10.2.2. Potassium
- 10.2.3. Sodium
- 10.2.4. Other Caseinate Types
- 10.3. Market Analysis, Insights and Forecast - by Application
- 10.3.1. Food and Beverage
- 10.3.2. Dietary Supplements
- 10.3.3. Pharmaceuticals
- 10.3.4. Other Applications
- 10.1. Market Analysis, Insights and Forecast - by Casein Type
- 11. North America Sodium Caseinate Industry Analysis, Insights and Forecast, 2019-2031
- 11.1. Market Analysis, Insights and Forecast - By Country/Sub-region
- 11.1.1 United States
- 11.1.2 Canada
- 11.1.3 Mexico
- 11.1.4 Rest of North America
- 12. Europe Sodium Caseinate Industry Analysis, Insights and Forecast, 2019-2031
- 12.1. Market Analysis, Insights and Forecast - By Country/Sub-region
- 12.1.1 Spain
- 12.1.2 United Kingdom
- 12.1.3 Germany
- 12.1.4 France
- 12.1.5 Italy
- 12.1.6 Russia
- 12.1.7 Rest of Europe
- 13. Asia Pacific Sodium Caseinate Industry Analysis, Insights and Forecast, 2019-2031
- 13.1. Market Analysis, Insights and Forecast - By Country/Sub-region
- 13.1.1 China
- 13.1.2 Japan
- 13.1.3 India
- 13.1.4 Australia
- 13.1.5 Rest of Asia Pacific
- 14. South America Sodium Caseinate Industry Analysis, Insights and Forecast, 2019-2031
- 14.1. Market Analysis, Insights and Forecast - By Country/Sub-region
- 14.1.1 Brazil
- 14.1.2 Argentina
- 14.1.3 Rest of South America
- 15. Middle East and Africa Sodium Caseinate Industry Analysis, Insights and Forecast, 2019-2031
- 15.1. Market Analysis, Insights and Forecast - By Country/Sub-region
- 15.1.1 South Africa
- 15.1.2 Saudi Arabia
- 15.1.3 Rest of Middle East and Africa
- 16. Competitive Analysis
- 16.1. Global Market Share Analysis 2024
- 16.2. Company Profiles
- 16.2.1 Arla Foods amba
- 16.2.1.1. Overview
- 16.2.1.2. Products
- 16.2.1.3. SWOT Analysis
- 16.2.1.4. Recent Developments
- 16.2.1.5. Financials (Based on Availability)
- 16.2.2 AMCO Proteins
- 16.2.2.1. Overview
- 16.2.2.2. Products
- 16.2.2.3. SWOT Analysis
- 16.2.2.4. Recent Developments
- 16.2.2.5. Financials (Based on Availability)
- 16.2.3 Erie Group International Inc
- 16.2.3.1. Overview
- 16.2.3.2. Products
- 16.2.3.3. SWOT Analysis
- 16.2.3.4. Recent Developments
- 16.2.3.5. Financials (Based on Availability)
- 16.2.4 Dairygold Co-Operative Society Ltd
- 16.2.4.1. Overview
- 16.2.4.2. Products
- 16.2.4.3. SWOT Analysis
- 16.2.4.4. Recent Developments
- 16.2.4.5. Financials (Based on Availability)
- 16.2.5 Tatua Co-operative Dairy Company Ltd
- 16.2.5.1. Overview
- 16.2.5.2. Products
- 16.2.5.3. SWOT Analysis
- 16.2.5.4. Recent Developments
- 16.2.5.5. Financials (Based on Availability)
- 16.2.6 Royal FrieslandCampina NV
- 16.2.6.1. Overview
- 16.2.6.2. Products
- 16.2.6.3. SWOT Analysis
- 16.2.6.4. Recent Developments
- 16.2.6.5. Financials (Based on Availability)
- 16.2.7 Kerry Group PLC
- 16.2.7.1. Overview
- 16.2.7.2. Products
- 16.2.7.3. SWOT Analysis
- 16.2.7.4. Recent Developments
- 16.2.7.5. Financials (Based on Availability)
- 16.2.8 Fonterra Co-operative Group Limited
- 16.2.8.1. Overview
- 16.2.8.2. Products
- 16.2.8.3. SWOT Analysis
- 16.2.8.4. Recent Developments
- 16.2.8.5. Financials (Based on Availability)
- 16.2.9 Glanbia PLC*List Not Exhaustive
- 16.2.9.1. Overview
- 16.2.9.2. Products
- 16.2.9.3. SWOT Analysis
- 16.2.9.4. Recent Developments
- 16.2.9.5. Financials (Based on Availability)
- 16.2.10 Groupe Lactalis
- 16.2.10.1. Overview
- 16.2.10.2. Products
- 16.2.10.3. SWOT Analysis
- 16.2.10.4. Recent Developments
- 16.2.10.5. Financials (Based on Availability)
- 16.2.11 Hoogwegt International BV
- 16.2.11.1. Overview
- 16.2.11.2. Products
- 16.2.11.3. SWOT Analysis
- 16.2.11.4. Recent Developments
- 16.2.11.5. Financials (Based on Availability)
- 16.2.1 Arla Foods amba
List of Figures
- Figure 1: Global Sodium Caseinate Industry Revenue Breakdown (Million, %) by Region 2024 & 2032
- Figure 2: North America Sodium Caseinate Industry Revenue (Million), by Country 2024 & 2032
- Figure 3: North America Sodium Caseinate Industry Revenue Share (%), by Country 2024 & 2032
- Figure 4: Europe Sodium Caseinate Industry Revenue (Million), by Country 2024 & 2032
- Figure 5: Europe Sodium Caseinate Industry Revenue Share (%), by Country 2024 & 2032
- Figure 6: Asia Pacific Sodium Caseinate Industry Revenue (Million), by Country 2024 & 2032
- Figure 7: Asia Pacific Sodium Caseinate Industry Revenue Share (%), by Country 2024 & 2032
- Figure 8: South America Sodium Caseinate Industry Revenue (Million), by Country 2024 & 2032
- Figure 9: South America Sodium Caseinate Industry Revenue Share (%), by Country 2024 & 2032
- Figure 10: Middle East and Africa Sodium Caseinate Industry Revenue (Million), by Country 2024 & 2032
- Figure 11: Middle East and Africa Sodium Caseinate Industry Revenue Share (%), by Country 2024 & 2032
- Figure 12: North America Sodium Caseinate Industry Revenue (Million), by Casein Type 2024 & 2032
- Figure 13: North America Sodium Caseinate Industry Revenue Share (%), by Casein Type 2024 & 2032
- Figure 14: North America Sodium Caseinate Industry Revenue (Million), by Caseinate Type 2024 & 2032
- Figure 15: North America Sodium Caseinate Industry Revenue Share (%), by Caseinate Type 2024 & 2032
- Figure 16: North America Sodium Caseinate Industry Revenue (Million), by Application 2024 & 2032
- Figure 17: North America Sodium Caseinate Industry Revenue Share (%), by Application 2024 & 2032
- Figure 18: North America Sodium Caseinate Industry Revenue (Million), by Country 2024 & 2032
- Figure 19: North America Sodium Caseinate Industry Revenue Share (%), by Country 2024 & 2032
- Figure 20: Europe Sodium Caseinate Industry Revenue (Million), by Casein Type 2024 & 2032
- Figure 21: Europe Sodium Caseinate Industry Revenue Share (%), by Casein Type 2024 & 2032
- Figure 22: Europe Sodium Caseinate Industry Revenue (Million), by Caseinate Type 2024 & 2032
- Figure 23: Europe Sodium Caseinate Industry Revenue Share (%), by Caseinate Type 2024 & 2032
- Figure 24: Europe Sodium Caseinate Industry Revenue (Million), by Application 2024 & 2032
- Figure 25: Europe Sodium Caseinate Industry Revenue Share (%), by Application 2024 & 2032
- Figure 26: Europe Sodium Caseinate Industry Revenue (Million), by Country 2024 & 2032
- Figure 27: Europe Sodium Caseinate Industry Revenue Share (%), by Country 2024 & 2032
- Figure 28: Asia Pacific Sodium Caseinate Industry Revenue (Million), by Casein Type 2024 & 2032
- Figure 29: Asia Pacific Sodium Caseinate Industry Revenue Share (%), by Casein Type 2024 & 2032
- Figure 30: Asia Pacific Sodium Caseinate Industry Revenue (Million), by Caseinate Type 2024 & 2032
- Figure 31: Asia Pacific Sodium Caseinate Industry Revenue Share (%), by Caseinate Type 2024 & 2032
- Figure 32: Asia Pacific Sodium Caseinate Industry Revenue (Million), by Application 2024 & 2032
- Figure 33: Asia Pacific Sodium Caseinate Industry Revenue Share (%), by Application 2024 & 2032
- Figure 34: Asia Pacific Sodium Caseinate Industry Revenue (Million), by Country 2024 & 2032
- Figure 35: Asia Pacific Sodium Caseinate Industry Revenue Share (%), by Country 2024 & 2032
- Figure 36: South America Sodium Caseinate Industry Revenue (Million), by Casein Type 2024 & 2032
- Figure 37: South America Sodium Caseinate Industry Revenue Share (%), by Casein Type 2024 & 2032
- Figure 38: South America Sodium Caseinate Industry Revenue (Million), by Caseinate Type 2024 & 2032
- Figure 39: South America Sodium Caseinate Industry Revenue Share (%), by Caseinate Type 2024 & 2032
- Figure 40: South America Sodium Caseinate Industry Revenue (Million), by Application 2024 & 2032
- Figure 41: South America Sodium Caseinate Industry Revenue Share (%), by Application 2024 & 2032
- Figure 42: South America Sodium Caseinate Industry Revenue (Million), by Country 2024 & 2032
- Figure 43: South America Sodium Caseinate Industry Revenue Share (%), by Country 2024 & 2032
- Figure 44: Middle East and Africa Sodium Caseinate Industry Revenue (Million), by Casein Type 2024 & 2032
- Figure 45: Middle East and Africa Sodium Caseinate Industry Revenue Share (%), by Casein Type 2024 & 2032
- Figure 46: Middle East and Africa Sodium Caseinate Industry Revenue (Million), by Caseinate Type 2024 & 2032
- Figure 47: Middle East and Africa Sodium Caseinate Industry Revenue Share (%), by Caseinate Type 2024 & 2032
- Figure 48: Middle East and Africa Sodium Caseinate Industry Revenue (Million), by Application 2024 & 2032
- Figure 49: Middle East and Africa Sodium Caseinate Industry Revenue Share (%), by Application 2024 & 2032
- Figure 50: Middle East and Africa Sodium Caseinate Industry Revenue (Million), by Country 2024 & 2032
- Figure 51: Middle East and Africa Sodium Caseinate Industry Revenue Share (%), by Country 2024 & 2032
List of Tables
- Table 1: Global Sodium Caseinate Industry Revenue Million Forecast, by Region 2019 & 2032
- Table 2: Global Sodium Caseinate Industry Revenue Million Forecast, by Casein Type 2019 & 2032
- Table 3: Global Sodium Caseinate Industry Revenue Million Forecast, by Caseinate Type 2019 & 2032
- Table 4: Global Sodium Caseinate Industry Revenue Million Forecast, by Application 2019 & 2032
- Table 5: Global Sodium Caseinate Industry Revenue Million Forecast, by Region 2019 & 2032
- Table 6: Global Sodium Caseinate Industry Revenue Million Forecast, by Country 2019 & 2032
- Table 7: United States Sodium Caseinate Industry Revenue (Million) Forecast, by Application 2019 & 2032
- Table 8: Canada Sodium Caseinate Industry Revenue (Million) Forecast, by Application 2019 & 2032
- Table 9: Mexico Sodium Caseinate Industry Revenue (Million) Forecast, by Application 2019 & 2032
- Table 10: Rest of North America Sodium Caseinate Industry Revenue (Million) Forecast, by Application 2019 & 2032
- Table 11: Global Sodium Caseinate Industry Revenue Million Forecast, by Country 2019 & 2032
- Table 12: Spain Sodium Caseinate Industry Revenue (Million) Forecast, by Application 2019 & 2032
- Table 13: United Kingdom Sodium Caseinate Industry Revenue (Million) Forecast, by Application 2019 & 2032
- Table 14: Germany Sodium Caseinate Industry Revenue (Million) Forecast, by Application 2019 & 2032
- Table 15: France Sodium Caseinate Industry Revenue (Million) Forecast, by Application 2019 & 2032
- Table 16: Italy Sodium Caseinate Industry Revenue (Million) Forecast, by Application 2019 & 2032
- Table 17: Russia Sodium Caseinate Industry Revenue (Million) Forecast, by Application 2019 & 2032
- Table 18: Rest of Europe Sodium Caseinate Industry Revenue (Million) Forecast, by Application 2019 & 2032
- Table 19: Global Sodium Caseinate Industry Revenue Million Forecast, by Country 2019 & 2032
- Table 20: China Sodium Caseinate Industry Revenue (Million) Forecast, by Application 2019 & 2032
- Table 21: Japan Sodium Caseinate Industry Revenue (Million) Forecast, by Application 2019 & 2032
- Table 22: India Sodium Caseinate Industry Revenue (Million) Forecast, by Application 2019 & 2032
- Table 23: Australia Sodium Caseinate Industry Revenue (Million) Forecast, by Application 2019 & 2032
- Table 24: Rest of Asia Pacific Sodium Caseinate Industry Revenue (Million) Forecast, by Application 2019 & 2032
- Table 25: Global Sodium Caseinate Industry Revenue Million Forecast, by Country 2019 & 2032
- Table 26: Brazil Sodium Caseinate Industry Revenue (Million) Forecast, by Application 2019 & 2032
- Table 27: Argentina Sodium Caseinate Industry Revenue (Million) Forecast, by Application 2019 & 2032
- Table 28: Rest of South America Sodium Caseinate Industry Revenue (Million) Forecast, by Application 2019 & 2032
- Table 29: Global Sodium Caseinate Industry Revenue Million Forecast, by Country 2019 & 2032
- Table 30: South Africa Sodium Caseinate Industry Revenue (Million) Forecast, by Application 2019 & 2032
- Table 31: Saudi Arabia Sodium Caseinate Industry Revenue (Million) Forecast, by Application 2019 & 2032
- Table 32: Rest of Middle East and Africa Sodium Caseinate Industry Revenue (Million) Forecast, by Application 2019 & 2032
- Table 33: Global Sodium Caseinate Industry Revenue Million Forecast, by Casein Type 2019 & 2032
- Table 34: Global Sodium Caseinate Industry Revenue Million Forecast, by Caseinate Type 2019 & 2032
- Table 35: Global Sodium Caseinate Industry Revenue Million Forecast, by Application 2019 & 2032
- Table 36: Global Sodium Caseinate Industry Revenue Million Forecast, by Country 2019 & 2032
- Table 37: United States Sodium Caseinate Industry Revenue (Million) Forecast, by Application 2019 & 2032
- Table 38: Canada Sodium Caseinate Industry Revenue (Million) Forecast, by Application 2019 & 2032
- Table 39: Mexico Sodium Caseinate Industry Revenue (Million) Forecast, by Application 2019 & 2032
- Table 40: Rest of North America Sodium Caseinate Industry Revenue (Million) Forecast, by Application 2019 & 2032
- Table 41: Global Sodium Caseinate Industry Revenue Million Forecast, by Casein Type 2019 & 2032
- Table 42: Global Sodium Caseinate Industry Revenue Million Forecast, by Caseinate Type 2019 & 2032
- Table 43: Global Sodium Caseinate Industry Revenue Million Forecast, by Application 2019 & 2032
- Table 44: Global Sodium Caseinate Industry Revenue Million Forecast, by Country 2019 & 2032
- Table 45: Spain Sodium Caseinate Industry Revenue (Million) Forecast, by Application 2019 & 2032
- Table 46: United Kingdom Sodium Caseinate Industry Revenue (Million) Forecast, by Application 2019 & 2032
- Table 47: Germany Sodium Caseinate Industry Revenue (Million) Forecast, by Application 2019 & 2032
- Table 48: France Sodium Caseinate Industry Revenue (Million) Forecast, by Application 2019 & 2032
- Table 49: Italy Sodium Caseinate Industry Revenue (Million) Forecast, by Application 2019 & 2032
- Table 50: Russia Sodium Caseinate Industry Revenue (Million) Forecast, by Application 2019 & 2032
- Table 51: Rest of Europe Sodium Caseinate Industry Revenue (Million) Forecast, by Application 2019 & 2032
- Table 52: Global Sodium Caseinate Industry Revenue Million Forecast, by Casein Type 2019 & 2032
- Table 53: Global Sodium Caseinate Industry Revenue Million Forecast, by Caseinate Type 2019 & 2032
- Table 54: Global Sodium Caseinate Industry Revenue Million Forecast, by Application 2019 & 2032
- Table 55: Global Sodium Caseinate Industry Revenue Million Forecast, by Country 2019 & 2032
- Table 56: China Sodium Caseinate Industry Revenue (Million) Forecast, by Application 2019 & 2032
- Table 57: Japan Sodium Caseinate Industry Revenue (Million) Forecast, by Application 2019 & 2032
- Table 58: India Sodium Caseinate Industry Revenue (Million) Forecast, by Application 2019 & 2032
- Table 59: Australia Sodium Caseinate Industry Revenue (Million) Forecast, by Application 2019 & 2032
- Table 60: Rest of Asia Pacific Sodium Caseinate Industry Revenue (Million) Forecast, by Application 2019 & 2032
- Table 61: Global Sodium Caseinate Industry Revenue Million Forecast, by Casein Type 2019 & 2032
- Table 62: Global Sodium Caseinate Industry Revenue Million Forecast, by Caseinate Type 2019 & 2032
- Table 63: Global Sodium Caseinate Industry Revenue Million Forecast, by Application 2019 & 2032
- Table 64: Global Sodium Caseinate Industry Revenue Million Forecast, by Country 2019 & 2032
- Table 65: Brazil Sodium Caseinate Industry Revenue (Million) Forecast, by Application 2019 & 2032
- Table 66: Argentina Sodium Caseinate Industry Revenue (Million) Forecast, by Application 2019 & 2032
- Table 67: Rest of South America Sodium Caseinate Industry Revenue (Million) Forecast, by Application 2019 & 2032
- Table 68: Global Sodium Caseinate Industry Revenue Million Forecast, by Casein Type 2019 & 2032
- Table 69: Global Sodium Caseinate Industry Revenue Million Forecast, by Caseinate Type 2019 & 2032
- Table 70: Global Sodium Caseinate Industry Revenue Million Forecast, by Application 2019 & 2032
- Table 71: Global Sodium Caseinate Industry Revenue Million Forecast, by Country 2019 & 2032
- Table 72: South Africa Sodium Caseinate Industry Revenue (Million) Forecast, by Application 2019 & 2032
- Table 73: Saudi Arabia Sodium Caseinate Industry Revenue (Million) Forecast, by Application 2019 & 2032
- Table 74: Rest of Middle East and Africa Sodium Caseinate Industry Revenue (Million) Forecast, by Application 2019 & 2032
Frequently Asked Questions
1. What is the projected Compound Annual Growth Rate (CAGR) of the Sodium Caseinate Industry?
The projected CAGR is approximately 5.20%.
2. Which companies are prominent players in the Sodium Caseinate Industry?
Key companies in the market include Arla Foods amba, AMCO Proteins, Erie Group International Inc, Dairygold Co-Operative Society Ltd, Tatua Co-operative Dairy Company Ltd, Royal FrieslandCampina NV, Kerry Group PLC, Fonterra Co-operative Group Limited, Glanbia PLC*List Not Exhaustive, Groupe Lactalis, Hoogwegt International BV.
3. What are the main segments of the Sodium Caseinate Industry?
The market segments include Casein Type, Caseinate Type, Application.
4. Can you provide details about the market size?
The market size is estimated to be USD XX Million as of 2022.
5. What are some drivers contributing to market growth?
Health Benefits Promoting Apple Cider Vinegar Demand; Unfiltered Apple Cider Vinegar Being Popular.
6. What are the notable trends driving market growth?
Increasing Application of Casein and Caseinates in Protein-rich Food Products.
7. Are there any restraints impacting market growth?
Rising Demand for Other Vinegar Types.
8. Can you provide examples of recent developments in the market?
May 2022: Fonterra launched a new online dairy platform that makes it easier for customers to choose dairy ingredients ranging from milk powder to specialty dairy proteins.
9. What pricing options are available for accessing the report?
Pricing options include single-user, multi-user, and enterprise licenses priced at USD 4750, USD 5250, and USD 8750 respectively.
10. Is the market size provided in terms of value or volume?
The market size is provided in terms of value, measured in Million.
11. Are there any specific market keywords associated with the report?
Yes, the market keyword associated with the report is "Sodium Caseinate Industry," which aids in identifying and referencing the specific market segment covered.
12. How do I determine which pricing option suits my needs best?
The pricing options vary based on user requirements and access needs. Individual users may opt for single-user licenses, while businesses requiring broader access may choose multi-user or enterprise licenses for cost-effective access to the report.
13. Are there any additional resources or data provided in the Sodium Caseinate Industry report?
While the report offers comprehensive insights, it's advisable to review the specific contents or supplementary materials provided to ascertain if additional resources or data are available.
14. How can I stay updated on further developments or reports in the Sodium Caseinate Industry?
To stay informed about further developments, trends, and reports in the Sodium Caseinate Industry, consider subscribing to industry newsletters, following relevant companies and organizations, or regularly checking reputable industry news sources and publications.
Methodology
Step 1 - Identification of Relevant Samples Size from Population Database


Step 2 - Approaches for Defining Global Market Size (Value, Volume* & Price*)

Note*: In applicable scenarios
Step 3 - Data Sources
Primary Research
- Web Analytics
- Survey Reports
- Research Institute
- Latest Research Reports
- Opinion Leaders
Secondary Research
- Annual Reports
- White Paper
- Latest Press Release
- Industry Association
- Paid Database
- Investor Presentations

Step 4 - Data Triangulation
Involves using different sources of information in order to increase the validity of a study
These sources are likely to be stakeholders in a program - participants, other researchers, program staff, other community members, and so on.
Then we put all data in single framework & apply various statistical tools to find out the dynamic on the market.
During the analysis stage, feedback from the stakeholder groups would be compared to determine areas of agreement as well as areas of divergence
