

Key Insights
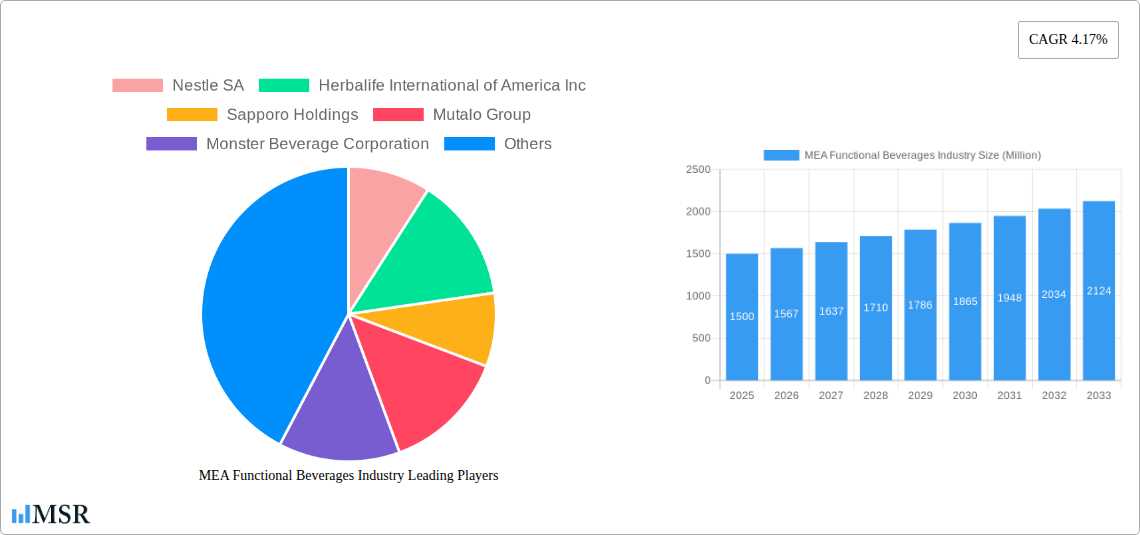
The Middle East and Africa (MEA) Functional Beverages market, comprising energy drinks, fortified juices, sports drinks, and dairy-based beverages, exhibits a robust growth trajectory. Fueled by heightened health awareness, escalating disposable incomes, and a significant youth demographic, the market is poised for substantial expansion from 2025 to 2033. Projections indicate a Compound Annual Growth Rate (CAGR) of 5.6%, leading to a projected market size of $171.86 billion by the base year of 2025. Key distribution channels include supermarkets, hypermarkets, pharmacies, convenience stores, and the rapidly growing online retail sector. While major global entities like Coca-Cola, PepsiCo, and Red Bull hold substantial market share, opportunities exist for niche players focusing on organic or regionally sourced functional beverages.
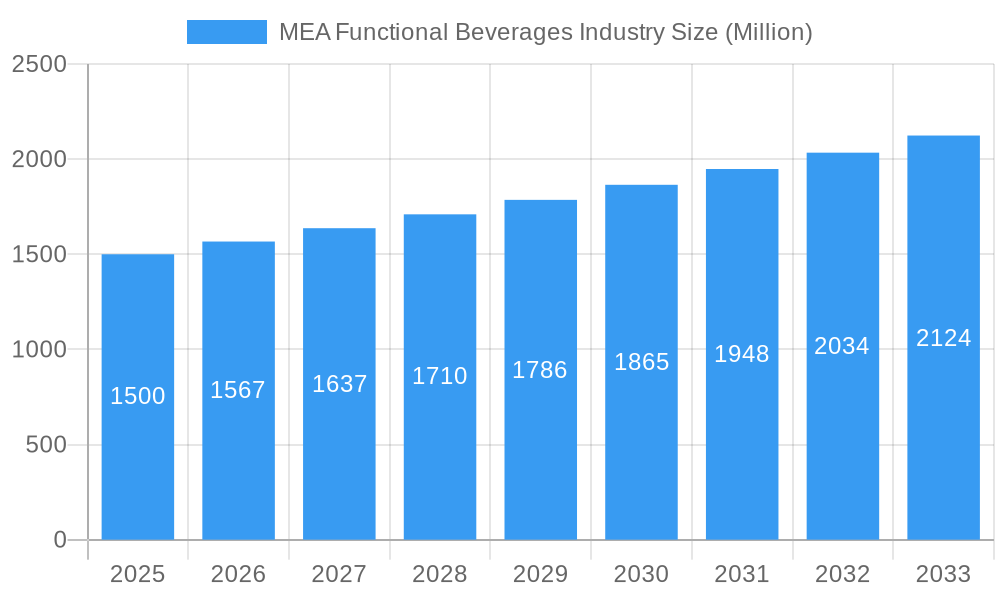
MEA Functional Beverages Industry Market Size (In Billion)
Challenges within the MEA functional beverage sector include price volatility of raw materials, intense market competition, and the need to address consumer concerns regarding potential health implications of certain products. Sustained growth will hinge on effective marketing strategies targeting health-conscious consumers, expansion of distribution networks, and the introduction of innovative products aligned with regional tastes and preferences. Multinational corporations' prominence underscores the necessity for local brands to cultivate distinct brand identities and leverage specific cultural preferences across the diverse MEA region. Product innovation is paramount, emphasizing healthier formulations, natural ingredients, and targeted functional benefits such as immune support and enhanced athletic performance. Regulatory frameworks concerning product labeling and ingredient standards will significantly influence market dynamics. Successful market penetration will necessitate strategic alliances, precise marketing initiatives, and a dedication to sustainable and ethical sourcing practices. The escalating adoption of e-commerce presents a critical avenue for growth, requiring brands to bolster their online presence and logistical infrastructure to reach an extensive consumer base.
MEA Functional Beverages Industry Company Market Share
MEA Functional Beverages Industry: A Comprehensive Market Report (2019-2033)
This comprehensive report provides an in-depth analysis of the Middle East and Africa (MEA) functional beverages industry, covering the period 2019-2033. It offers invaluable insights into market dynamics, key players, emerging trends, and future growth potential, equipping stakeholders with actionable intelligence for strategic decision-making. The report meticulously analyzes market size, CAGR, and key segments, providing a 360-degree view of this dynamic sector. With a focus on the base year 2025 and a forecast period extending to 2033, this report is an essential resource for investors, manufacturers, distributors, and anyone seeking to understand the MEA functional beverages landscape. The market value is predicted to reach xx Million by 2033.
MEA Functional Beverages Industry Market Concentration & Dynamics
The MEA functional beverages market exhibits a moderately concentrated structure, with key players like Nestle SA, The Coca-Cola Company, PepsiCo Inc, and Red Bull GmbH holding significant market share. However, the presence of numerous regional and smaller players contributes to a dynamic competitive environment. The industry's innovation ecosystem is characterized by continuous product development, focusing on health and wellness attributes. Regulatory frameworks vary across MEA countries, influencing product formulations and labeling requirements. Substitute products, such as traditional beverages and nutritional supplements, pose a competitive challenge. Evolving consumer preferences towards healthier and functional options fuel market growth, while M&A activities drive consolidation.
- Market Share (2024 Estimate): Nestle SA (xx%), Coca-Cola (xx%), PepsiCo (xx%), Red Bull (xx%), Others (xx%).
- M&A Deal Count (2019-2024): xx deals.
- Key Innovation Areas: Natural ingredients, low-sugar formulations, enhanced nutritional profiles, sustainable packaging.
MEA Functional Beverages Industry Industry Insights & Trends
The MEA functional beverages market is experiencing robust growth, driven by rising health consciousness, increasing disposable incomes, and a growing young population. Technological advancements in beverage processing and packaging contribute to improved product quality and shelf life. Consumer behavior is shifting towards healthier choices, with demand for functional beverages that cater to specific health needs increasing substantially. The market size in 2024 is estimated at xx Million, exhibiting a CAGR of xx% during the historical period (2019-2024). The forecast period (2025-2033) projects continued growth, propelled by factors such as rising urbanization, changing lifestyles, and the increasing popularity of sports and fitness activities. The market is expected to reach xx Million by 2033.
Key Markets & Segments Leading MEA Functional Beverages Industry
The Supermarket/Hypermarket channel dominates the MEA functional beverages distribution landscape, owing to its wide reach and established presence across the region. Energy drinks and sports drinks constitute the largest product segments, driven by rising health awareness and the popularity of fitness activities. The UAE and Saudi Arabia are key markets within the region, showcasing robust growth due to high per capita consumption and favorable demographics.
Key Market Drivers:
- Economic Growth: Rising disposable incomes fuel demand for premium functional beverages.
- Infrastructure Development: Enhanced cold chain logistics improve product availability.
- Urbanization: Growing urban populations increase consumption of convenience-oriented beverages.
- Health and Wellness Trend: Consumers are increasingly seeking beverages that support their health and fitness goals.
Dominance Analysis:
- Distribution Channel: Supermarket/Hypermarket holds the largest share, followed by convenience stores and online retail.
- Product Type: Energy drinks are the largest segment, followed by sports drinks and fortified juices.
- Geographic Region: The UAE and Saudi Arabia are the dominant markets, driving overall industry growth.
MEA Functional Beverages Industry Product Developments
Recent years have witnessed significant product innovations in the MEA functional beverages market. Companies are focusing on creating beverages with natural ingredients, enhanced nutritional value, and unique flavor profiles to cater to evolving consumer preferences. Technological advancements in beverage processing and packaging have also improved product quality and shelf life. Examples include the launch of hemp-based energy drinks and organic, low-calorie carbonated energy beverages. These innovations highlight the trend of providing healthier and more functional beverage options.
Challenges in the MEA Functional Beverages Industry Market
The MEA functional beverages market faces challenges such as stringent regulatory requirements for labeling and ingredient approvals, which can increase manufacturing costs and time-to-market. Supply chain disruptions due to geopolitical factors and the volatile nature of raw material prices also pose risks. Intense competition from established players and the emergence of new brands further complicates the market. These factors collectively impact profitability and market share.
Forces Driving MEA Functional Beverages Industry Growth
Technological advancements such as improved production processes and innovative packaging solutions play a vital role in driving growth. Economic factors like rising disposable incomes and increased purchasing power contribute to heightened consumer spending on premium functional beverages. Favorable government policies and regulations encouraging the production and consumption of healthier beverages also provide support. Examples include the promotion of healthy lifestyles and investments in infrastructure that facilitates efficient distribution networks.
Challenges in the MEA Functional Beverages Industry Market
Long-term growth in the MEA functional beverages industry hinges on sustained innovation in product formulations, flavors, and packaging. Strategic partnerships and collaborations between manufacturers and distributors will be key to expanding market reach and distribution networks. Geographical expansion into untapped markets within the MEA region will also be a significant driver of future growth.
Emerging Opportunities in MEA Functional Beverages Industry
The growing demand for plant-based and organic functional beverages presents a significant opportunity. The increasing penetration of e-commerce and online retail channels offers new distribution avenues for manufacturers. Catering to specific dietary needs and health conditions (e.g., diabetic-friendly, low-sodium) will unlock further market potential. Focusing on sustainable and eco-friendly packaging solutions will resonate with environmentally conscious consumers.
Leading Players in the MEA Functional Beverages Industry Sector
- Nestle SA
- Herbalife International of America Inc
- Sapporo Holdings
- Mutalo Group
- Monster Beverage Corporation
- PepsiCo Inc
- Dr Pepper Snapple
- Viju Industries Nigeria Ltd
- iPRO Sport Distribution Limited
- Red Bull GmbH
- The Coca-Cola Company
Key Milestones in MEA Functional Beverages Industry Industry
- March 2021: Perrier launched Perrier Energize in Saudi Arabia, introducing a new category of organic, low-calorie carbonated energy beverages.
- February 2022: PepsiCo launched its hemp-based "Rockstar Energy" drink lineup in the Middle East, targeting a growing segment of health-conscious consumers.
- October 2022: iPRO launched a range of vitamin-rich sports drinks in Carrefour stores across the UAE, expanding its market reach and product portfolio.
Strategic Outlook for MEA Functional Beverages Industry Market
The MEA functional beverages market is poised for sustained growth, driven by factors such as increasing health consciousness, rising disposable incomes, and innovative product launches. Strategic opportunities exist for companies that can effectively leverage technological advancements, establish strong distribution networks, and cater to the evolving preferences of consumers. Focusing on sustainability and health-focused ingredients will be key to maintaining competitive advantage and securing long-term success within this dynamic market.
MEA Functional Beverages Industry Segmentation
-
1. Product Type
- 1.1. Energy Drinks
- 1.2. Fortified Juice
- 1.3. Sports Drinks
- 1.4. Dairy-based Drinks
- 1.5. Other Product Types
-
2. Distribution Channel
- 2.1. Supermarket/Hypermarket
- 2.2. Pharmacies and Health Stores
- 2.3. Convenience Stores
- 2.4. Online Retail Stores
- 2.5. Other Distribution Channels
-
3. Geography
- 3.1. South Africa
- 3.2. Saudi Arabia
- 3.3. Rest of Middle-East and Africa
MEA Functional Beverages Industry Segmentation By Geography
- 1. South Africa
- 2. Saudi Arabia
- 3. Rest of Middle East and Africa
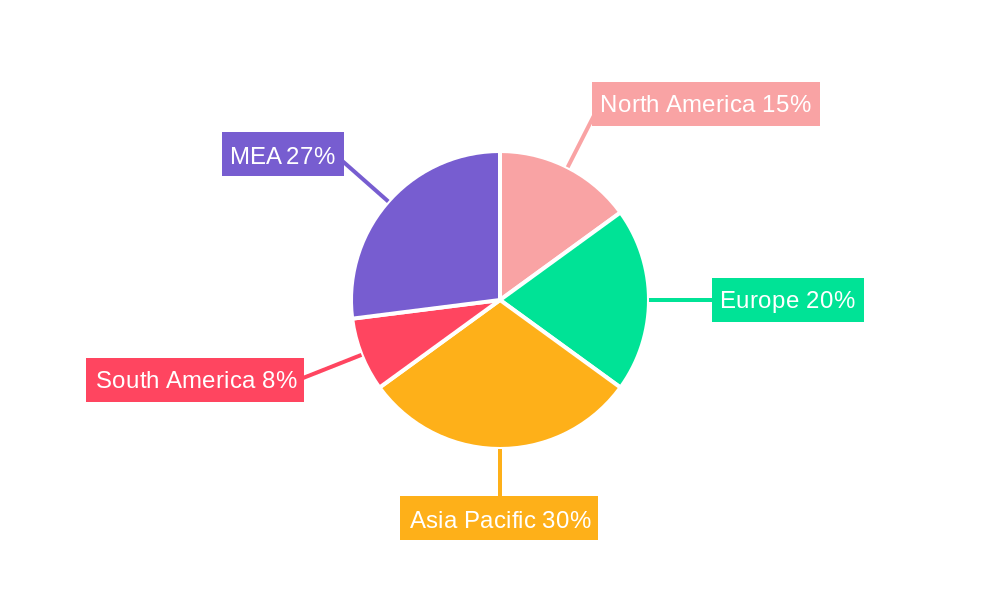
MEA Functional Beverages Industry Regional Market Share
Geographic Coverage of MEA Functional Beverages Industry
MEA Functional Beverages Industry REPORT HIGHLIGHTS
| Aspects | Details |
|---|---|
| Study Period | 2020-2034 |
| Base Year | 2025 |
| Estimated Year | 2026 |
| Forecast Period | 2026-2034 |
| Historical Period | 2020-2025 |
| Growth Rate | CAGR of 5.6% from 2020-2034 |
| Segmentation |
|
Table of Contents
- 1. Introduction
- 1.1. Research Scope
- 1.2. Market Segmentation
- 1.3. Research Objective
- 1.4. Definitions and Assumptions
- 2. Executive Summary
- 2.1. Market Snapshot
- 3. Market Dynamics
- 3.1. Market Drivers
- 3.2. Market Restrains
- 3.3. Market Trends
- 3.4. Market Opportunities
- 4. Market Factor Analysis
- 4.1. Porters Five Forces
- 4.1.1. Bargaining Power of Suppliers
- 4.1.2. Bargaining Power of Buyers
- 4.1.3. Threat of New Entrants
- 4.1.4. Threat of Substitutes
- 4.1.5. Competitive Rivalry
- 4.2. PESTEL analysis
- 4.3. BCG Analysis
- 4.3.1. Stars (High Growth, High Market Share)
- 4.3.2. Cash Cows (Low Growth, High Market Share)
- 4.3.3. Question Mark (High Growth, Low Market Share)
- 4.3.4. Dogs (Low Growth, Low Market Share)
- 4.4. Ansoff Matrix Analysis
- 4.5. Supply Chain Analysis
- 4.6. Regulatory Landscape
- 4.7. Current Market Potential and Opportunity Assessment (TAM–SAM–SOM Framework)
- 4.8. MSR Analyst Note
- 4.1. Porters Five Forces
- 5. Market Analysis, Insights and Forecast 2021-2033
- 5.1. Market Analysis, Insights and Forecast - by Product Type
- 5.1.1. Energy Drinks
- 5.1.2. Fortified Juice
- 5.1.3. Sports Drinks
- 5.1.4. Dairy-based Drinks
- 5.1.5. Other Product Types
- 5.2. Market Analysis, Insights and Forecast - by Distribution Channel
- 5.2.1. Supermarket/Hypermarket
- 5.2.2. Pharmacies and Health Stores
- 5.2.3. Convenience Stores
- 5.2.4. Online Retail Stores
- 5.2.5. Other Distribution Channels
- 5.3. Market Analysis, Insights and Forecast - by Geography
- 5.3.1. South Africa
- 5.3.2. Saudi Arabia
- 5.3.3. Rest of Middle-East and Africa
- 5.4. Market Analysis, Insights and Forecast - by Region
- 5.4.1. South Africa
- 5.4.2. Saudi Arabia
- 5.4.3. Rest of Middle East and Africa
- 5.1. Market Analysis, Insights and Forecast - by Product Type
- 6. Global MEA Functional Beverages Industry Analysis, Insights and Forecast, 2021-2033
- 6.1. Market Analysis, Insights and Forecast - by Product Type
- 6.1.1. Energy Drinks
- 6.1.2. Fortified Juice
- 6.1.3. Sports Drinks
- 6.1.4. Dairy-based Drinks
- 6.1.5. Other Product Types
- 6.2. Market Analysis, Insights and Forecast - by Distribution Channel
- 6.2.1. Supermarket/Hypermarket
- 6.2.2. Pharmacies and Health Stores
- 6.2.3. Convenience Stores
- 6.2.4. Online Retail Stores
- 6.2.5. Other Distribution Channels
- 6.3. Market Analysis, Insights and Forecast - by Geography
- 6.3.1. South Africa
- 6.3.2. Saudi Arabia
- 6.3.3. Rest of Middle-East and Africa
- 6.1. Market Analysis, Insights and Forecast - by Product Type
- 7. South Africa MEA Functional Beverages Industry Analysis, Insights and Forecast, 2020-2032
- 7.1. Market Analysis, Insights and Forecast - by Product Type
- 7.1.1. Energy Drinks
- 7.1.2. Fortified Juice
- 7.1.3. Sports Drinks
- 7.1.4. Dairy-based Drinks
- 7.1.5. Other Product Types
- 7.2. Market Analysis, Insights and Forecast - by Distribution Channel
- 7.2.1. Supermarket/Hypermarket
- 7.2.2. Pharmacies and Health Stores
- 7.2.3. Convenience Stores
- 7.2.4. Online Retail Stores
- 7.2.5. Other Distribution Channels
- 7.3. Market Analysis, Insights and Forecast - by Geography
- 7.3.1. South Africa
- 7.3.2. Saudi Arabia
- 7.3.3. Rest of Middle-East and Africa
- 7.1. Market Analysis, Insights and Forecast - by Product Type
- 8. Saudi Arabia MEA Functional Beverages Industry Analysis, Insights and Forecast, 2020-2032
- 8.1. Market Analysis, Insights and Forecast - by Product Type
- 8.1.1. Energy Drinks
- 8.1.2. Fortified Juice
- 8.1.3. Sports Drinks
- 8.1.4. Dairy-based Drinks
- 8.1.5. Other Product Types
- 8.2. Market Analysis, Insights and Forecast - by Distribution Channel
- 8.2.1. Supermarket/Hypermarket
- 8.2.2. Pharmacies and Health Stores
- 8.2.3. Convenience Stores
- 8.2.4. Online Retail Stores
- 8.2.5. Other Distribution Channels
- 8.3. Market Analysis, Insights and Forecast - by Geography
- 8.3.1. South Africa
- 8.3.2. Saudi Arabia
- 8.3.3. Rest of Middle-East and Africa
- 8.1. Market Analysis, Insights and Forecast - by Product Type
- 9. Rest of Middle East and Africa MEA Functional Beverages Industry Analysis, Insights and Forecast, 2020-2032
- 9.1. Market Analysis, Insights and Forecast - by Product Type
- 9.1.1. Energy Drinks
- 9.1.2. Fortified Juice
- 9.1.3. Sports Drinks
- 9.1.4. Dairy-based Drinks
- 9.1.5. Other Product Types
- 9.2. Market Analysis, Insights and Forecast - by Distribution Channel
- 9.2.1. Supermarket/Hypermarket
- 9.2.2. Pharmacies and Health Stores
- 9.2.3. Convenience Stores
- 9.2.4. Online Retail Stores
- 9.2.5. Other Distribution Channels
- 9.3. Market Analysis, Insights and Forecast - by Geography
- 9.3.1. South Africa
- 9.3.2. Saudi Arabia
- 9.3.3. Rest of Middle-East and Africa
- 9.1. Market Analysis, Insights and Forecast - by Product Type
- 10. Competitive Analysis
- 10.1. Company Profiles
- 10.1.1 Nestle SA
- 10.1.1.1. Company Overview
- 10.1.1.2. Products
- 10.1.1.3. Company Financials
- 10.1.1.4. SWOT Analysis
- 10.1.2 Herbalife International of America Inc
- 10.1.2.1. Company Overview
- 10.1.2.2. Products
- 10.1.2.3. Company Financials
- 10.1.2.4. SWOT Analysis
- 10.1.3 Sapporo Holdings
- 10.1.3.1. Company Overview
- 10.1.3.2. Products
- 10.1.3.3. Company Financials
- 10.1.3.4. SWOT Analysis
- 10.1.4 Mutalo Group
- 10.1.4.1. Company Overview
- 10.1.4.2. Products
- 10.1.4.3. Company Financials
- 10.1.4.4. SWOT Analysis
- 10.1.5 Monster Beverage Corporation
- 10.1.5.1. Company Overview
- 10.1.5.2. Products
- 10.1.5.3. Company Financials
- 10.1.5.4. SWOT Analysis
- 10.1.6 PepsiCo Inc
- 10.1.6.1. Company Overview
- 10.1.6.2. Products
- 10.1.6.3. Company Financials
- 10.1.6.4. SWOT Analysis
- 10.1.7 Dr Pepper Snapple
- 10.1.7.1. Company Overview
- 10.1.7.2. Products
- 10.1.7.3. Company Financials
- 10.1.7.4. SWOT Analysis
- 10.1.8 Viju Industries Nigeria Ltd
- 10.1.8.1. Company Overview
- 10.1.8.2. Products
- 10.1.8.3. Company Financials
- 10.1.8.4. SWOT Analysis
- 10.1.9 iPRO Sport Distribution Limited*List Not Exhaustive
- 10.1.9.1. Company Overview
- 10.1.9.2. Products
- 10.1.9.3. Company Financials
- 10.1.9.4. SWOT Analysis
- 10.1.10 Red Bull GmbH
- 10.1.10.1. Company Overview
- 10.1.10.2. Products
- 10.1.10.3. Company Financials
- 10.1.10.4. SWOT Analysis
- 10.1.11 The Coca-Cola Company
- 10.1.11.1. Company Overview
- 10.1.11.2. Products
- 10.1.11.3. Company Financials
- 10.1.11.4. SWOT Analysis
- 10.1.1 Nestle SA
- 10.2. Market Entropy
- 10.2.1 Company's Key Areas Served
- 10.2.2 Recent Developments
- 10.3. Company Market Share Analysis 2025
- 10.3.1 Top 5 Companies Market Share Analysis
- 10.3.2 Top 3 Companies Market Share Analysis
- 10.4. List of Potential Customers
- 11. Research Methodology
List of Figures
- Figure 1: Global MEA Functional Beverages Industry Revenue Breakdown (billion, %) by Region 2025 & 2033
- Figure 2: South Africa MEA Functional Beverages Industry Revenue (billion), by Product Type 2025 & 2033
- Figure 3: South Africa MEA Functional Beverages Industry Revenue Share (%), by Product Type 2025 & 2033
- Figure 4: South Africa MEA Functional Beverages Industry Revenue (billion), by Distribution Channel 2025 & 2033
- Figure 5: South Africa MEA Functional Beverages Industry Revenue Share (%), by Distribution Channel 2025 & 2033
- Figure 6: South Africa MEA Functional Beverages Industry Revenue (billion), by Geography 2025 & 2033
- Figure 7: South Africa MEA Functional Beverages Industry Revenue Share (%), by Geography 2025 & 2033
- Figure 8: South Africa MEA Functional Beverages Industry Revenue (billion), by Country 2025 & 2033
- Figure 9: South Africa MEA Functional Beverages Industry Revenue Share (%), by Country 2025 & 2033
- Figure 10: Saudi Arabia MEA Functional Beverages Industry Revenue (billion), by Product Type 2025 & 2033
- Figure 11: Saudi Arabia MEA Functional Beverages Industry Revenue Share (%), by Product Type 2025 & 2033
- Figure 12: Saudi Arabia MEA Functional Beverages Industry Revenue (billion), by Distribution Channel 2025 & 2033
- Figure 13: Saudi Arabia MEA Functional Beverages Industry Revenue Share (%), by Distribution Channel 2025 & 2033
- Figure 14: Saudi Arabia MEA Functional Beverages Industry Revenue (billion), by Geography 2025 & 2033
- Figure 15: Saudi Arabia MEA Functional Beverages Industry Revenue Share (%), by Geography 2025 & 2033
- Figure 16: Saudi Arabia MEA Functional Beverages Industry Revenue (billion), by Country 2025 & 2033
- Figure 17: Saudi Arabia MEA Functional Beverages Industry Revenue Share (%), by Country 2025 & 2033
- Figure 18: Rest of Middle East and Africa MEA Functional Beverages Industry Revenue (billion), by Product Type 2025 & 2033
- Figure 19: Rest of Middle East and Africa MEA Functional Beverages Industry Revenue Share (%), by Product Type 2025 & 2033
- Figure 20: Rest of Middle East and Africa MEA Functional Beverages Industry Revenue (billion), by Distribution Channel 2025 & 2033
- Figure 21: Rest of Middle East and Africa MEA Functional Beverages Industry Revenue Share (%), by Distribution Channel 2025 & 2033
- Figure 22: Rest of Middle East and Africa MEA Functional Beverages Industry Revenue (billion), by Geography 2025 & 2033
- Figure 23: Rest of Middle East and Africa MEA Functional Beverages Industry Revenue Share (%), by Geography 2025 & 2033
- Figure 24: Rest of Middle East and Africa MEA Functional Beverages Industry Revenue (billion), by Country 2025 & 2033
- Figure 25: Rest of Middle East and Africa MEA Functional Beverages Industry Revenue Share (%), by Country 2025 & 2033
List of Tables
- Table 1: Global MEA Functional Beverages Industry Revenue billion Forecast, by Product Type 2020 & 2033
- Table 2: Global MEA Functional Beverages Industry Revenue billion Forecast, by Distribution Channel 2020 & 2033
- Table 3: Global MEA Functional Beverages Industry Revenue billion Forecast, by Geography 2020 & 2033
- Table 4: Global MEA Functional Beverages Industry Revenue billion Forecast, by Region 2020 & 2033
- Table 5: Global MEA Functional Beverages Industry Revenue billion Forecast, by Product Type 2020 & 2033
- Table 6: Global MEA Functional Beverages Industry Revenue billion Forecast, by Distribution Channel 2020 & 2033
- Table 7: Global MEA Functional Beverages Industry Revenue billion Forecast, by Geography 2020 & 2033
- Table 8: Global MEA Functional Beverages Industry Revenue billion Forecast, by Country 2020 & 2033
- Table 9: Global MEA Functional Beverages Industry Revenue billion Forecast, by Product Type 2020 & 2033
- Table 10: Global MEA Functional Beverages Industry Revenue billion Forecast, by Distribution Channel 2020 & 2033
- Table 11: Global MEA Functional Beverages Industry Revenue billion Forecast, by Geography 2020 & 2033
- Table 12: Global MEA Functional Beverages Industry Revenue billion Forecast, by Country 2020 & 2033
- Table 13: Global MEA Functional Beverages Industry Revenue billion Forecast, by Product Type 2020 & 2033
- Table 14: Global MEA Functional Beverages Industry Revenue billion Forecast, by Distribution Channel 2020 & 2033
- Table 15: Global MEA Functional Beverages Industry Revenue billion Forecast, by Geography 2020 & 2033
- Table 16: Global MEA Functional Beverages Industry Revenue billion Forecast, by Country 2020 & 2033
Frequently Asked Questions
1. What is the projected Compound Annual Growth Rate (CAGR) of the MEA Functional Beverages Industry?
The projected CAGR is approximately 5.6%.
2. Which companies are prominent players in the MEA Functional Beverages Industry?
Key companies in the market include Nestle SA, Herbalife International of America Inc, Sapporo Holdings, Mutalo Group, Monster Beverage Corporation, PepsiCo Inc, Dr Pepper Snapple, Viju Industries Nigeria Ltd, iPRO Sport Distribution Limited*List Not Exhaustive, Red Bull GmbH, The Coca-Cola Company.
3. What are the main segments of the MEA Functional Beverages Industry?
The market segments include Product Type, Distribution Channel, Geography.
4. Can you provide details about the market size?
The market size is estimated to be USD 171.86 billion as of 2022.
5. What are some drivers contributing to market growth?
Preference for Plant-based and Clean-label RTD Products; Consumer Inclination Toward Sugar-Free Drinks.
6. What are the notable trends driving market growth?
Growing Demand for Plant-based and Lactose-free Products.
7. Are there any restraints impacting market growth?
Concerns Over Health Issues Associated With Beverages.
8. Can you provide examples of recent developments in the market?
October 2022: iPRO launched a range of sports drinks in Carrefour stores across the United Arab Emirates. The company claims that it contains 100% of the daily recommended vitamin C intake, along with added B vitamins.
9. What pricing options are available for accessing the report?
Pricing options include single-user, multi-user, and enterprise licenses priced at USD 4750, USD 5250, and USD 8750 respectively.
10. Is the market size provided in terms of value or volume?
The market size is provided in terms of value, measured in billion.
11. Are there any specific market keywords associated with the report?
Yes, the market keyword associated with the report is "MEA Functional Beverages Industry," which aids in identifying and referencing the specific market segment covered.
12. How do I determine which pricing option suits my needs best?
The pricing options vary based on user requirements and access needs. Individual users may opt for single-user licenses, while businesses requiring broader access may choose multi-user or enterprise licenses for cost-effective access to the report.
13. Are there any additional resources or data provided in the MEA Functional Beverages Industry report?
While the report offers comprehensive insights, it's advisable to review the specific contents or supplementary materials provided to ascertain if additional resources or data are available.
14. How can I stay updated on further developments or reports in the MEA Functional Beverages Industry?
To stay informed about further developments, trends, and reports in the MEA Functional Beverages Industry, consider subscribing to industry newsletters, following relevant companies and organizations, or regularly checking reputable industry news sources and publications.
Methodology
Step 1 - Identification of Relevant Samples Size from Population Database


Step 2 - Approaches for Defining Global Market Size (Value, Volume* & Price*)

Note*: In applicable scenarios
Step 3 - Data Sources
Primary Research
- Web Analytics
- Survey Reports
- Research Institute
- Latest Research Reports
- Opinion Leaders
Secondary Research
- Annual Reports
- White Paper
- Latest Press Release
- Industry Association
- Paid Database
- Investor Presentations

Step 4 - Data Triangulation
Involves using different sources of information in order to increase the validity of a study
These sources are likely to be stakeholders in a program - participants, other researchers, program staff, other community members, and so on.
Then we put all data in single framework & apply various statistical tools to find out the dynamic on the market.
During the analysis stage, feedback from the stakeholder groups would be compared to determine areas of agreement as well as areas of divergence