

Key Insights
The Thai snack bar industry is poised for robust growth, projected to reach 32.26 million in value by 2025, with a compelling Compound Annual Growth Rate (CAGR) of 5.26% expected throughout the forecast period of 2025-2033. This expansion is primarily fueled by escalating consumer demand for convenient, healthier snacking alternatives amidst busy lifestyles. The increasing awareness of nutritional benefits and the rise of active lifestyles are significant drivers, encouraging consumers to opt for snack bars as a source of energy and sustenance. Furthermore, product innovation, including a wider variety of flavors, functional ingredients, and plant-based options, is continuously attracting new consumer segments and encouraging repeat purchases. The market's growth trajectory is also supported by evolving distribution channels, with online retail stores playing an increasingly vital role in reaching a broader consumer base across Thailand.
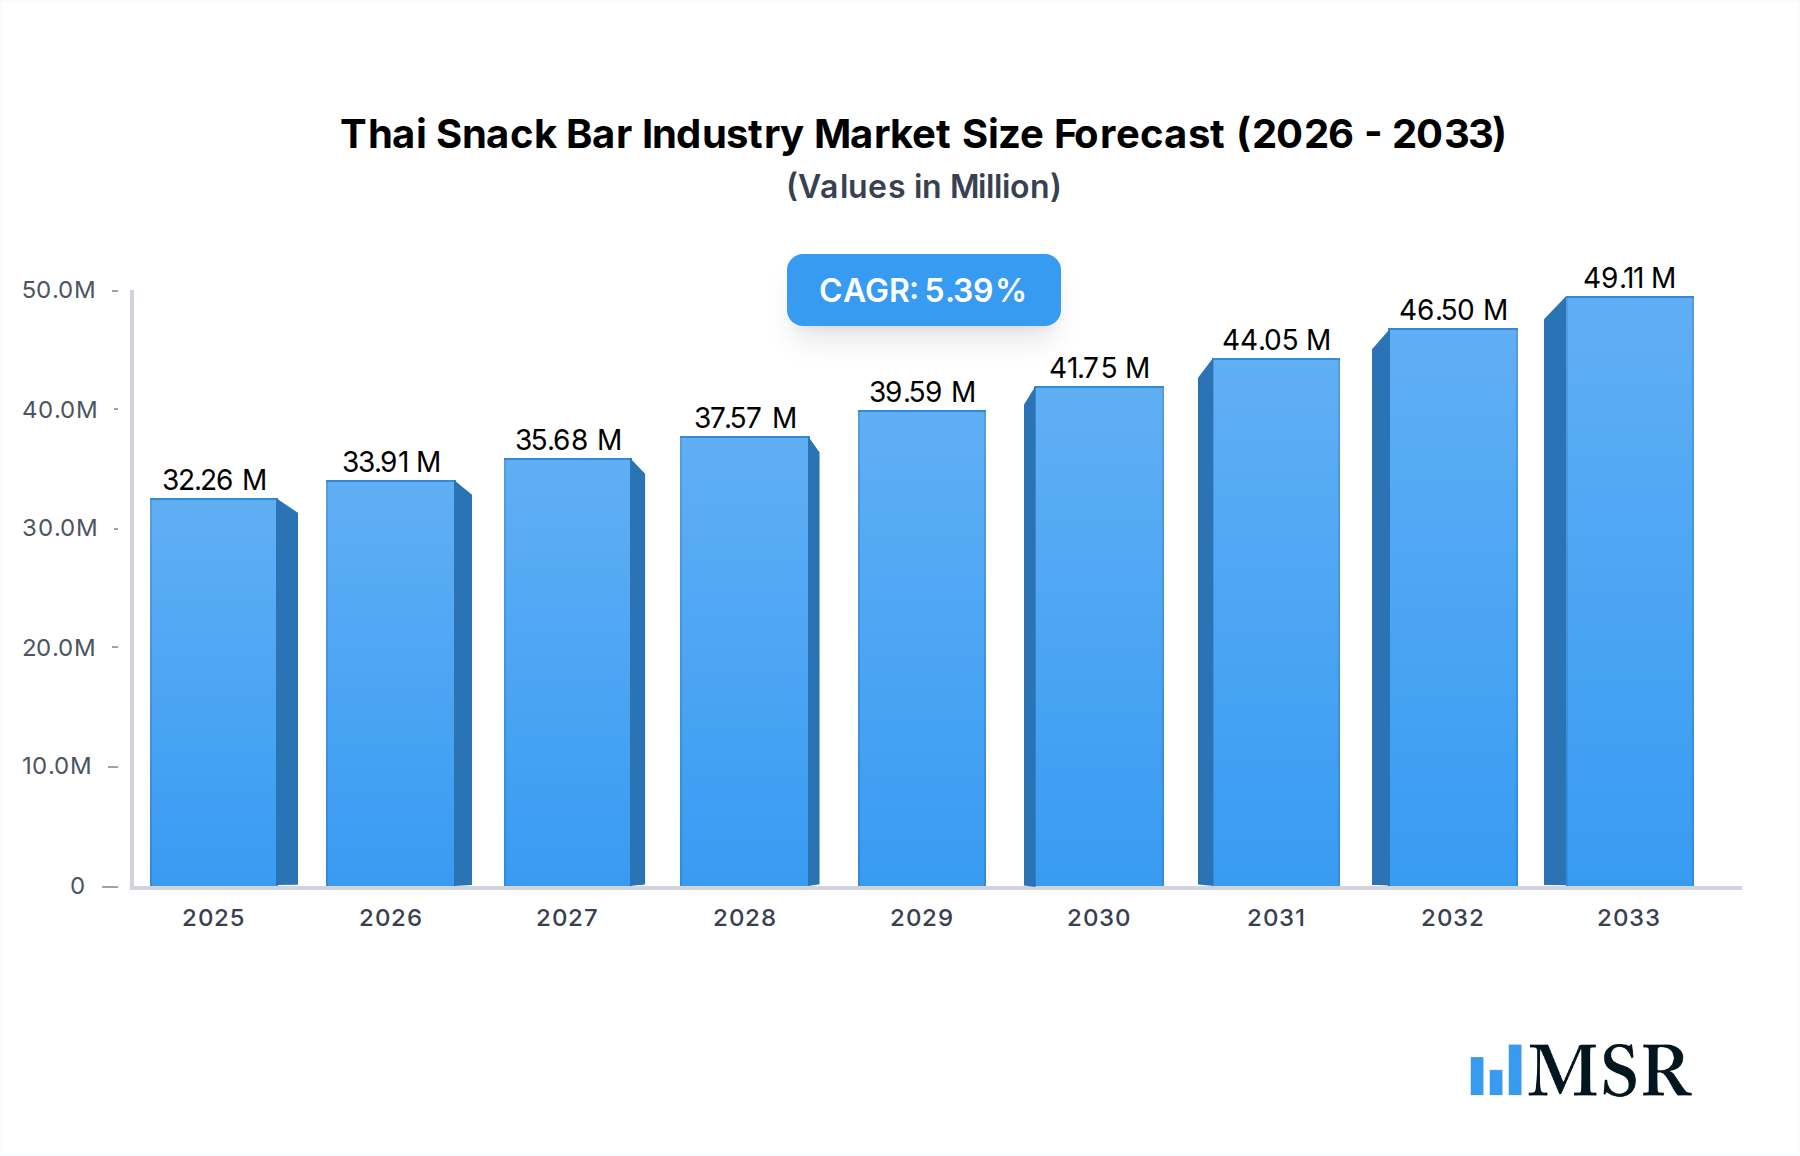
Thai Snack Bar Industry Market Size (In Million)
Key segments driving this market include Energy Bars and Other Snack Bars, reflecting the demand for functional benefits and on-the-go consumption. While Cereal Bars, encompassing Granola/Muesli Bars and Other Cereal Bars, also hold a significant share, the diversification within these categories is crucial. Major players like Nestle SA, Kellogg Co, and The Quaker Oats Company are strategically investing in product development and market penetration. The market, however, faces potential restraints such as intense competition, price sensitivity among certain consumer groups, and evolving regulatory landscapes concerning health claims. Despite these challenges, the overarching trend towards health-conscious snacking and the agility of manufacturers in adapting to consumer preferences suggest a bright future for the Thai snack bar market.

Thai Snack Bar Industry Company Market Share
Unlocking the Potential: Thai Snack Bar Industry Market Report 2025-2033
Dive deep into the dynamic Thai snack bar market with this comprehensive report. Covering the period from 2019 to 2033, with a base year of 2025, this analysis provides unparalleled insights into market concentration, evolving trends, key segments, product innovations, challenges, growth drivers, and strategic outlook. Essential for industry stakeholders seeking to capitalize on the surging demand for convenient and healthier snacking options in Thailand.
Thai Snack Bar Industry Market Concentration & Dynamics
The Thai snack bar industry, valued at an estimated XXX Million in the base year 2025, exhibits a moderately concentrated market. Key players like Nestle SA, Kellogg Co, and Associated British Foods PLC hold significant market share, but the landscape is increasingly influenced by emerging brands and niche manufacturers specializing in health-conscious and specific dietary needs, such as Nugo Nutrition and Anna Thai Snack All. Innovation ecosystems are thriving, driven by a growing consumer focus on ingredients, nutritional benefits, and unique flavor profiles. Regulatory frameworks, while evolving, are generally supportive of market entry and product development, though adherence to food safety and labeling standards remains paramount. The threat of substitute products, ranging from fresh fruits to traditional confectionery, is constant, pushing snack bar manufacturers to continuously differentiate through product quality and marketing. End-user trends lean heavily towards health and wellness, with demand for bars catering to specific dietary requirements like gluten-free, keto, and high-protein options on the rise. Merger and acquisition (M&A) activities, though not at a fever pitch, are anticipated to increase as larger corporations seek to expand their portfolios and smaller innovative companies aim for wider distribution and scale. Estimated M&A deal counts in the historical period (2019-2024) were approximately 3 Million, with projections for the forecast period (2025-2033) indicating a rise to 15 Million.
Thai Snack Bar Industry Industry Insights & Trends
The Thai snack bar industry is experiencing robust growth, projected to reach XXX Million by 2033, with a Compound Annual Growth Rate (CAGR) of XX% during the forecast period (2025–2033). This expansion is primarily fueled by several interconnected factors. Firstly, the increasing disposable income and urbanization in Thailand have led to a shift in consumer lifestyles, with a greater emphasis on convenience and on-the-go consumption. Snack bars perfectly align with this trend, offering a quick and portable nutritional solution. Secondly, a growing health and wellness consciousness among Thai consumers is a significant market growth driver. This has translated into a heightened demand for snack bars that are perceived as healthier alternatives to traditional snacks, featuring natural ingredients, lower sugar content, and added nutritional benefits like protein and fiber. Technological disruptions are playing a crucial role, with advancements in food processing and ingredient innovation enabling the development of more diverse and appealing products. This includes the introduction of bars with unique sweeteners, novel superfood ingredients, and improved textures and flavors. Evolving consumer behaviors are also central to the industry's trajectory. Consumers are becoming more discerning, actively seeking transparency in ingredient lists and demanding products that cater to specific dietary needs, such as low-carb, vegan, and allergen-free options. The rise of online retail channels has further amplified market reach and consumer access, allowing smaller brands to compete with established giants and catering to the demand for personalized snacking experiences. The market size in the base year 2025 is estimated at XXX Million.
Key Markets & Segments Leading Thai Snack Bar Industry
The Thai snack bar industry's dominance is increasingly being shaped by specific segments and distribution channels that cater to evolving consumer preferences. Within the Product Type segment, Cereal Bars, particularly Granola/Muesli Bars, are leading the charge. Their perceived health benefits, often associated with whole grains and natural ingredients, resonate strongly with health-conscious Thai consumers. While Energy Bars also hold a significant share, driven by demand from athletes and individuals seeking performance enhancement, and Other Snack Bars are carving out niches with innovative offerings, the foundational appeal of cereal bars remains paramount.
The Distribution Channel landscape is equally dynamic. Supermarkets/Hypermarkets continue to be a dominant force, offering wide product availability and accessibility to a broad consumer base. However, the rapid expansion of Online Retail Stores is a game-changer. This channel provides unparalleled convenience, personalized recommendations, and direct access to a growing number of niche and direct-to-consumer brands, significantly impacting market reach and sales volume. Convenience/Grocery Stores also play a vital role in capturing impulse purchases and serving consumers seeking immediate snack solutions.
Key drivers for the dominance of these segments include:
- Economic Growth & Rising Disposable Income: Fueling consumer spending on premium and convenience-oriented food products.
- Urbanization & Busy Lifestyles: Increasing demand for on-the-go snacking solutions.
- Health & Wellness Trend: Driving preference for bars perceived as nutritious and functional.
- E-commerce Penetration: Expanding accessibility and consumer choice through online platforms.
- Product Innovation: Continuous introduction of new flavors, ingredients, and dietary-specific options.
Thai Snack Bar Industry Product Developments
Product innovation remains a cornerstone of the Thai snack bar industry's competitiveness. Manufacturers are increasingly focusing on bars that offer enhanced nutritional profiles, catering to specific dietary needs and lifestyle trends. This includes the development of bars with reduced sugar content, incorporating natural sweeteners like allulose, as seen in General Mills' Good Measure brand. High-protein and keto-friendly options, such as Kellogg's Keto-friendly Snack Bars, are gaining traction, appealing to a segment of consumers seeking specific macronutrient benefits. Furthermore, the emphasis on simple, recognizable ingredients, as exemplified by RXBAR's product launches, resonates with consumers seeking transparency and natural goodness. These developments not only expand product portfolios but also create distinct competitive edges by addressing niche market demands and evolving health consciousness.
Challenges in the Thai Snack Bar Industry Market
Despite its growth trajectory, the Thai snack bar industry faces several challenges. Intense Competition from both established global brands and agile local players, including companies like Bright Food (Group) Co, Hershey (OhYeah! Nutrition), and The Quaker Oats Company, exerts significant pressure on pricing and market share. Fluctuations in Raw Material Costs for ingredients like nuts, grains, and cocoa can impact profit margins. Evolving Regulatory Landscapes regarding food labeling and health claims require constant vigilance and adaptation. Supply Chain Disruptions, as experienced globally, can affect production and distribution. The potential Threat of Substitutes from other convenient snack categories remains a perpetual concern, necessitating continuous product innovation and marketing efforts to retain consumer loyalty.
Forces Driving Thai Snack Bar Industry Growth
Several powerful forces are propelling the growth of the Thai snack bar industry. The burgeoning Health and Wellness Trend is paramount, with consumers actively seeking out nutritious and functional snack options. This is directly supported by Increasing Disposable Incomes and a growing middle class that can afford premium and convenience foods. Technological Advancements in food processing and ingredient development enable the creation of innovative and appealing products that cater to diverse dietary needs. The Expansion of Online Retail Channels has democratized market access, allowing a wider range of products to reach consumers and fostering greater brand discovery. Furthermore, Urbanization and Busy Lifestyles naturally drive the demand for convenient, on-the-go snacking solutions that snack bars readily provide.
Challenges in the Thai Snack Bar Industry Market
Long-term growth catalysts for the Thai snack bar industry lie in continued innovation and strategic market penetration. The continuous development of functional ingredients that offer demonstrable health benefits, such as enhanced gut health or sustained energy release, will be crucial. Strategic partnerships between snack bar manufacturers and fitness centers, health food stores, and corporate wellness programs can expand reach and credibility. Market expansions into underserved regions within Thailand and exploring export opportunities for Thai-made snack bars can unlock new revenue streams. Investing in sustainable sourcing and production practices will also resonate with an increasingly environmentally conscious consumer base, creating a competitive advantage.
Emerging Opportunities in Thai Snack Bar Industry
The Thai snack bar industry is ripe with emerging opportunities. The growing demand for plant-based and vegan snack bars presents a significant untapped market. Innovations in personalized nutrition, where bars are tailored to individual dietary needs and preferences through AI-driven recommendations, offer a future growth avenue. Exploring novel flavor profiles inspired by traditional Thai cuisine can create unique and appealing product offerings. Furthermore, the development of eco-friendly packaging solutions aligns with growing consumer environmental awareness. Partnerships with emerging e-commerce platforms and health and wellness influencers can drive brand awareness and sales among younger demographics.
Leading Players in the Thai Snack Bar Industry Sector
- Nestle SA
- Kellogg Co
- Bright Food (Group) Co
- Associated British Foods PLC
- Nugo Nutrition
- Hershey (OhYeah! Nutrition)
- The Quaker Oats Company
- Chicago Bar Company LLC
- General Mills
- Anna Thai Snack All
Key Milestones in Thai Snack Bar Industry Industry
- June 2021: General Mills Inc. introduced Good Measure, a new brand of snacks. Good Measure was launched with two products that include Creamy Nut Butter Bars and Crunchy Almond Crisps that are sweetened with allulose. The bars feature a blend of nuts, nut butter, seeds, and either dark chocolate or blueberries and come in blueberry almond, peanut dark chocolate, and almond dark chocolate varieties. The almond crisps come in sriracha and cheddar flavors. The snacks contain fewer than 5 grams of net carbs and 3 grams of sugar per serving.
- February 2021: Kellogg's launched Keto-friendly Snack Bars, which are available in two flavors, Chocolate Almond Fudge and Peanut Butter Fudge, with 1g of sugar and 2g of net carbs.
- July 2020: RXBAR launched two new flavors in Thailand and other parts of the world, Banana Chocolate Walnut and Peanut Butter & Berries. Made with simple ingredients, each bar is packed with 12 grams of protein and is gluten-free.
Strategic Outlook for Thai Snack Bar Industry Market
The strategic outlook for the Thai snack bar industry is overwhelmingly positive, characterized by sustained growth driven by evolving consumer demands for health, convenience, and taste. Future success will hinge on manufacturers' ability to innovate continuously, catering to niche dietary requirements and exploring novel ingredient combinations. A key growth accelerator will be the strategic leveraging of online retail channels to enhance market reach and personalize consumer engagement. Investing in sustainable practices and transparent sourcing will further bolster brand loyalty. The industry should also focus on developing functional snack bars that offer tangible health benefits beyond basic nutrition, such as those supporting cognitive function or immune health. Strategic partnerships and potential M&A activities will likely play a role in consolidating market share and driving synergistic growth.
Thai Snack Bar Industry Segmentation
-
1. Product Type
-
1.1. Cereal Bar
- 1.1.1. Granola/Muesli Bars
- 1.1.2. Other Cereal Bars
- 1.2. Energy Bar
- 1.3. Other Snack Bars
-
1.1. Cereal Bar
-
2. Distribution Channel
- 2.1. Supermarkets/Hypermarkets
- 2.2. Convenience/Grocery Stores
- 2.3. Online Retail Stores
- 2.4. Other Distribution Channels
Thai Snack Bar Industry Segmentation By Geography
-
1. North America
- 1.1. United States
- 1.2. Canada
- 1.3. Mexico
-
2. South America
- 2.1. Brazil
- 2.2. Argentina
- 2.3. Rest of South America
-
3. Europe
- 3.1. United Kingdom
- 3.2. Germany
- 3.3. France
- 3.4. Italy
- 3.5. Spain
- 3.6. Russia
- 3.7. Benelux
- 3.8. Nordics
- 3.9. Rest of Europe
-
4. Middle East & Africa
- 4.1. Turkey
- 4.2. Israel
- 4.3. GCC
- 4.4. North Africa
- 4.5. South Africa
- 4.6. Rest of Middle East & Africa
-
5. Asia Pacific
- 5.1. China
- 5.2. India
- 5.3. Japan
- 5.4. South Korea
- 5.5. ASEAN
- 5.6. Oceania
- 5.7. Rest of Asia Pacific
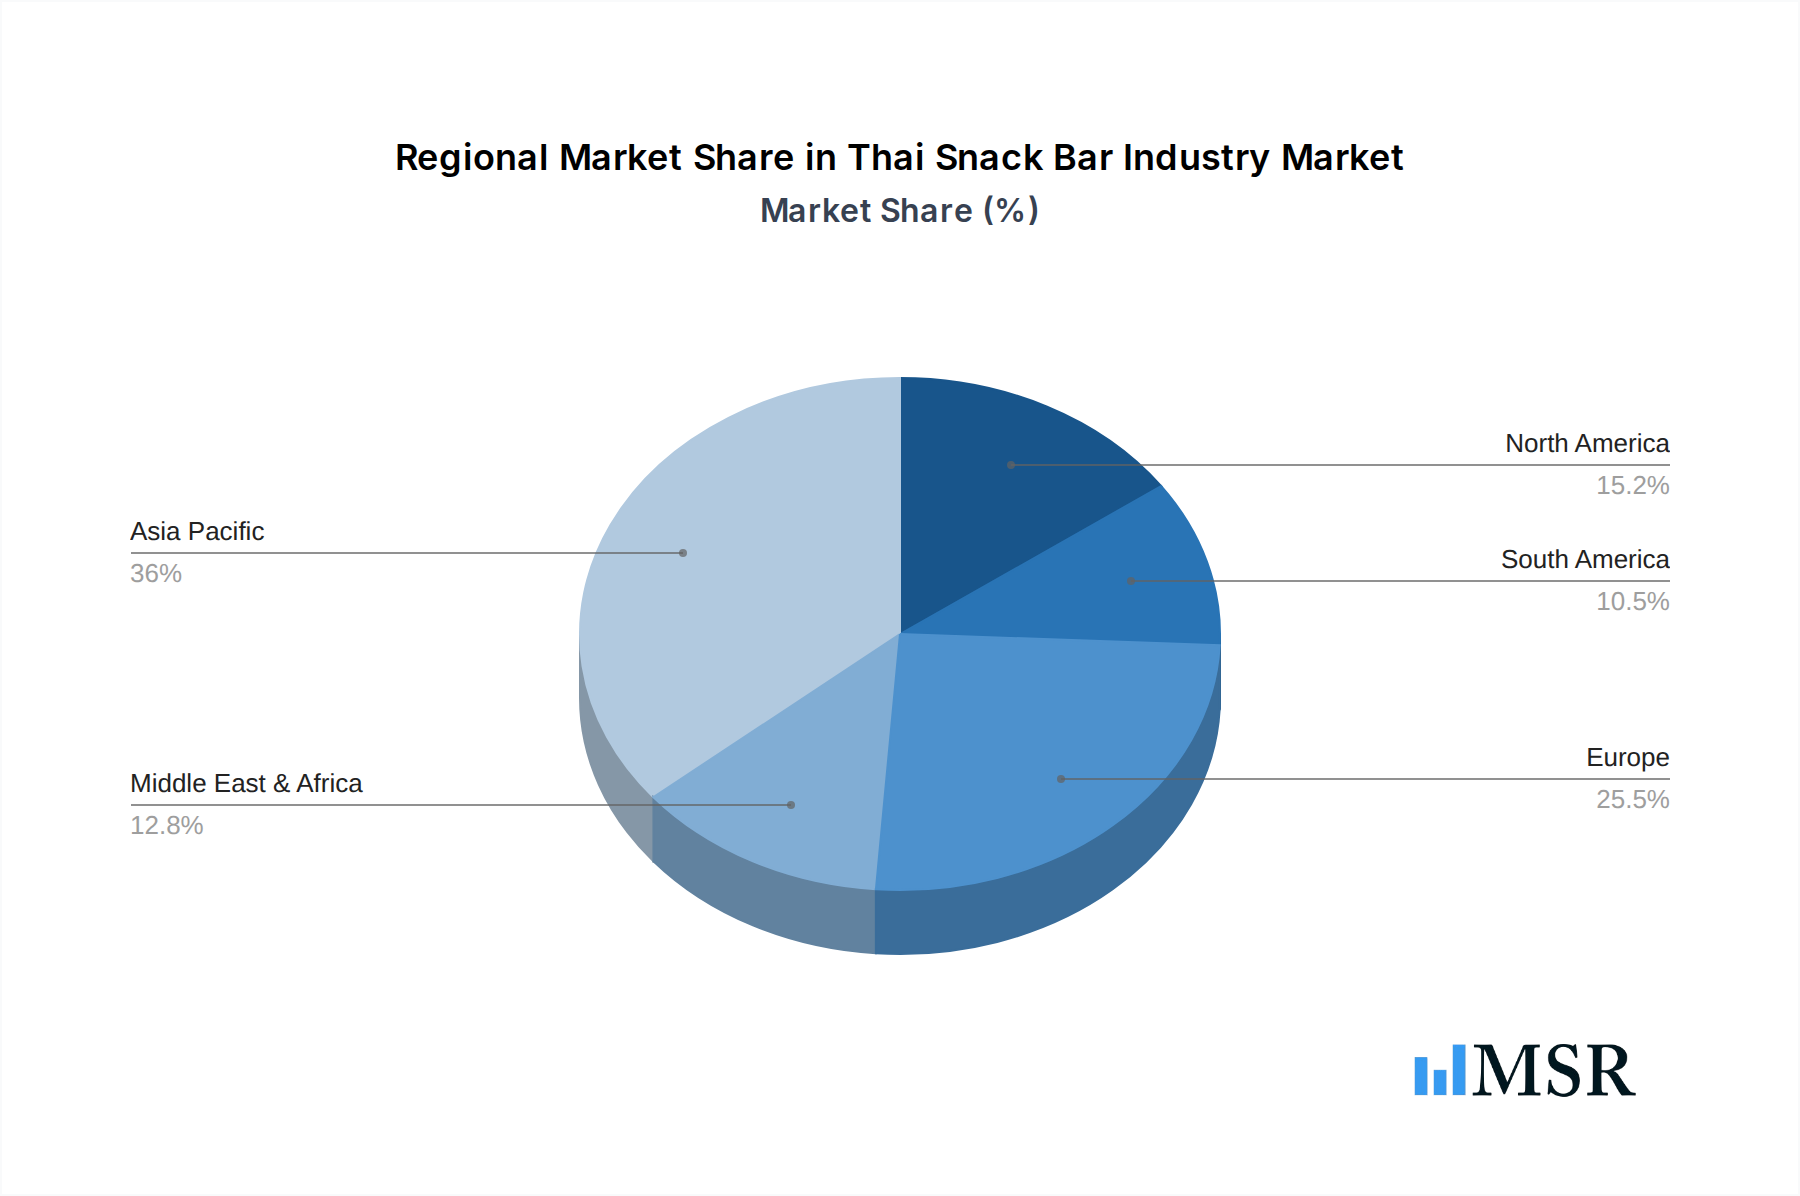
Thai Snack Bar Industry Regional Market Share
Geographic Coverage of Thai Snack Bar Industry
Thai Snack Bar Industry REPORT HIGHLIGHTS
| Aspects | Details |
|---|---|
| Study Period | 2020-2034 |
| Base Year | 2025 |
| Estimated Year | 2026 |
| Forecast Period | 2026-2034 |
| Historical Period | 2020-2025 |
| Growth Rate | CAGR of 5.26% from 2020-2034 |
| Segmentation |
|
Table of Contents
- 1. Introduction
- 1.1. Research Scope
- 1.2. Market Segmentation
- 1.3. Research Objective
- 1.4. Definitions and Assumptions
- 2. Executive Summary
- 2.1. Market Snapshot
- 3. Market Dynamics
- 3.1. Market Drivers
- 3.2. Market Restrains
- 3.3. Market Trends
- 3.4. Market Opportunities
- 4. Market Factor Analysis
- 4.1. Porters Five Forces
- 4.1.1. Bargaining Power of Suppliers
- 4.1.2. Bargaining Power of Buyers
- 4.1.3. Threat of New Entrants
- 4.1.4. Threat of Substitutes
- 4.1.5. Competitive Rivalry
- 4.2. PESTEL analysis
- 4.3. BCG Analysis
- 4.3.1. Stars (High Growth, High Market Share)
- 4.3.2. Cash Cows (Low Growth, High Market Share)
- 4.3.3. Question Mark (High Growth, Low Market Share)
- 4.3.4. Dogs (Low Growth, Low Market Share)
- 4.4. Ansoff Matrix Analysis
- 4.5. Supply Chain Analysis
- 4.6. Regulatory Landscape
- 4.7. Current Market Potential and Opportunity Assessment (TAM–SAM–SOM Framework)
- 4.8. MSR Analyst Note
- 4.1. Porters Five Forces
- 5. Market Analysis, Insights and Forecast 2021-2033
- 5.1. Market Analysis, Insights and Forecast - by Product Type
- 5.1.1. Cereal Bar
- 5.1.1.1. Granola/Muesli Bars
- 5.1.1.2. Other Cereal Bars
- 5.1.2. Energy Bar
- 5.1.3. Other Snack Bars
- 5.1.1. Cereal Bar
- 5.2. Market Analysis, Insights and Forecast - by Distribution Channel
- 5.2.1. Supermarkets/Hypermarkets
- 5.2.2. Convenience/Grocery Stores
- 5.2.3. Online Retail Stores
- 5.2.4. Other Distribution Channels
- 5.3. Market Analysis, Insights and Forecast - by Region
- 5.3.1. North America
- 5.3.2. South America
- 5.3.3. Europe
- 5.3.4. Middle East & Africa
- 5.3.5. Asia Pacific
- 5.1. Market Analysis, Insights and Forecast - by Product Type
- 6. Global Thai Snack Bar Industry Analysis, Insights and Forecast, 2021-2033
- 6.1. Market Analysis, Insights and Forecast - by Product Type
- 6.1.1. Cereal Bar
- 6.1.1.1. Granola/Muesli Bars
- 6.1.1.2. Other Cereal Bars
- 6.1.2. Energy Bar
- 6.1.3. Other Snack Bars
- 6.1.1. Cereal Bar
- 6.2. Market Analysis, Insights and Forecast - by Distribution Channel
- 6.2.1. Supermarkets/Hypermarkets
- 6.2.2. Convenience/Grocery Stores
- 6.2.3. Online Retail Stores
- 6.2.4. Other Distribution Channels
- 6.1. Market Analysis, Insights and Forecast - by Product Type
- 7. North America Thai Snack Bar Industry Analysis, Insights and Forecast, 2020-2032
- 7.1. Market Analysis, Insights and Forecast - by Product Type
- 7.1.1. Cereal Bar
- 7.1.1.1. Granola/Muesli Bars
- 7.1.1.2. Other Cereal Bars
- 7.1.2. Energy Bar
- 7.1.3. Other Snack Bars
- 7.1.1. Cereal Bar
- 7.2. Market Analysis, Insights and Forecast - by Distribution Channel
- 7.2.1. Supermarkets/Hypermarkets
- 7.2.2. Convenience/Grocery Stores
- 7.2.3. Online Retail Stores
- 7.2.4. Other Distribution Channels
- 7.1. Market Analysis, Insights and Forecast - by Product Type
- 8. South America Thai Snack Bar Industry Analysis, Insights and Forecast, 2020-2032
- 8.1. Market Analysis, Insights and Forecast - by Product Type
- 8.1.1. Cereal Bar
- 8.1.1.1. Granola/Muesli Bars
- 8.1.1.2. Other Cereal Bars
- 8.1.2. Energy Bar
- 8.1.3. Other Snack Bars
- 8.1.1. Cereal Bar
- 8.2. Market Analysis, Insights and Forecast - by Distribution Channel
- 8.2.1. Supermarkets/Hypermarkets
- 8.2.2. Convenience/Grocery Stores
- 8.2.3. Online Retail Stores
- 8.2.4. Other Distribution Channels
- 8.1. Market Analysis, Insights and Forecast - by Product Type
- 9. Europe Thai Snack Bar Industry Analysis, Insights and Forecast, 2020-2032
- 9.1. Market Analysis, Insights and Forecast - by Product Type
- 9.1.1. Cereal Bar
- 9.1.1.1. Granola/Muesli Bars
- 9.1.1.2. Other Cereal Bars
- 9.1.2. Energy Bar
- 9.1.3. Other Snack Bars
- 9.1.1. Cereal Bar
- 9.2. Market Analysis, Insights and Forecast - by Distribution Channel
- 9.2.1. Supermarkets/Hypermarkets
- 9.2.2. Convenience/Grocery Stores
- 9.2.3. Online Retail Stores
- 9.2.4. Other Distribution Channels
- 9.1. Market Analysis, Insights and Forecast - by Product Type
- 10. Middle East & Africa Thai Snack Bar Industry Analysis, Insights and Forecast, 2020-2032
- 10.1. Market Analysis, Insights and Forecast - by Product Type
- 10.1.1. Cereal Bar
- 10.1.1.1. Granola/Muesli Bars
- 10.1.1.2. Other Cereal Bars
- 10.1.2. Energy Bar
- 10.1.3. Other Snack Bars
- 10.1.1. Cereal Bar
- 10.2. Market Analysis, Insights and Forecast - by Distribution Channel
- 10.2.1. Supermarkets/Hypermarkets
- 10.2.2. Convenience/Grocery Stores
- 10.2.3. Online Retail Stores
- 10.2.4. Other Distribution Channels
- 10.1. Market Analysis, Insights and Forecast - by Product Type
- 11. Asia Pacific Thai Snack Bar Industry Analysis, Insights and Forecast, 2020-2032
- 11.1. Market Analysis, Insights and Forecast - by Product Type
- 11.1.1. Cereal Bar
- 11.1.1.1. Granola/Muesli Bars
- 11.1.1.2. Other Cereal Bars
- 11.1.2. Energy Bar
- 11.1.3. Other Snack Bars
- 11.1.1. Cereal Bar
- 11.2. Market Analysis, Insights and Forecast - by Distribution Channel
- 11.2.1. Supermarkets/Hypermarkets
- 11.2.2. Convenience/Grocery Stores
- 11.2.3. Online Retail Stores
- 11.2.4. Other Distribution Channels
- 11.1. Market Analysis, Insights and Forecast - by Product Type
- 12. Competitive Analysis
- 12.1. Company Profiles
- 12.1.1 Bright Food (Group) Co
- 12.1.1.1. Company Overview
- 12.1.1.2. Products
- 12.1.1.3. Company Financials
- 12.1.1.4. SWOT Analysis
- 12.1.2 Nestle SA
- 12.1.2.1. Company Overview
- 12.1.2.2. Products
- 12.1.2.3. Company Financials
- 12.1.2.4. SWOT Analysis
- 12.1.3 Nugo Nutrition
- 12.1.3.1. Company Overview
- 12.1.3.2. Products
- 12.1.3.3. Company Financials
- 12.1.3.4. SWOT Analysis
- 12.1.4 Anna Thai Snack All
- 12.1.4.1. Company Overview
- 12.1.4.2. Products
- 12.1.4.3. Company Financials
- 12.1.4.4. SWOT Analysis
- 12.1.5 Kellogg Co
- 12.1.5.1. Company Overview
- 12.1.5.2. Products
- 12.1.5.3. Company Financials
- 12.1.5.4. SWOT Analysis
- 12.1.6 Hershey (OhYeah! Nutrition)
- 12.1.6.1. Company Overview
- 12.1.6.2. Products
- 12.1.6.3. Company Financials
- 12.1.6.4. SWOT Analysis
- 12.1.7 The Quaker Oats Company
- 12.1.7.1. Company Overview
- 12.1.7.2. Products
- 12.1.7.3. Company Financials
- 12.1.7.4. SWOT Analysis
- 12.1.8 Associated British Foods PLC
- 12.1.8.1. Company Overview
- 12.1.8.2. Products
- 12.1.8.3. Company Financials
- 12.1.8.4. SWOT Analysis
- 12.1.9 Chicago Bar Company LLC
- 12.1.9.1. Company Overview
- 12.1.9.2. Products
- 12.1.9.3. Company Financials
- 12.1.9.4. SWOT Analysis
- 12.1.10 General Mills*List Not Exhaustive
- 12.1.10.1. Company Overview
- 12.1.10.2. Products
- 12.1.10.3. Company Financials
- 12.1.10.4. SWOT Analysis
- 12.1.1 Bright Food (Group) Co
- 12.2. Market Entropy
- 12.2.1 Company's Key Areas Served
- 12.2.2 Recent Developments
- 12.3. Company Market Share Analysis 2025
- 12.3.1 Top 5 Companies Market Share Analysis
- 12.3.2 Top 3 Companies Market Share Analysis
- 12.4. List of Potential Customers
- 13. Research Methodology
List of Figures
- Figure 1: Global Thai Snack Bar Industry Revenue Breakdown (Million, %) by Region 2025 & 2033
- Figure 2: Global Thai Snack Bar Industry Volume Breakdown (k Tons, %) by Region 2025 & 2033
- Figure 3: North America Thai Snack Bar Industry Revenue (Million), by Product Type 2025 & 2033
- Figure 4: North America Thai Snack Bar Industry Volume (k Tons), by Product Type 2025 & 2033
- Figure 5: North America Thai Snack Bar Industry Revenue Share (%), by Product Type 2025 & 2033
- Figure 6: North America Thai Snack Bar Industry Volume Share (%), by Product Type 2025 & 2033
- Figure 7: North America Thai Snack Bar Industry Revenue (Million), by Distribution Channel 2025 & 2033
- Figure 8: North America Thai Snack Bar Industry Volume (k Tons), by Distribution Channel 2025 & 2033
- Figure 9: North America Thai Snack Bar Industry Revenue Share (%), by Distribution Channel 2025 & 2033
- Figure 10: North America Thai Snack Bar Industry Volume Share (%), by Distribution Channel 2025 & 2033
- Figure 11: North America Thai Snack Bar Industry Revenue (Million), by Country 2025 & 2033
- Figure 12: North America Thai Snack Bar Industry Volume (k Tons), by Country 2025 & 2033
- Figure 13: North America Thai Snack Bar Industry Revenue Share (%), by Country 2025 & 2033
- Figure 14: North America Thai Snack Bar Industry Volume Share (%), by Country 2025 & 2033
- Figure 15: South America Thai Snack Bar Industry Revenue (Million), by Product Type 2025 & 2033
- Figure 16: South America Thai Snack Bar Industry Volume (k Tons), by Product Type 2025 & 2033
- Figure 17: South America Thai Snack Bar Industry Revenue Share (%), by Product Type 2025 & 2033
- Figure 18: South America Thai Snack Bar Industry Volume Share (%), by Product Type 2025 & 2033
- Figure 19: South America Thai Snack Bar Industry Revenue (Million), by Distribution Channel 2025 & 2033
- Figure 20: South America Thai Snack Bar Industry Volume (k Tons), by Distribution Channel 2025 & 2033
- Figure 21: South America Thai Snack Bar Industry Revenue Share (%), by Distribution Channel 2025 & 2033
- Figure 22: South America Thai Snack Bar Industry Volume Share (%), by Distribution Channel 2025 & 2033
- Figure 23: South America Thai Snack Bar Industry Revenue (Million), by Country 2025 & 2033
- Figure 24: South America Thai Snack Bar Industry Volume (k Tons), by Country 2025 & 2033
- Figure 25: South America Thai Snack Bar Industry Revenue Share (%), by Country 2025 & 2033
- Figure 26: South America Thai Snack Bar Industry Volume Share (%), by Country 2025 & 2033
- Figure 27: Europe Thai Snack Bar Industry Revenue (Million), by Product Type 2025 & 2033
- Figure 28: Europe Thai Snack Bar Industry Volume (k Tons), by Product Type 2025 & 2033
- Figure 29: Europe Thai Snack Bar Industry Revenue Share (%), by Product Type 2025 & 2033
- Figure 30: Europe Thai Snack Bar Industry Volume Share (%), by Product Type 2025 & 2033
- Figure 31: Europe Thai Snack Bar Industry Revenue (Million), by Distribution Channel 2025 & 2033
- Figure 32: Europe Thai Snack Bar Industry Volume (k Tons), by Distribution Channel 2025 & 2033
- Figure 33: Europe Thai Snack Bar Industry Revenue Share (%), by Distribution Channel 2025 & 2033
- Figure 34: Europe Thai Snack Bar Industry Volume Share (%), by Distribution Channel 2025 & 2033
- Figure 35: Europe Thai Snack Bar Industry Revenue (Million), by Country 2025 & 2033
- Figure 36: Europe Thai Snack Bar Industry Volume (k Tons), by Country 2025 & 2033
- Figure 37: Europe Thai Snack Bar Industry Revenue Share (%), by Country 2025 & 2033
- Figure 38: Europe Thai Snack Bar Industry Volume Share (%), by Country 2025 & 2033
- Figure 39: Middle East & Africa Thai Snack Bar Industry Revenue (Million), by Product Type 2025 & 2033
- Figure 40: Middle East & Africa Thai Snack Bar Industry Volume (k Tons), by Product Type 2025 & 2033
- Figure 41: Middle East & Africa Thai Snack Bar Industry Revenue Share (%), by Product Type 2025 & 2033
- Figure 42: Middle East & Africa Thai Snack Bar Industry Volume Share (%), by Product Type 2025 & 2033
- Figure 43: Middle East & Africa Thai Snack Bar Industry Revenue (Million), by Distribution Channel 2025 & 2033
- Figure 44: Middle East & Africa Thai Snack Bar Industry Volume (k Tons), by Distribution Channel 2025 & 2033
- Figure 45: Middle East & Africa Thai Snack Bar Industry Revenue Share (%), by Distribution Channel 2025 & 2033
- Figure 46: Middle East & Africa Thai Snack Bar Industry Volume Share (%), by Distribution Channel 2025 & 2033
- Figure 47: Middle East & Africa Thai Snack Bar Industry Revenue (Million), by Country 2025 & 2033
- Figure 48: Middle East & Africa Thai Snack Bar Industry Volume (k Tons), by Country 2025 & 2033
- Figure 49: Middle East & Africa Thai Snack Bar Industry Revenue Share (%), by Country 2025 & 2033
- Figure 50: Middle East & Africa Thai Snack Bar Industry Volume Share (%), by Country 2025 & 2033
- Figure 51: Asia Pacific Thai Snack Bar Industry Revenue (Million), by Product Type 2025 & 2033
- Figure 52: Asia Pacific Thai Snack Bar Industry Volume (k Tons), by Product Type 2025 & 2033
- Figure 53: Asia Pacific Thai Snack Bar Industry Revenue Share (%), by Product Type 2025 & 2033
- Figure 54: Asia Pacific Thai Snack Bar Industry Volume Share (%), by Product Type 2025 & 2033
- Figure 55: Asia Pacific Thai Snack Bar Industry Revenue (Million), by Distribution Channel 2025 & 2033
- Figure 56: Asia Pacific Thai Snack Bar Industry Volume (k Tons), by Distribution Channel 2025 & 2033
- Figure 57: Asia Pacific Thai Snack Bar Industry Revenue Share (%), by Distribution Channel 2025 & 2033
- Figure 58: Asia Pacific Thai Snack Bar Industry Volume Share (%), by Distribution Channel 2025 & 2033
- Figure 59: Asia Pacific Thai Snack Bar Industry Revenue (Million), by Country 2025 & 2033
- Figure 60: Asia Pacific Thai Snack Bar Industry Volume (k Tons), by Country 2025 & 2033
- Figure 61: Asia Pacific Thai Snack Bar Industry Revenue Share (%), by Country 2025 & 2033
- Figure 62: Asia Pacific Thai Snack Bar Industry Volume Share (%), by Country 2025 & 2033
List of Tables
- Table 1: Global Thai Snack Bar Industry Revenue Million Forecast, by Product Type 2020 & 2033
- Table 2: Global Thai Snack Bar Industry Volume k Tons Forecast, by Product Type 2020 & 2033
- Table 3: Global Thai Snack Bar Industry Revenue Million Forecast, by Distribution Channel 2020 & 2033
- Table 4: Global Thai Snack Bar Industry Volume k Tons Forecast, by Distribution Channel 2020 & 2033
- Table 5: Global Thai Snack Bar Industry Revenue Million Forecast, by Region 2020 & 2033
- Table 6: Global Thai Snack Bar Industry Volume k Tons Forecast, by Region 2020 & 2033
- Table 7: Global Thai Snack Bar Industry Revenue Million Forecast, by Product Type 2020 & 2033
- Table 8: Global Thai Snack Bar Industry Volume k Tons Forecast, by Product Type 2020 & 2033
- Table 9: Global Thai Snack Bar Industry Revenue Million Forecast, by Distribution Channel 2020 & 2033
- Table 10: Global Thai Snack Bar Industry Volume k Tons Forecast, by Distribution Channel 2020 & 2033
- Table 11: Global Thai Snack Bar Industry Revenue Million Forecast, by Country 2020 & 2033
- Table 12: Global Thai Snack Bar Industry Volume k Tons Forecast, by Country 2020 & 2033
- Table 13: United States Thai Snack Bar Industry Revenue (Million) Forecast, by Application 2020 & 2033
- Table 14: United States Thai Snack Bar Industry Volume (k Tons) Forecast, by Application 2020 & 2033
- Table 15: Canada Thai Snack Bar Industry Revenue (Million) Forecast, by Application 2020 & 2033
- Table 16: Canada Thai Snack Bar Industry Volume (k Tons) Forecast, by Application 2020 & 2033
- Table 17: Mexico Thai Snack Bar Industry Revenue (Million) Forecast, by Application 2020 & 2033
- Table 18: Mexico Thai Snack Bar Industry Volume (k Tons) Forecast, by Application 2020 & 2033
- Table 19: Global Thai Snack Bar Industry Revenue Million Forecast, by Product Type 2020 & 2033
- Table 20: Global Thai Snack Bar Industry Volume k Tons Forecast, by Product Type 2020 & 2033
- Table 21: Global Thai Snack Bar Industry Revenue Million Forecast, by Distribution Channel 2020 & 2033
- Table 22: Global Thai Snack Bar Industry Volume k Tons Forecast, by Distribution Channel 2020 & 2033
- Table 23: Global Thai Snack Bar Industry Revenue Million Forecast, by Country 2020 & 2033
- Table 24: Global Thai Snack Bar Industry Volume k Tons Forecast, by Country 2020 & 2033
- Table 25: Brazil Thai Snack Bar Industry Revenue (Million) Forecast, by Application 2020 & 2033
- Table 26: Brazil Thai Snack Bar Industry Volume (k Tons) Forecast, by Application 2020 & 2033
- Table 27: Argentina Thai Snack Bar Industry Revenue (Million) Forecast, by Application 2020 & 2033
- Table 28: Argentina Thai Snack Bar Industry Volume (k Tons) Forecast, by Application 2020 & 2033
- Table 29: Rest of South America Thai Snack Bar Industry Revenue (Million) Forecast, by Application 2020 & 2033
- Table 30: Rest of South America Thai Snack Bar Industry Volume (k Tons) Forecast, by Application 2020 & 2033
- Table 31: Global Thai Snack Bar Industry Revenue Million Forecast, by Product Type 2020 & 2033
- Table 32: Global Thai Snack Bar Industry Volume k Tons Forecast, by Product Type 2020 & 2033
- Table 33: Global Thai Snack Bar Industry Revenue Million Forecast, by Distribution Channel 2020 & 2033
- Table 34: Global Thai Snack Bar Industry Volume k Tons Forecast, by Distribution Channel 2020 & 2033
- Table 35: Global Thai Snack Bar Industry Revenue Million Forecast, by Country 2020 & 2033
- Table 36: Global Thai Snack Bar Industry Volume k Tons Forecast, by Country 2020 & 2033
- Table 37: United Kingdom Thai Snack Bar Industry Revenue (Million) Forecast, by Application 2020 & 2033
- Table 38: United Kingdom Thai Snack Bar Industry Volume (k Tons) Forecast, by Application 2020 & 2033
- Table 39: Germany Thai Snack Bar Industry Revenue (Million) Forecast, by Application 2020 & 2033
- Table 40: Germany Thai Snack Bar Industry Volume (k Tons) Forecast, by Application 2020 & 2033
- Table 41: France Thai Snack Bar Industry Revenue (Million) Forecast, by Application 2020 & 2033
- Table 42: France Thai Snack Bar Industry Volume (k Tons) Forecast, by Application 2020 & 2033
- Table 43: Italy Thai Snack Bar Industry Revenue (Million) Forecast, by Application 2020 & 2033
- Table 44: Italy Thai Snack Bar Industry Volume (k Tons) Forecast, by Application 2020 & 2033
- Table 45: Spain Thai Snack Bar Industry Revenue (Million) Forecast, by Application 2020 & 2033
- Table 46: Spain Thai Snack Bar Industry Volume (k Tons) Forecast, by Application 2020 & 2033
- Table 47: Russia Thai Snack Bar Industry Revenue (Million) Forecast, by Application 2020 & 2033
- Table 48: Russia Thai Snack Bar Industry Volume (k Tons) Forecast, by Application 2020 & 2033
- Table 49: Benelux Thai Snack Bar Industry Revenue (Million) Forecast, by Application 2020 & 2033
- Table 50: Benelux Thai Snack Bar Industry Volume (k Tons) Forecast, by Application 2020 & 2033
- Table 51: Nordics Thai Snack Bar Industry Revenue (Million) Forecast, by Application 2020 & 2033
- Table 52: Nordics Thai Snack Bar Industry Volume (k Tons) Forecast, by Application 2020 & 2033
- Table 53: Rest of Europe Thai Snack Bar Industry Revenue (Million) Forecast, by Application 2020 & 2033
- Table 54: Rest of Europe Thai Snack Bar Industry Volume (k Tons) Forecast, by Application 2020 & 2033
- Table 55: Global Thai Snack Bar Industry Revenue Million Forecast, by Product Type 2020 & 2033
- Table 56: Global Thai Snack Bar Industry Volume k Tons Forecast, by Product Type 2020 & 2033
- Table 57: Global Thai Snack Bar Industry Revenue Million Forecast, by Distribution Channel 2020 & 2033
- Table 58: Global Thai Snack Bar Industry Volume k Tons Forecast, by Distribution Channel 2020 & 2033
- Table 59: Global Thai Snack Bar Industry Revenue Million Forecast, by Country 2020 & 2033
- Table 60: Global Thai Snack Bar Industry Volume k Tons Forecast, by Country 2020 & 2033
- Table 61: Turkey Thai Snack Bar Industry Revenue (Million) Forecast, by Application 2020 & 2033
- Table 62: Turkey Thai Snack Bar Industry Volume (k Tons) Forecast, by Application 2020 & 2033
- Table 63: Israel Thai Snack Bar Industry Revenue (Million) Forecast, by Application 2020 & 2033
- Table 64: Israel Thai Snack Bar Industry Volume (k Tons) Forecast, by Application 2020 & 2033
- Table 65: GCC Thai Snack Bar Industry Revenue (Million) Forecast, by Application 2020 & 2033
- Table 66: GCC Thai Snack Bar Industry Volume (k Tons) Forecast, by Application 2020 & 2033
- Table 67: North Africa Thai Snack Bar Industry Revenue (Million) Forecast, by Application 2020 & 2033
- Table 68: North Africa Thai Snack Bar Industry Volume (k Tons) Forecast, by Application 2020 & 2033
- Table 69: South Africa Thai Snack Bar Industry Revenue (Million) Forecast, by Application 2020 & 2033
- Table 70: South Africa Thai Snack Bar Industry Volume (k Tons) Forecast, by Application 2020 & 2033
- Table 71: Rest of Middle East & Africa Thai Snack Bar Industry Revenue (Million) Forecast, by Application 2020 & 2033
- Table 72: Rest of Middle East & Africa Thai Snack Bar Industry Volume (k Tons) Forecast, by Application 2020 & 2033
- Table 73: Global Thai Snack Bar Industry Revenue Million Forecast, by Product Type 2020 & 2033
- Table 74: Global Thai Snack Bar Industry Volume k Tons Forecast, by Product Type 2020 & 2033
- Table 75: Global Thai Snack Bar Industry Revenue Million Forecast, by Distribution Channel 2020 & 2033
- Table 76: Global Thai Snack Bar Industry Volume k Tons Forecast, by Distribution Channel 2020 & 2033
- Table 77: Global Thai Snack Bar Industry Revenue Million Forecast, by Country 2020 & 2033
- Table 78: Global Thai Snack Bar Industry Volume k Tons Forecast, by Country 2020 & 2033
- Table 79: China Thai Snack Bar Industry Revenue (Million) Forecast, by Application 2020 & 2033
- Table 80: China Thai Snack Bar Industry Volume (k Tons) Forecast, by Application 2020 & 2033
- Table 81: India Thai Snack Bar Industry Revenue (Million) Forecast, by Application 2020 & 2033
- Table 82: India Thai Snack Bar Industry Volume (k Tons) Forecast, by Application 2020 & 2033
- Table 83: Japan Thai Snack Bar Industry Revenue (Million) Forecast, by Application 2020 & 2033
- Table 84: Japan Thai Snack Bar Industry Volume (k Tons) Forecast, by Application 2020 & 2033
- Table 85: South Korea Thai Snack Bar Industry Revenue (Million) Forecast, by Application 2020 & 2033
- Table 86: South Korea Thai Snack Bar Industry Volume (k Tons) Forecast, by Application 2020 & 2033
- Table 87: ASEAN Thai Snack Bar Industry Revenue (Million) Forecast, by Application 2020 & 2033
- Table 88: ASEAN Thai Snack Bar Industry Volume (k Tons) Forecast, by Application 2020 & 2033
- Table 89: Oceania Thai Snack Bar Industry Revenue (Million) Forecast, by Application 2020 & 2033
- Table 90: Oceania Thai Snack Bar Industry Volume (k Tons) Forecast, by Application 2020 & 2033
- Table 91: Rest of Asia Pacific Thai Snack Bar Industry Revenue (Million) Forecast, by Application 2020 & 2033
- Table 92: Rest of Asia Pacific Thai Snack Bar Industry Volume (k Tons) Forecast, by Application 2020 & 2033
Frequently Asked Questions
1. What is the projected Compound Annual Growth Rate (CAGR) of the Thai Snack Bar Industry?
The projected CAGR is approximately 5.26%.
2. Which companies are prominent players in the Thai Snack Bar Industry?
Key companies in the market include Bright Food (Group) Co, Nestle SA, Nugo Nutrition, Anna Thai Snack All, Kellogg Co, Hershey (OhYeah! Nutrition), The Quaker Oats Company, Associated British Foods PLC, Chicago Bar Company LLC, General Mills*List Not Exhaustive.
3. What are the main segments of the Thai Snack Bar Industry?
The market segments include Product Type, Distribution Channel.
4. Can you provide details about the market size?
The market size is estimated to be USD 32.26 Million as of 2022.
5. What are some drivers contributing to market growth?
Increasing Demand for Processed Food Products; Technological Advancements Supporting Market Growth.
6. What are the notable trends driving market growth?
The Growing Fitness Trend Among Population is Boosting the Market Studied.
7. Are there any restraints impacting market growth?
Increasing Cost of Production Due to Rise in Energy and Labor Cost.
8. Can you provide examples of recent developments in the market?
June 2021: General Mills Inc. introduced Good Measure, a new brand of snacks. Good Measure was launched with two products that include Creamy Nut Butter Bars and Crunchy Almond Crisps that are sweetened with allulose. The bars feature a blend of nuts, nut butter, seeds, and either dark chocolate or blueberries and come in blueberry almond, peanut dark chocolate, and almond dark chocolate varieties. The almond crisps come in sriracha and cheddar flavors. The snacks contain fewer than 5 grams of net carbs and 3 grams of sugar per serving.
9. What pricing options are available for accessing the report?
Pricing options include single-user, multi-user, and enterprise licenses priced at USD 3800, USD 4500, and USD 5800 respectively.
10. Is the market size provided in terms of value or volume?
The market size is provided in terms of value, measured in Million and volume, measured in k Tons.
11. Are there any specific market keywords associated with the report?
Yes, the market keyword associated with the report is "Thai Snack Bar Industry," which aids in identifying and referencing the specific market segment covered.
12. How do I determine which pricing option suits my needs best?
The pricing options vary based on user requirements and access needs. Individual users may opt for single-user licenses, while businesses requiring broader access may choose multi-user or enterprise licenses for cost-effective access to the report.
13. Are there any additional resources or data provided in the Thai Snack Bar Industry report?
While the report offers comprehensive insights, it's advisable to review the specific contents or supplementary materials provided to ascertain if additional resources or data are available.
14. How can I stay updated on further developments or reports in the Thai Snack Bar Industry?
To stay informed about further developments, trends, and reports in the Thai Snack Bar Industry, consider subscribing to industry newsletters, following relevant companies and organizations, or regularly checking reputable industry news sources and publications.
Methodology
Step 1 - Identification of Relevant Samples Size from Population Database


Step 2 - Approaches for Defining Global Market Size (Value, Volume* & Price*)

Note*: In applicable scenarios
Step 3 - Data Sources
Primary Research
- Web Analytics
- Survey Reports
- Research Institute
- Latest Research Reports
- Opinion Leaders
Secondary Research
- Annual Reports
- White Paper
- Latest Press Release
- Industry Association
- Paid Database
- Investor Presentations

Step 4 - Data Triangulation
Involves using different sources of information in order to increase the validity of a study
These sources are likely to be stakeholders in a program - participants, other researchers, program staff, other community members, and so on.
Then we put all data in single framework & apply various statistical tools to find out the dynamic on the market.
During the analysis stage, feedback from the stakeholder groups would be compared to determine areas of agreement as well as areas of divergence