

Key Insights
The Asia Pacific (APAC) Snack Bar Market is poised for robust expansion, projected to reach a substantial $26,040 million by 2025, with a compelling Compound Annual Growth Rate (CAGR) of 4.12% anticipated from 2025 to 2033. This growth is primarily fueled by evolving consumer lifestyles and increasing health consciousness across the region. The demand for convenient, on-the-go nutrition solutions is escalating, driven by busy urban populations and a growing awareness of healthier snacking alternatives to traditional, often sugar-laden options. Key market drivers include a rising disposable income in emerging economies, a greater focus on fitness and well-being, and the introduction of innovative product formulations catering to diverse dietary needs, such as gluten-free, vegan, and low-sugar variants. The convenience of snack bars, offering balanced macronutrients and portability, aligns perfectly with the fast-paced lifestyles prevalent in major APAC markets like China, India, and Southeast Asian nations.
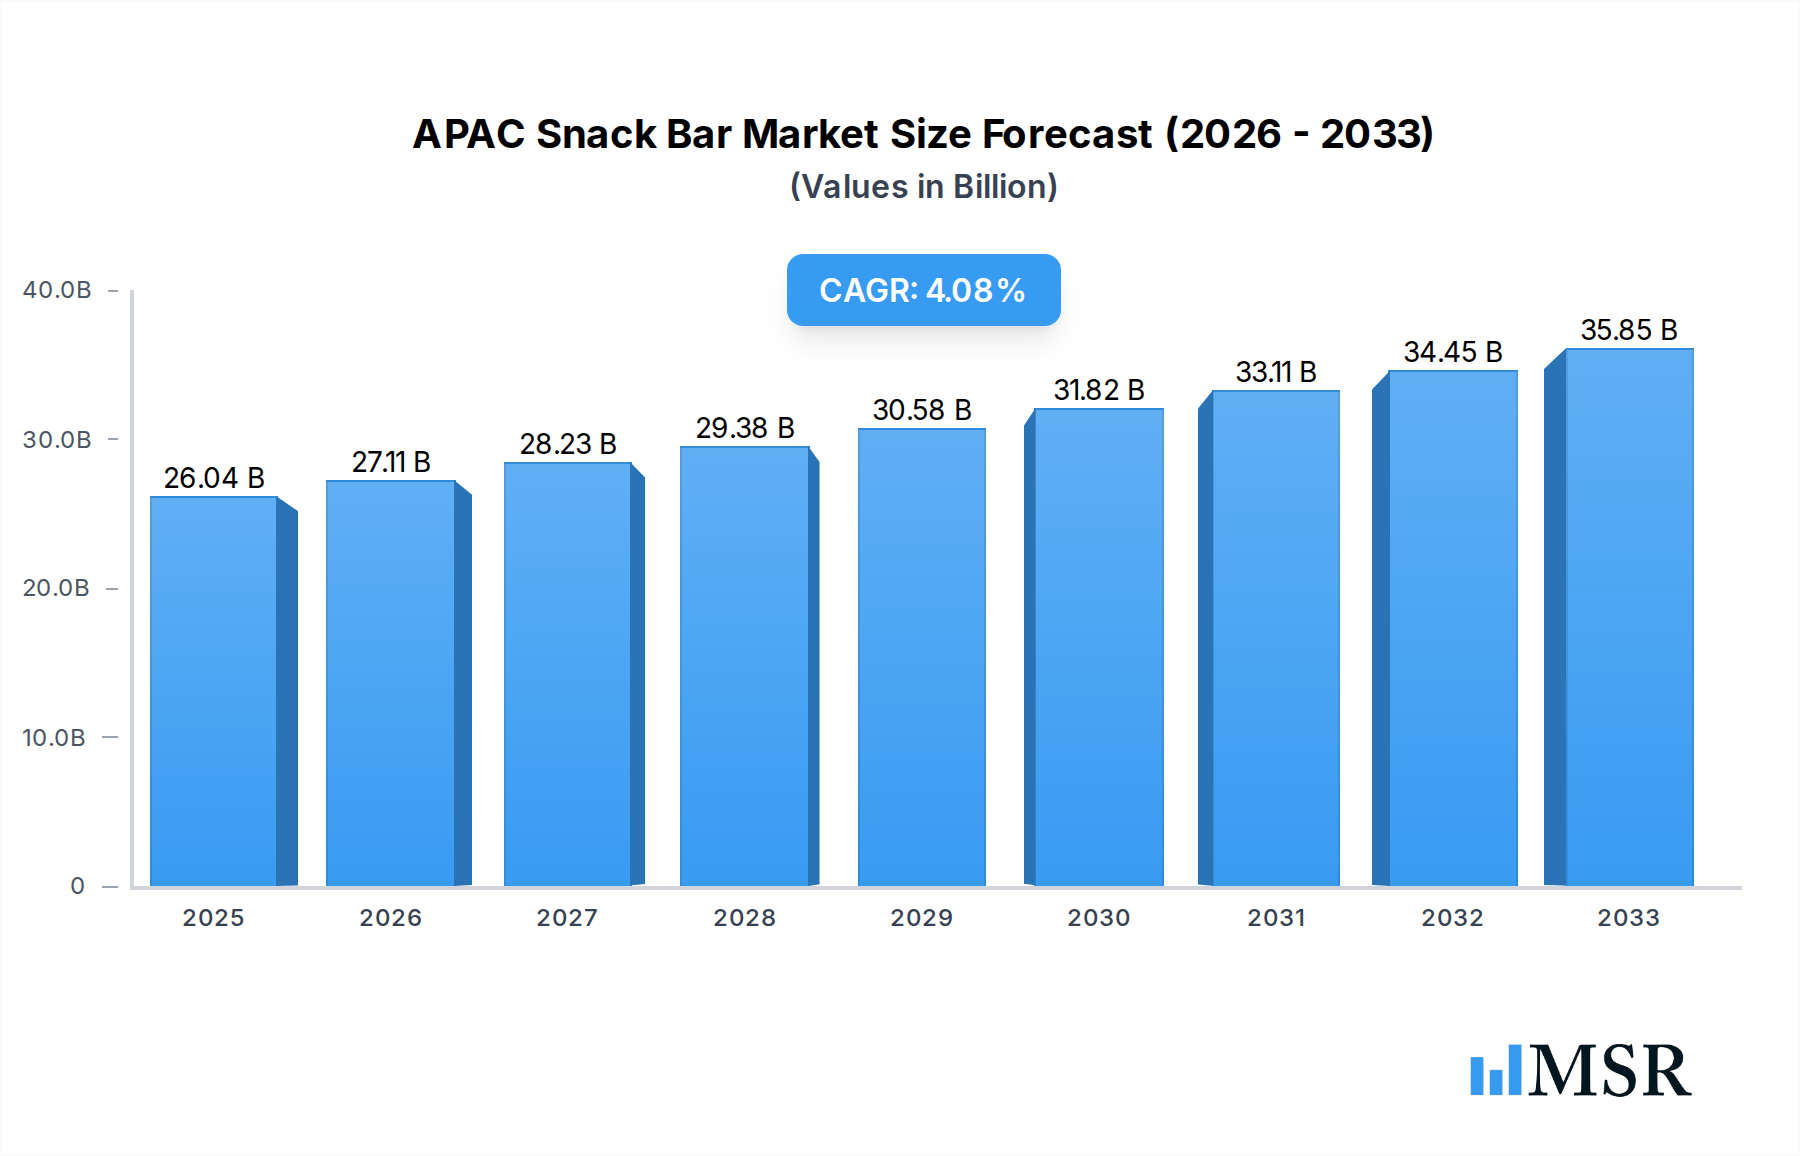
APAC Snack Bar Market Market Size (In Billion)
The market segmentation reveals a dynamic landscape with significant potential across various product types and distribution channels. Cereal bars, fruit & nut bars, and protein bars are emerging as dominant confectionery variants, reflecting a clear consumer preference for healthier ingredients and functional benefits. Protein bars, in particular, are experiencing accelerated growth due to the rising popularity of fitness and sports nutrition. Distribution channels are also diversifying, with online retail stores witnessing a remarkable surge in popularity, complementing the continued strength of traditional channels like supermarkets/hypermarkets and convenience stores. This omnichannel approach ensures wider accessibility and caters to varied consumer purchasing habits. While the market demonstrates strong growth potential, factors such as intense competition from established global players and local brands, along with price sensitivity in certain segments, present potential restraints that necessitate strategic product development and effective marketing campaigns to maintain momentum.

APAC Snack Bar Market Company Market Share
This in-depth report provides an exhaustive analysis of the Asia Pacific (APAC) Snack Bar Market, encompassing historical trends, current dynamics, and future projections from 2019 to 2033. With a base year of 2025, the report delves into market size, growth drivers, segmentation, competitive landscape, and emerging opportunities, offering actionable insights for industry stakeholders, including manufacturers, distributors, retailers, and investors. The APAC snack bar market size is projected to reach an estimated USD 15 Billion by 2025, with a projected Compound Annual Growth Rate (CAGR) of 6.5% during the forecast period of 2025–2033.
APAC Snack Bar Market Market Concentration & Dynamics
The APAC Snack Bar Market is characterized by a moderate to high level of concentration, with major global players holding significant market share. Innovation ecosystems are robust, driven by increasing consumer demand for healthier and convenient snacking options. Regulatory frameworks, while varying across countries, are generally supportive of food product innovation and safety. Substitute products, such as fresh fruits, yogurt, and other ready-to-eat snacks, present competition, but the convenience and portability of snack bars maintain their appeal. End-user trends are heavily influenced by health and wellness consciousness, with a growing preference for protein-rich and natural ingredient snack bars. Mergers and Acquisitions (M&A) activities are likely to play a crucial role in market consolidation and expansion, with an estimated XX M&A deals expected in the next five years.
- Market Concentration: Dominated by key global players, with significant regional players emerging.
- Innovation Ecosystems: Flourishing due to R&D investments in new flavors, formulations, and functional benefits.
- Regulatory Frameworks: Primarily focused on food safety, labeling transparency, and health claims.
- Substitute Products: Fresh produce, dairy products, and other convenience snacks.
- End-User Trends: Growing demand for protein bars, fruit & nut bars, and healthy snack bars.
- M&A Activities: Anticipated to drive market consolidation and strategic partnerships.
APAC Snack Bar Market Industry Insights & Trends
The APAC Snack Bar Market is experiencing dynamic growth, fueled by a confluence of economic, social, and technological factors. Rising disposable incomes across the region are leading to increased consumer spending on premium and convenient food products, including snack bars. The growing health and wellness trend is a primary growth driver, with consumers actively seeking nutritious snack bars that offer functional benefits such as high protein, fiber, and natural ingredients. This shift in consumer preference has spurred significant innovation in product development, with manufacturers introducing a wider array of organic snack bars, gluten-free snack bars, and vegan snack bars.
Technological disruptions are also shaping the market. Advanced manufacturing techniques are enabling the production of more sophisticated and appealing snack bar formulations. Furthermore, the e-commerce boom has revolutionized distribution channels, with online retail stores becoming increasingly significant for snack bar sales, offering wider product availability and convenience to consumers. The convenience store and supermarket/hypermarket segments continue to be dominant distribution channels, catering to impulse purchases and planned grocery shopping respectively. The cereal bar segment remains a strong performer due to its perceived health benefits and affordability, while the protein bar segment is witnessing rapid expansion driven by fitness enthusiasts and health-conscious individuals. The fruit & nut bar segment also continues to attract consumers looking for natural energy sources and wholesome ingredients. The overall market size for APAC snack bars is estimated at USD 12 Billion in 2024, projected to grow at a CAGR of 6.5% from 2025 to 2033.
Key Markets & Segments Leading APAC Snack Bar Market
The APAC Snack Bar Market is a diverse landscape, with several key markets and segments demonstrating significant leadership and growth potential. Among the distribution channels, Supermarkets/Hypermarkets are currently the dominant force, accounting for an estimated 45% of the market share, driven by their wide product selection and consumer trust for grocery shopping. Online Retail Stores are rapidly gaining traction, projected to capture a significant 30% of the market by 2025, fueled by the convenience and expanding reach of e-commerce platforms. Convenience Stores follow, holding approximately 20% market share, ideal for on-the-go purchases.
In terms of product variants, the Cereal Bar segment leads, representing an estimated 35% of the market, owing to its long-standing popularity and perception as a healthy breakfast or snack option. The Fruit & Nut Bar segment holds a substantial 30% share, appealing to consumers seeking natural energy and wholesome ingredients. The Protein Bar segment is the fastest-growing, projected to reach 25% market share by 2025, driven by increasing health consciousness and the fitness trend. Emerging markets such as China, India, and Southeast Asian nations are key growth drivers due to their burgeoning middle class and increasing adoption of Western dietary habits. Factors such as economic growth, increased urbanization, and evolving lifestyle patterns are propelling the demand for convenient and nutritious snacking solutions in these regions.
- Dominant Distribution Channel:
- Supermarket/Hypermarket: Extensive product availability and consumer trust.
- Online Retail Store: Rapidly growing, driven by convenience and reach.
- Convenience Store: Ideal for impulse purchases and on-the-go consumption.
- Leading Product Variants:
- Cereal Bar: Established popularity, perceived health benefits.
- Fruit & Nut Bar: Natural energy source, wholesome ingredients.
- Protein Bar: Fastest growing, driven by health and fitness trends.
- Key Market Drivers:
- Economic growth and rising disposable incomes in emerging economies.
- Increasing urbanization and busier lifestyles demanding convenient food options.
- Growing health and wellness consciousness among consumers.
- Expanding e-commerce penetration and digital retail infrastructure.
APAC Snack Bar Market Product Developments
Product innovation is a cornerstone of the APAC Snack Bar Market. Manufacturers are continuously developing new formulations that cater to evolving consumer preferences for healthier ingredients, enhanced nutritional profiles, and exciting flavor combinations. Recent product launches highlight a strong focus on protein-enriched bars, appealing to the fitness-conscious demographic and those seeking sustained energy. The incorporation of natural sweeteners, plant-based ingredients, and superfoods is also a prominent trend, addressing the demand for cleaner labels and functional benefits. Advancements in processing technologies are enabling the creation of bars with improved texture and shelf-life, further enhancing their market appeal and competitive edge.
Challenges in the APAC Snack Bar Market Market
The APAC Snack Bar Market, despite its growth, faces several challenges that can impact its expansion. Regulatory hurdles, particularly regarding health claims and ingredient standards, can create compliance complexities for manufacturers. Supply chain disruptions, exacerbated by geopolitical factors and climate change, can affect the availability and cost of key raw materials. Intense competitive pressures from both established players and emerging local brands can lead to price wars and reduced profit margins. Furthermore, educating consumers about the nuanced benefits of different snack bar types and dispelling misconceptions about processed foods remains an ongoing challenge.
Forces Driving APAC Snack Bar Market Growth
Several powerful forces are propelling the growth of the APAC Snack Bar Market. The overarching health and wellness trend is a primary catalyst, with consumers actively seeking convenient yet nutritious snacking alternatives. The rising disposable incomes across many APAC countries are enabling greater purchasing power for premium and specialized snack bars. Urbanization and changing lifestyles have created a demand for on-the-go food solutions that offer both convenience and nutritional value. Furthermore, technological advancements in food manufacturing are facilitating the creation of innovative and appealing snack bar products, meeting diverse consumer needs.
Challenges in the APAC Snack Bar Market Market
Long-term growth catalysts in the APAC Snack Bar Market are deeply intertwined with ongoing market evolution and strategic initiatives. Continuous product innovation, focusing on unique flavor profiles, functional ingredients (e.g., probiotics, adaptogens), and sustainable sourcing, will be crucial for sustained consumer interest. Strategic partnerships between snack bar manufacturers and health and fitness influencers or platforms can expand market reach and credibility. Market expansion into underserved rural areas and developing economies, supported by adapted product offerings and distribution strategies, presents significant untapped potential.
Emerging Opportunities in APAC Snack Bar Market
Emerging opportunities in the APAC Snack Bar Market are abundant and varied. The growing demand for plant-based and vegan snack bars presents a significant avenue for innovation and market penetration. The increasing popularity of personalized nutrition and the growing interest in allergy-friendly snack bars (e.g., gluten-free, dairy-free) offer niche market potential. Furthermore, the integration of snack bars into broader health and wellness ecosystems, such as meal replacement bars or sports nutrition bars, represents a strategic growth opportunity. Tapping into the burgeoning e-commerce channels and leveraging data analytics to understand consumer preferences will be key to capitalizing on these emerging trends.
Leading Players in the APAC Snack Bar Market Sector
- Nestlé SA
- Post Holdings Inc
- Asahi Group Holdings Ltd
- Simply Good Foods Co
- General Mills Inc
- PepsiCo Inc
- Lotus Bakeries
- Morinaga & Co Ltd
- Bagrrys India Private Limited
- Carman's Fine Foods Pty Ltd
- Ferrero International SA
- Naturell India Pvt Ltd
- Mars Incorporated
- Otsuka Holdings Co Ltd
- Mondelēz International Inc
- Amway International Inc
- Kellogg Company
Key Milestones in APAC Snack Bar Market Industry
- May 2023: Nestlé’s Milo launched a protein snack bar offering 6 g of protein and a source of fiber, retailing at USD 8 for 180 g (six bars), available in Coles and independent grocers across Australia. This move highlights the growing demand for protein-fortified convenience snacks.
- May 2023: Uncle Tobys unveiled a protein muesli bar in four new flavors, made with 20% protein (7 g per bar). Available in multipacks of 5 for RRP AUD 6.70 in supermarkets, the flavors include Caramel and Dark Choc, Raspberry, Goji and White Choc, Lemon with a Yoghurty Drizzle, and Double Choc, showcasing flavor innovation in the healthy snack category.
- March 2023: Bagrrys India Private Limited announced the launch of The Mighty Muesli Bars, emphasizing their all-natural, healthy composition packed with multi-grains, nuts, fruits, and honey, with a focus on high fiber content, catering to the increasing demand for wholesome and natural snack options in India.
Strategic Outlook for APAC Snack Bar Market Market
The strategic outlook for the APAC Snack Bar Market is one of sustained and robust growth. Key growth accelerators will include a continued emphasis on product innovation, particularly in the realms of plant-based options, functional ingredients, and personalized nutrition. Strategic partnerships with health and wellness influencers and the expansion of distribution networks into emerging markets and rural areas will be vital. Leveraging the increasing penetration of online retail and investing in data analytics to understand evolving consumer preferences will enable companies to tailor their offerings effectively. Furthermore, a focus on sustainability and ethical sourcing will resonate with an increasingly conscious consumer base, driving brand loyalty and market leadership.
APAC Snack Bar Market Segmentation
-
1. Confectionery Variant
- 1.1. Cereal Bar
- 1.2. Fruit & Nut Bar
- 1.3. Protein Bar
-
2. Distribution Channel
- 2.1. Convenience Store
- 2.2. Online Retail Store
- 2.3. Supermarket/Hypermarket
- 2.4. Others
APAC Snack Bar Market Segmentation By Geography
-
1. North America
- 1.1. United States
- 1.2. Canada
- 1.3. Mexico
-
2. South America
- 2.1. Brazil
- 2.2. Argentina
- 2.3. Rest of South America
-
3. Europe
- 3.1. United Kingdom
- 3.2. Germany
- 3.3. France
- 3.4. Italy
- 3.5. Spain
- 3.6. Russia
- 3.7. Benelux
- 3.8. Nordics
- 3.9. Rest of Europe
-
4. Middle East & Africa
- 4.1. Turkey
- 4.2. Israel
- 4.3. GCC
- 4.4. North Africa
- 4.5. South Africa
- 4.6. Rest of Middle East & Africa
-
5. Asia Pacific
- 5.1. China
- 5.2. India
- 5.3. Japan
- 5.4. South Korea
- 5.5. ASEAN
- 5.6. Oceania
- 5.7. Rest of Asia Pacific

APAC Snack Bar Market Regional Market Share
Geographic Coverage of APAC Snack Bar Market
APAC Snack Bar Market REPORT HIGHLIGHTS
| Aspects | Details |
|---|---|
| Study Period | 2020-2034 |
| Base Year | 2025 |
| Estimated Year | 2026 |
| Forecast Period | 2026-2034 |
| Historical Period | 2020-2025 |
| Growth Rate | CAGR of 4.12% from 2020-2034 |
| Segmentation |
|
Table of Contents
- 1. Introduction
- 1.1. Research Scope
- 1.2. Market Segmentation
- 1.3. Research Objective
- 1.4. Definitions and Assumptions
- 2. Executive Summary
- 2.1. Market Snapshot
- 3. Market Dynamics
- 3.1. Market Drivers
- 3.2. Market Restrains
- 3.3. Market Trends
- 3.4. Market Opportunities
- 4. Market Factor Analysis
- 4.1. Porters Five Forces
- 4.1.1. Bargaining Power of Suppliers
- 4.1.2. Bargaining Power of Buyers
- 4.1.3. Threat of New Entrants
- 4.1.4. Threat of Substitutes
- 4.1.5. Competitive Rivalry
- 4.2. PESTEL analysis
- 4.3. BCG Analysis
- 4.3.1. Stars (High Growth, High Market Share)
- 4.3.2. Cash Cows (Low Growth, High Market Share)
- 4.3.3. Question Mark (High Growth, Low Market Share)
- 4.3.4. Dogs (Low Growth, Low Market Share)
- 4.4. Ansoff Matrix Analysis
- 4.5. Supply Chain Analysis
- 4.6. Regulatory Landscape
- 4.7. Current Market Potential and Opportunity Assessment (TAM–SAM–SOM Framework)
- 4.8. MSR Analyst Note
- 4.1. Porters Five Forces
- 5. Market Analysis, Insights and Forecast 2021-2033
- 5.1. Market Analysis, Insights and Forecast - by Confectionery Variant
- 5.1.1. Cereal Bar
- 5.1.2. Fruit & Nut Bar
- 5.1.3. Protein Bar
- 5.2. Market Analysis, Insights and Forecast - by Distribution Channel
- 5.2.1. Convenience Store
- 5.2.2. Online Retail Store
- 5.2.3. Supermarket/Hypermarket
- 5.2.4. Others
- 5.3. Market Analysis, Insights and Forecast - by Region
- 5.3.1. North America
- 5.3.2. South America
- 5.3.3. Europe
- 5.3.4. Middle East & Africa
- 5.3.5. Asia Pacific
- 5.1. Market Analysis, Insights and Forecast - by Confectionery Variant
- 6. Global APAC Snack Bar Market Analysis, Insights and Forecast, 2021-2033
- 6.1. Market Analysis, Insights and Forecast - by Confectionery Variant
- 6.1.1. Cereal Bar
- 6.1.2. Fruit & Nut Bar
- 6.1.3. Protein Bar
- 6.2. Market Analysis, Insights and Forecast - by Distribution Channel
- 6.2.1. Convenience Store
- 6.2.2. Online Retail Store
- 6.2.3. Supermarket/Hypermarket
- 6.2.4. Others
- 6.1. Market Analysis, Insights and Forecast - by Confectionery Variant
- 7. North America APAC Snack Bar Market Analysis, Insights and Forecast, 2020-2032
- 7.1. Market Analysis, Insights and Forecast - by Confectionery Variant
- 7.1.1. Cereal Bar
- 7.1.2. Fruit & Nut Bar
- 7.1.3. Protein Bar
- 7.2. Market Analysis, Insights and Forecast - by Distribution Channel
- 7.2.1. Convenience Store
- 7.2.2. Online Retail Store
- 7.2.3. Supermarket/Hypermarket
- 7.2.4. Others
- 7.1. Market Analysis, Insights and Forecast - by Confectionery Variant
- 8. South America APAC Snack Bar Market Analysis, Insights and Forecast, 2020-2032
- 8.1. Market Analysis, Insights and Forecast - by Confectionery Variant
- 8.1.1. Cereal Bar
- 8.1.2. Fruit & Nut Bar
- 8.1.3. Protein Bar
- 8.2. Market Analysis, Insights and Forecast - by Distribution Channel
- 8.2.1. Convenience Store
- 8.2.2. Online Retail Store
- 8.2.3. Supermarket/Hypermarket
- 8.2.4. Others
- 8.1. Market Analysis, Insights and Forecast - by Confectionery Variant
- 9. Europe APAC Snack Bar Market Analysis, Insights and Forecast, 2020-2032
- 9.1. Market Analysis, Insights and Forecast - by Confectionery Variant
- 9.1.1. Cereal Bar
- 9.1.2. Fruit & Nut Bar
- 9.1.3. Protein Bar
- 9.2. Market Analysis, Insights and Forecast - by Distribution Channel
- 9.2.1. Convenience Store
- 9.2.2. Online Retail Store
- 9.2.3. Supermarket/Hypermarket
- 9.2.4. Others
- 9.1. Market Analysis, Insights and Forecast - by Confectionery Variant
- 10. Middle East & Africa APAC Snack Bar Market Analysis, Insights and Forecast, 2020-2032
- 10.1. Market Analysis, Insights and Forecast - by Confectionery Variant
- 10.1.1. Cereal Bar
- 10.1.2. Fruit & Nut Bar
- 10.1.3. Protein Bar
- 10.2. Market Analysis, Insights and Forecast - by Distribution Channel
- 10.2.1. Convenience Store
- 10.2.2. Online Retail Store
- 10.2.3. Supermarket/Hypermarket
- 10.2.4. Others
- 10.1. Market Analysis, Insights and Forecast - by Confectionery Variant
- 11. Asia Pacific APAC Snack Bar Market Analysis, Insights and Forecast, 2020-2032
- 11.1. Market Analysis, Insights and Forecast - by Confectionery Variant
- 11.1.1. Cereal Bar
- 11.1.2. Fruit & Nut Bar
- 11.1.3. Protein Bar
- 11.2. Market Analysis, Insights and Forecast - by Distribution Channel
- 11.2.1. Convenience Store
- 11.2.2. Online Retail Store
- 11.2.3. Supermarket/Hypermarket
- 11.2.4. Others
- 11.1. Market Analysis, Insights and Forecast - by Confectionery Variant
- 12. Competitive Analysis
- 12.1. Company Profiles
- 12.1.1 Nestlé SA
- 12.1.1.1. Company Overview
- 12.1.1.2. Products
- 12.1.1.3. Company Financials
- 12.1.1.4. SWOT Analysis
- 12.1.2 Post Holdings Inc
- 12.1.2.1. Company Overview
- 12.1.2.2. Products
- 12.1.2.3. Company Financials
- 12.1.2.4. SWOT Analysis
- 12.1.3 Asahi Group Holdings Ltd
- 12.1.3.1. Company Overview
- 12.1.3.2. Products
- 12.1.3.3. Company Financials
- 12.1.3.4. SWOT Analysis
- 12.1.4 Simply Good Foods Co
- 12.1.4.1. Company Overview
- 12.1.4.2. Products
- 12.1.4.3. Company Financials
- 12.1.4.4. SWOT Analysis
- 12.1.5 General Mills Inc
- 12.1.5.1. Company Overview
- 12.1.5.2. Products
- 12.1.5.3. Company Financials
- 12.1.5.4. SWOT Analysis
- 12.1.6 PepsiCo Inc
- 12.1.6.1. Company Overview
- 12.1.6.2. Products
- 12.1.6.3. Company Financials
- 12.1.6.4. SWOT Analysis
- 12.1.7 Lotus Bakeries
- 12.1.7.1. Company Overview
- 12.1.7.2. Products
- 12.1.7.3. Company Financials
- 12.1.7.4. SWOT Analysis
- 12.1.8 Morinaga & Co Ltd
- 12.1.8.1. Company Overview
- 12.1.8.2. Products
- 12.1.8.3. Company Financials
- 12.1.8.4. SWOT Analysis
- 12.1.9 Bagrrys India Private Limited
- 12.1.9.1. Company Overview
- 12.1.9.2. Products
- 12.1.9.3. Company Financials
- 12.1.9.4. SWOT Analysis
- 12.1.10 Carman's Fine Foods Pty Ltd
- 12.1.10.1. Company Overview
- 12.1.10.2. Products
- 12.1.10.3. Company Financials
- 12.1.10.4. SWOT Analysis
- 12.1.11 Ferrero International SA
- 12.1.11.1. Company Overview
- 12.1.11.2. Products
- 12.1.11.3. Company Financials
- 12.1.11.4. SWOT Analysis
- 12.1.12 Naturell India Pvt Ltd
- 12.1.12.1. Company Overview
- 12.1.12.2. Products
- 12.1.12.3. Company Financials
- 12.1.12.4. SWOT Analysis
- 12.1.13 Mars Incorporated
- 12.1.13.1. Company Overview
- 12.1.13.2. Products
- 12.1.13.3. Company Financials
- 12.1.13.4. SWOT Analysis
- 12.1.14 Otsuka Holdings Co Ltd
- 12.1.14.1. Company Overview
- 12.1.14.2. Products
- 12.1.14.3. Company Financials
- 12.1.14.4. SWOT Analysis
- 12.1.15 Mondelēz International Inc
- 12.1.15.1. Company Overview
- 12.1.15.2. Products
- 12.1.15.3. Company Financials
- 12.1.15.4. SWOT Analysis
- 12.1.16 Amway International Inc
- 12.1.16.1. Company Overview
- 12.1.16.2. Products
- 12.1.16.3. Company Financials
- 12.1.16.4. SWOT Analysis
- 12.1.17 Kellogg Company
- 12.1.17.1. Company Overview
- 12.1.17.2. Products
- 12.1.17.3. Company Financials
- 12.1.17.4. SWOT Analysis
- 12.1.1 Nestlé SA
- 12.2. Market Entropy
- 12.2.1 Company's Key Areas Served
- 12.2.2 Recent Developments
- 12.3. Company Market Share Analysis 2025
- 12.3.1 Top 5 Companies Market Share Analysis
- 12.3.2 Top 3 Companies Market Share Analysis
- 12.4. List of Potential Customers
- 13. Research Methodology
List of Figures
- Figure 1: Global APAC Snack Bar Market Revenue Breakdown (Million, %) by Region 2025 & 2033
- Figure 2: Global APAC Snack Bar Market Volume Breakdown (K Tons, %) by Region 2025 & 2033
- Figure 3: North America APAC Snack Bar Market Revenue (Million), by Confectionery Variant 2025 & 2033
- Figure 4: North America APAC Snack Bar Market Volume (K Tons), by Confectionery Variant 2025 & 2033
- Figure 5: North America APAC Snack Bar Market Revenue Share (%), by Confectionery Variant 2025 & 2033
- Figure 6: North America APAC Snack Bar Market Volume Share (%), by Confectionery Variant 2025 & 2033
- Figure 7: North America APAC Snack Bar Market Revenue (Million), by Distribution Channel 2025 & 2033
- Figure 8: North America APAC Snack Bar Market Volume (K Tons), by Distribution Channel 2025 & 2033
- Figure 9: North America APAC Snack Bar Market Revenue Share (%), by Distribution Channel 2025 & 2033
- Figure 10: North America APAC Snack Bar Market Volume Share (%), by Distribution Channel 2025 & 2033
- Figure 11: North America APAC Snack Bar Market Revenue (Million), by Country 2025 & 2033
- Figure 12: North America APAC Snack Bar Market Volume (K Tons), by Country 2025 & 2033
- Figure 13: North America APAC Snack Bar Market Revenue Share (%), by Country 2025 & 2033
- Figure 14: North America APAC Snack Bar Market Volume Share (%), by Country 2025 & 2033
- Figure 15: South America APAC Snack Bar Market Revenue (Million), by Confectionery Variant 2025 & 2033
- Figure 16: South America APAC Snack Bar Market Volume (K Tons), by Confectionery Variant 2025 & 2033
- Figure 17: South America APAC Snack Bar Market Revenue Share (%), by Confectionery Variant 2025 & 2033
- Figure 18: South America APAC Snack Bar Market Volume Share (%), by Confectionery Variant 2025 & 2033
- Figure 19: South America APAC Snack Bar Market Revenue (Million), by Distribution Channel 2025 & 2033
- Figure 20: South America APAC Snack Bar Market Volume (K Tons), by Distribution Channel 2025 & 2033
- Figure 21: South America APAC Snack Bar Market Revenue Share (%), by Distribution Channel 2025 & 2033
- Figure 22: South America APAC Snack Bar Market Volume Share (%), by Distribution Channel 2025 & 2033
- Figure 23: South America APAC Snack Bar Market Revenue (Million), by Country 2025 & 2033
- Figure 24: South America APAC Snack Bar Market Volume (K Tons), by Country 2025 & 2033
- Figure 25: South America APAC Snack Bar Market Revenue Share (%), by Country 2025 & 2033
- Figure 26: South America APAC Snack Bar Market Volume Share (%), by Country 2025 & 2033
- Figure 27: Europe APAC Snack Bar Market Revenue (Million), by Confectionery Variant 2025 & 2033
- Figure 28: Europe APAC Snack Bar Market Volume (K Tons), by Confectionery Variant 2025 & 2033
- Figure 29: Europe APAC Snack Bar Market Revenue Share (%), by Confectionery Variant 2025 & 2033
- Figure 30: Europe APAC Snack Bar Market Volume Share (%), by Confectionery Variant 2025 & 2033
- Figure 31: Europe APAC Snack Bar Market Revenue (Million), by Distribution Channel 2025 & 2033
- Figure 32: Europe APAC Snack Bar Market Volume (K Tons), by Distribution Channel 2025 & 2033
- Figure 33: Europe APAC Snack Bar Market Revenue Share (%), by Distribution Channel 2025 & 2033
- Figure 34: Europe APAC Snack Bar Market Volume Share (%), by Distribution Channel 2025 & 2033
- Figure 35: Europe APAC Snack Bar Market Revenue (Million), by Country 2025 & 2033
- Figure 36: Europe APAC Snack Bar Market Volume (K Tons), by Country 2025 & 2033
- Figure 37: Europe APAC Snack Bar Market Revenue Share (%), by Country 2025 & 2033
- Figure 38: Europe APAC Snack Bar Market Volume Share (%), by Country 2025 & 2033
- Figure 39: Middle East & Africa APAC Snack Bar Market Revenue (Million), by Confectionery Variant 2025 & 2033
- Figure 40: Middle East & Africa APAC Snack Bar Market Volume (K Tons), by Confectionery Variant 2025 & 2033
- Figure 41: Middle East & Africa APAC Snack Bar Market Revenue Share (%), by Confectionery Variant 2025 & 2033
- Figure 42: Middle East & Africa APAC Snack Bar Market Volume Share (%), by Confectionery Variant 2025 & 2033
- Figure 43: Middle East & Africa APAC Snack Bar Market Revenue (Million), by Distribution Channel 2025 & 2033
- Figure 44: Middle East & Africa APAC Snack Bar Market Volume (K Tons), by Distribution Channel 2025 & 2033
- Figure 45: Middle East & Africa APAC Snack Bar Market Revenue Share (%), by Distribution Channel 2025 & 2033
- Figure 46: Middle East & Africa APAC Snack Bar Market Volume Share (%), by Distribution Channel 2025 & 2033
- Figure 47: Middle East & Africa APAC Snack Bar Market Revenue (Million), by Country 2025 & 2033
- Figure 48: Middle East & Africa APAC Snack Bar Market Volume (K Tons), by Country 2025 & 2033
- Figure 49: Middle East & Africa APAC Snack Bar Market Revenue Share (%), by Country 2025 & 2033
- Figure 50: Middle East & Africa APAC Snack Bar Market Volume Share (%), by Country 2025 & 2033
- Figure 51: Asia Pacific APAC Snack Bar Market Revenue (Million), by Confectionery Variant 2025 & 2033
- Figure 52: Asia Pacific APAC Snack Bar Market Volume (K Tons), by Confectionery Variant 2025 & 2033
- Figure 53: Asia Pacific APAC Snack Bar Market Revenue Share (%), by Confectionery Variant 2025 & 2033
- Figure 54: Asia Pacific APAC Snack Bar Market Volume Share (%), by Confectionery Variant 2025 & 2033
- Figure 55: Asia Pacific APAC Snack Bar Market Revenue (Million), by Distribution Channel 2025 & 2033
- Figure 56: Asia Pacific APAC Snack Bar Market Volume (K Tons), by Distribution Channel 2025 & 2033
- Figure 57: Asia Pacific APAC Snack Bar Market Revenue Share (%), by Distribution Channel 2025 & 2033
- Figure 58: Asia Pacific APAC Snack Bar Market Volume Share (%), by Distribution Channel 2025 & 2033
- Figure 59: Asia Pacific APAC Snack Bar Market Revenue (Million), by Country 2025 & 2033
- Figure 60: Asia Pacific APAC Snack Bar Market Volume (K Tons), by Country 2025 & 2033
- Figure 61: Asia Pacific APAC Snack Bar Market Revenue Share (%), by Country 2025 & 2033
- Figure 62: Asia Pacific APAC Snack Bar Market Volume Share (%), by Country 2025 & 2033
List of Tables
- Table 1: Global APAC Snack Bar Market Revenue Million Forecast, by Confectionery Variant 2020 & 2033
- Table 2: Global APAC Snack Bar Market Volume K Tons Forecast, by Confectionery Variant 2020 & 2033
- Table 3: Global APAC Snack Bar Market Revenue Million Forecast, by Distribution Channel 2020 & 2033
- Table 4: Global APAC Snack Bar Market Volume K Tons Forecast, by Distribution Channel 2020 & 2033
- Table 5: Global APAC Snack Bar Market Revenue Million Forecast, by Region 2020 & 2033
- Table 6: Global APAC Snack Bar Market Volume K Tons Forecast, by Region 2020 & 2033
- Table 7: Global APAC Snack Bar Market Revenue Million Forecast, by Confectionery Variant 2020 & 2033
- Table 8: Global APAC Snack Bar Market Volume K Tons Forecast, by Confectionery Variant 2020 & 2033
- Table 9: Global APAC Snack Bar Market Revenue Million Forecast, by Distribution Channel 2020 & 2033
- Table 10: Global APAC Snack Bar Market Volume K Tons Forecast, by Distribution Channel 2020 & 2033
- Table 11: Global APAC Snack Bar Market Revenue Million Forecast, by Country 2020 & 2033
- Table 12: Global APAC Snack Bar Market Volume K Tons Forecast, by Country 2020 & 2033
- Table 13: United States APAC Snack Bar Market Revenue (Million) Forecast, by Application 2020 & 2033
- Table 14: United States APAC Snack Bar Market Volume (K Tons) Forecast, by Application 2020 & 2033
- Table 15: Canada APAC Snack Bar Market Revenue (Million) Forecast, by Application 2020 & 2033
- Table 16: Canada APAC Snack Bar Market Volume (K Tons) Forecast, by Application 2020 & 2033
- Table 17: Mexico APAC Snack Bar Market Revenue (Million) Forecast, by Application 2020 & 2033
- Table 18: Mexico APAC Snack Bar Market Volume (K Tons) Forecast, by Application 2020 & 2033
- Table 19: Global APAC Snack Bar Market Revenue Million Forecast, by Confectionery Variant 2020 & 2033
- Table 20: Global APAC Snack Bar Market Volume K Tons Forecast, by Confectionery Variant 2020 & 2033
- Table 21: Global APAC Snack Bar Market Revenue Million Forecast, by Distribution Channel 2020 & 2033
- Table 22: Global APAC Snack Bar Market Volume K Tons Forecast, by Distribution Channel 2020 & 2033
- Table 23: Global APAC Snack Bar Market Revenue Million Forecast, by Country 2020 & 2033
- Table 24: Global APAC Snack Bar Market Volume K Tons Forecast, by Country 2020 & 2033
- Table 25: Brazil APAC Snack Bar Market Revenue (Million) Forecast, by Application 2020 & 2033
- Table 26: Brazil APAC Snack Bar Market Volume (K Tons) Forecast, by Application 2020 & 2033
- Table 27: Argentina APAC Snack Bar Market Revenue (Million) Forecast, by Application 2020 & 2033
- Table 28: Argentina APAC Snack Bar Market Volume (K Tons) Forecast, by Application 2020 & 2033
- Table 29: Rest of South America APAC Snack Bar Market Revenue (Million) Forecast, by Application 2020 & 2033
- Table 30: Rest of South America APAC Snack Bar Market Volume (K Tons) Forecast, by Application 2020 & 2033
- Table 31: Global APAC Snack Bar Market Revenue Million Forecast, by Confectionery Variant 2020 & 2033
- Table 32: Global APAC Snack Bar Market Volume K Tons Forecast, by Confectionery Variant 2020 & 2033
- Table 33: Global APAC Snack Bar Market Revenue Million Forecast, by Distribution Channel 2020 & 2033
- Table 34: Global APAC Snack Bar Market Volume K Tons Forecast, by Distribution Channel 2020 & 2033
- Table 35: Global APAC Snack Bar Market Revenue Million Forecast, by Country 2020 & 2033
- Table 36: Global APAC Snack Bar Market Volume K Tons Forecast, by Country 2020 & 2033
- Table 37: United Kingdom APAC Snack Bar Market Revenue (Million) Forecast, by Application 2020 & 2033
- Table 38: United Kingdom APAC Snack Bar Market Volume (K Tons) Forecast, by Application 2020 & 2033
- Table 39: Germany APAC Snack Bar Market Revenue (Million) Forecast, by Application 2020 & 2033
- Table 40: Germany APAC Snack Bar Market Volume (K Tons) Forecast, by Application 2020 & 2033
- Table 41: France APAC Snack Bar Market Revenue (Million) Forecast, by Application 2020 & 2033
- Table 42: France APAC Snack Bar Market Volume (K Tons) Forecast, by Application 2020 & 2033
- Table 43: Italy APAC Snack Bar Market Revenue (Million) Forecast, by Application 2020 & 2033
- Table 44: Italy APAC Snack Bar Market Volume (K Tons) Forecast, by Application 2020 & 2033
- Table 45: Spain APAC Snack Bar Market Revenue (Million) Forecast, by Application 2020 & 2033
- Table 46: Spain APAC Snack Bar Market Volume (K Tons) Forecast, by Application 2020 & 2033
- Table 47: Russia APAC Snack Bar Market Revenue (Million) Forecast, by Application 2020 & 2033
- Table 48: Russia APAC Snack Bar Market Volume (K Tons) Forecast, by Application 2020 & 2033
- Table 49: Benelux APAC Snack Bar Market Revenue (Million) Forecast, by Application 2020 & 2033
- Table 50: Benelux APAC Snack Bar Market Volume (K Tons) Forecast, by Application 2020 & 2033
- Table 51: Nordics APAC Snack Bar Market Revenue (Million) Forecast, by Application 2020 & 2033
- Table 52: Nordics APAC Snack Bar Market Volume (K Tons) Forecast, by Application 2020 & 2033
- Table 53: Rest of Europe APAC Snack Bar Market Revenue (Million) Forecast, by Application 2020 & 2033
- Table 54: Rest of Europe APAC Snack Bar Market Volume (K Tons) Forecast, by Application 2020 & 2033
- Table 55: Global APAC Snack Bar Market Revenue Million Forecast, by Confectionery Variant 2020 & 2033
- Table 56: Global APAC Snack Bar Market Volume K Tons Forecast, by Confectionery Variant 2020 & 2033
- Table 57: Global APAC Snack Bar Market Revenue Million Forecast, by Distribution Channel 2020 & 2033
- Table 58: Global APAC Snack Bar Market Volume K Tons Forecast, by Distribution Channel 2020 & 2033
- Table 59: Global APAC Snack Bar Market Revenue Million Forecast, by Country 2020 & 2033
- Table 60: Global APAC Snack Bar Market Volume K Tons Forecast, by Country 2020 & 2033
- Table 61: Turkey APAC Snack Bar Market Revenue (Million) Forecast, by Application 2020 & 2033
- Table 62: Turkey APAC Snack Bar Market Volume (K Tons) Forecast, by Application 2020 & 2033
- Table 63: Israel APAC Snack Bar Market Revenue (Million) Forecast, by Application 2020 & 2033
- Table 64: Israel APAC Snack Bar Market Volume (K Tons) Forecast, by Application 2020 & 2033
- Table 65: GCC APAC Snack Bar Market Revenue (Million) Forecast, by Application 2020 & 2033
- Table 66: GCC APAC Snack Bar Market Volume (K Tons) Forecast, by Application 2020 & 2033
- Table 67: North Africa APAC Snack Bar Market Revenue (Million) Forecast, by Application 2020 & 2033
- Table 68: North Africa APAC Snack Bar Market Volume (K Tons) Forecast, by Application 2020 & 2033
- Table 69: South Africa APAC Snack Bar Market Revenue (Million) Forecast, by Application 2020 & 2033
- Table 70: South Africa APAC Snack Bar Market Volume (K Tons) Forecast, by Application 2020 & 2033
- Table 71: Rest of Middle East & Africa APAC Snack Bar Market Revenue (Million) Forecast, by Application 2020 & 2033
- Table 72: Rest of Middle East & Africa APAC Snack Bar Market Volume (K Tons) Forecast, by Application 2020 & 2033
- Table 73: Global APAC Snack Bar Market Revenue Million Forecast, by Confectionery Variant 2020 & 2033
- Table 74: Global APAC Snack Bar Market Volume K Tons Forecast, by Confectionery Variant 2020 & 2033
- Table 75: Global APAC Snack Bar Market Revenue Million Forecast, by Distribution Channel 2020 & 2033
- Table 76: Global APAC Snack Bar Market Volume K Tons Forecast, by Distribution Channel 2020 & 2033
- Table 77: Global APAC Snack Bar Market Revenue Million Forecast, by Country 2020 & 2033
- Table 78: Global APAC Snack Bar Market Volume K Tons Forecast, by Country 2020 & 2033
- Table 79: China APAC Snack Bar Market Revenue (Million) Forecast, by Application 2020 & 2033
- Table 80: China APAC Snack Bar Market Volume (K Tons) Forecast, by Application 2020 & 2033
- Table 81: India APAC Snack Bar Market Revenue (Million) Forecast, by Application 2020 & 2033
- Table 82: India APAC Snack Bar Market Volume (K Tons) Forecast, by Application 2020 & 2033
- Table 83: Japan APAC Snack Bar Market Revenue (Million) Forecast, by Application 2020 & 2033
- Table 84: Japan APAC Snack Bar Market Volume (K Tons) Forecast, by Application 2020 & 2033
- Table 85: South Korea APAC Snack Bar Market Revenue (Million) Forecast, by Application 2020 & 2033
- Table 86: South Korea APAC Snack Bar Market Volume (K Tons) Forecast, by Application 2020 & 2033
- Table 87: ASEAN APAC Snack Bar Market Revenue (Million) Forecast, by Application 2020 & 2033
- Table 88: ASEAN APAC Snack Bar Market Volume (K Tons) Forecast, by Application 2020 & 2033
- Table 89: Oceania APAC Snack Bar Market Revenue (Million) Forecast, by Application 2020 & 2033
- Table 90: Oceania APAC Snack Bar Market Volume (K Tons) Forecast, by Application 2020 & 2033
- Table 91: Rest of Asia Pacific APAC Snack Bar Market Revenue (Million) Forecast, by Application 2020 & 2033
- Table 92: Rest of Asia Pacific APAC Snack Bar Market Volume (K Tons) Forecast, by Application 2020 & 2033
Frequently Asked Questions
1. What is the projected Compound Annual Growth Rate (CAGR) of the APAC Snack Bar Market?
The projected CAGR is approximately 4.12%.
2. Which companies are prominent players in the APAC Snack Bar Market?
Key companies in the market include Nestlé SA, Post Holdings Inc, Asahi Group Holdings Ltd, Simply Good Foods Co, General Mills Inc, PepsiCo Inc, Lotus Bakeries, Morinaga & Co Ltd, Bagrrys India Private Limited, Carman's Fine Foods Pty Ltd, Ferrero International SA, Naturell India Pvt Ltd, Mars Incorporated, Otsuka Holdings Co Ltd, Mondelēz International Inc, Amway International Inc, Kellogg Company.
3. What are the main segments of the APAC Snack Bar Market?
The market segments include Confectionery Variant, Distribution Channel.
4. Can you provide details about the market size?
The market size is estimated to be USD 26040 Million as of 2022.
5. What are some drivers contributing to market growth?
Popularity of Convenient and On the Go Snacking Options; Product Differentiation Playing a Key Role in Market Expansion.
6. What are the notable trends driving market growth?
Growing awareness regarding health-oriented products is likely to boost the segment’s sales.
7. Are there any restraints impacting market growth?
Associated Health Risks; Easy Availability of Healthy Substitutes.
8. Can you provide examples of recent developments in the market?
May 2023: Nestle’s Milo launched a protein snack bar offering 6 g of protein and a source of fiber. These protein snack bars retail at USD 8 for 180 g or six bars and are available in Coles and independent grocers across Australia.May 2023: Uncle Tobys unveiled a protein muesli bar in four new flavors. The muesli bar is made with 20% protein, i.e., 7 g of protein per bar, comes in multipacks of 5, and can be found in supermarkets for RRP AUD 6.70. The bars are available in flavors like Caramel and Dark Choc, Raspberry, Goji and White Choc, Lemon with a Yoghurty Drizzle, and Double Choc.March 2023: Bagrrys India Private Limited announced the launch of The Mighty Muesli Bars, which are all-natural, healthy, and packed with multi-grains, nuts, fruits, and honey with a punch of high fiber.
9. What pricing options are available for accessing the report?
Pricing options include single-user, multi-user, and enterprise licenses priced at USD 3800, USD 4500, and USD 5800 respectively.
10. Is the market size provided in terms of value or volume?
The market size is provided in terms of value, measured in Million and volume, measured in K Tons.
11. Are there any specific market keywords associated with the report?
Yes, the market keyword associated with the report is "APAC Snack Bar Market," which aids in identifying and referencing the specific market segment covered.
12. How do I determine which pricing option suits my needs best?
The pricing options vary based on user requirements and access needs. Individual users may opt for single-user licenses, while businesses requiring broader access may choose multi-user or enterprise licenses for cost-effective access to the report.
13. Are there any additional resources or data provided in the APAC Snack Bar Market report?
While the report offers comprehensive insights, it's advisable to review the specific contents or supplementary materials provided to ascertain if additional resources or data are available.
14. How can I stay updated on further developments or reports in the APAC Snack Bar Market?
To stay informed about further developments, trends, and reports in the APAC Snack Bar Market, consider subscribing to industry newsletters, following relevant companies and organizations, or regularly checking reputable industry news sources and publications.
Methodology
Step 1 - Identification of Relevant Samples Size from Population Database


Step 2 - Approaches for Defining Global Market Size (Value, Volume* & Price*)

Note*: In applicable scenarios
Step 3 - Data Sources
Primary Research
- Web Analytics
- Survey Reports
- Research Institute
- Latest Research Reports
- Opinion Leaders
Secondary Research
- Annual Reports
- White Paper
- Latest Press Release
- Industry Association
- Paid Database
- Investor Presentations

Step 4 - Data Triangulation
Involves using different sources of information in order to increase the validity of a study
These sources are likely to be stakeholders in a program - participants, other researchers, program staff, other community members, and so on.
Then we put all data in single framework & apply various statistical tools to find out the dynamic on the market.
During the analysis stage, feedback from the stakeholder groups would be compared to determine areas of agreement as well as areas of divergence