

Key Insights
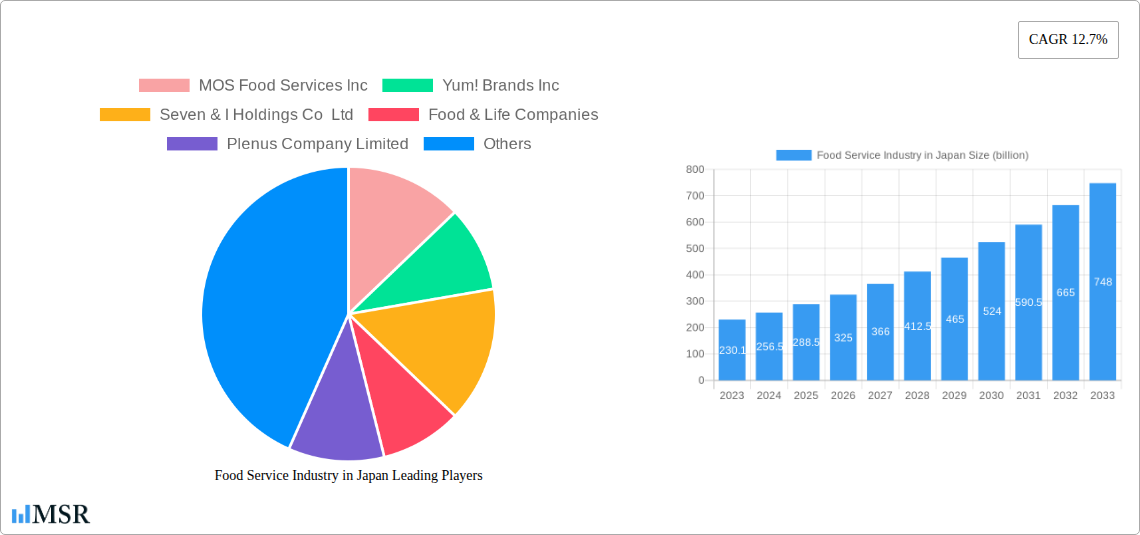
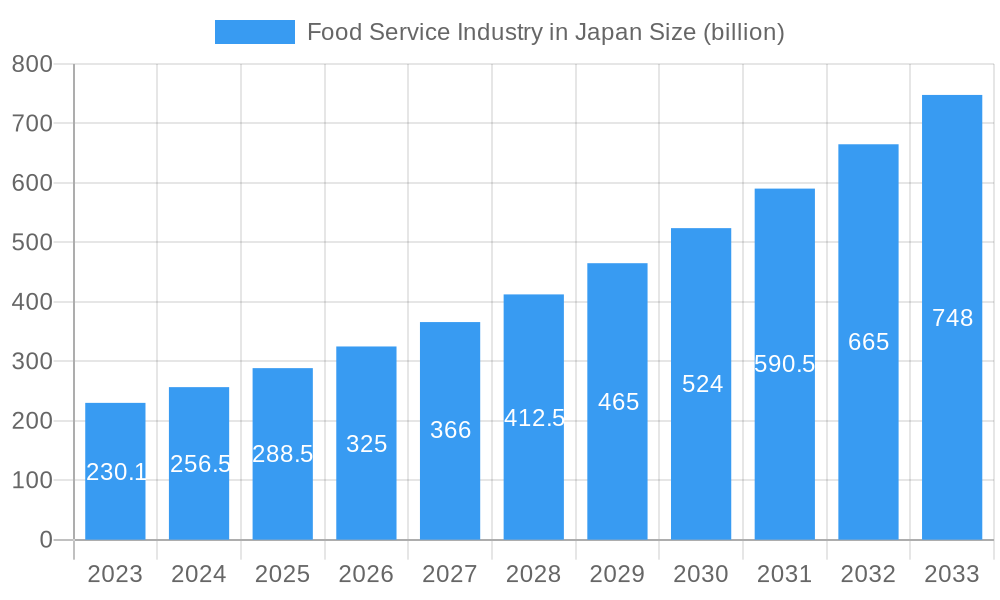
The Japanese food service industry is experiencing robust expansion, projected to reach a substantial market size of $256.5 billion in 2024, with a compelling Compound Annual Growth Rate (CAGR) of 12.7% from 2025 to 2033. This significant growth is underpinned by a confluence of dynamic drivers. Increasing disposable incomes, a growing appetite for diverse culinary experiences, and a thriving tourism sector are fueling demand across various food service segments. The persistent trend of busy lifestyles and a desire for convenience continue to bolster the popularity of Quick Service Restaurants (QSRs) and the innovative model of cloud kitchens. Furthermore, the premiumization of food experiences, with consumers willing to spend more on quality and unique offerings, is driving growth in specialized segments like artisan cafes and bars, and full-service restaurants emphasizing authentic cuisines. Technological advancements, including online ordering platforms and delivery services, have also become integral, enhancing accessibility and broadening the market's reach.
Food Service Industry in Japan Market Size (In Million)
Despite this upward trajectory, certain restraints could temper the pace of growth. A potential shortage of skilled labor within the food service sector, coupled with rising operational costs, including ingredient prices and labor expenses, presents a challenge. Stringent food safety regulations and the ongoing need for compliance also add to operational complexities. However, the industry is demonstrating resilience and adaptability. The diversification of offerings, with a focus on healthier options and plant-based menus, caters to evolving consumer preferences. Innovations in supply chain management and a greater emphasis on sustainability are also emerging trends, positioning the market for continued, albeit potentially moderated, growth. The competitive landscape is characterized by the presence of both large, established international and domestic players, alongside a vibrant ecosystem of independent establishments, all vying for a share of this dynamic market.
Food Service Industry in Japan Company Market Share
Unlock unparalleled insights into Japan's dynamic foodservice industry with this comprehensive report. Spanning 2019-2033, this analysis delves into market concentration, emerging trends, key segments, and leading players shaping a market projected to reach billions. Essential for investors, operators, and strategists seeking to navigate and capitalize on opportunities within one of Asia's most sophisticated food markets.
Food Service Industry in Japan Market Concentration & Dynamics
The Japanese foodservice market exhibits a moderate level of concentration, with a blend of large conglomerates and numerous independent operators. Key players like Seven & I Holdings Co Ltd, McDonald's Corporation, and Yum! Brands Inc command significant market share across Quick Service Restaurants (QSR) and Full Service Restaurants (FSR). Innovation ecosystems are driven by a deep-seated appreciation for quality, convenience, and unique culinary experiences, fostering continuous product development. Regulatory frameworks, while generally supportive of business, emphasize food safety and labor standards, impacting operational costs. Substitute products, ranging from home meal kits to convenience store offerings, exert considerable influence, particularly in price-sensitive segments. End-user trends are increasingly leaning towards healthier options, personalized experiences, and sustainable practices. Mergers and acquisitions (M&A) activities, while not at peak levels, are strategically focused on expanding market reach, acquiring innovative concepts, and consolidating operational efficiencies, with approximately 5-10 significant M&A deals annually within the broader food industry. Market share of leading QSR brands typically ranges from 5-15% within their specific categories.
Food Service Industry in Japan Industry Insights & Trends
Japan's foodservice industry is poised for substantial growth, projected to reach a market size of over $300 billion by the base year 2025, with a Compound Annual Growth Rate (CAGR) of approximately 4-6% during the forecast period of 2025-2033. This expansion is fueled by a confluence of factors, including an increasing demand for convenient dining solutions driven by busy lifestyles, a growing disposable income among certain demographics, and a persistent fascination with international culinary trends. Technological disruptions are reshaping operations, with the adoption of cloud kitchen models, AI-powered ordering systems, and advanced delivery logistics becoming increasingly prevalent. Evolving consumer behaviors are a critical driver; Japanese consumers exhibit a sophisticated palate, prioritizing quality ingredients, unique flavors, and authentic experiences. There's a discernible shift towards health-conscious choices, with a rising interest in plant-based options, reduced sugar content, and functional foods. The lingering effects of demographic shifts, including an aging population and a decline in birth rates, are also influencing menu development and service models, necessitating a focus on accessibility and smaller portion sizes. Furthermore, the enduring appeal of themed dining experiences and celebrity endorsements continues to influence consumer choices, creating niche market opportunities. The historical period (2019-2024) demonstrated resilience and adaptability, with the industry navigating global challenges and emerging with renewed strategies for growth.
Key Markets & Segments Leading Food Service Industry in Japan
The Quick Service Restaurant (QSR) segment, particularly within the Burger and Specialist Coffee & Tea Shops categories, continues to lead the Japanese foodservice industry, driven by convenience, affordability, and widespread accessibility. Chained outlets dominate this space, benefiting from economies of scale and consistent brand recognition, with their market presence extending across all location types, especially Retail and Standalone. The estimated market share for QSR within the overall foodservice landscape is around 35-45%.
Quick Service Restaurants (QSR):
- Burger: This sub-segment is a perennial favorite, with international giants like McDonald's Corporation and domestic players like MOS Food Services Inc consistently innovating to capture consumer attention. The demand for convenient, on-the-go meals underpins its sustained growth.
- Specialist Coffee & Tea Shops: The rise of premium coffee culture and the demand for artisanal tea experiences have propelled this segment. Starbucks Corporation and Komeda Holdings Co Ltd are key players, offering not just beverages but also comfortable spaces for social interaction and work.
- Bakeries: Growing demand for convenient breakfast and snack options contributes to the steady performance of QSR bakeries.
Full Service Restaurants (FSR): While QSR leads in volume, FSR holds significant value, particularly within the Asian cuisine category, reflecting Japan's strong domestic culinary heritage. Food & Life Companies and Skylark Holdings Co Ltd are prominent in this segment, offering diverse dining experiences.
- Asian: Traditional Japanese cuisine, alongside popular Korean and Chinese offerings, remains a cornerstone, appealing to both locals and tourists.
- European: Western-style dining, including Italian and French influences, continues to attract a segment of the population seeking sophisticated culinary experiences.
Cafes & Bars: This broad category encompasses Bars & Pubs and Juice/Smoothie/Desserts Bars, catering to diverse social and lifestyle needs. The trend towards casualization and experiential dining benefits these segments.
Cloud Kitchen: While nascent, the cloud kitchen model is gaining traction, driven by the proliferation of food delivery services. This segment offers significant growth potential by reducing overheads and enabling rapid expansion of delivery-focused brands.
Outlet Type: Chained outlets maintain a dominant presence due to their brand power and operational efficiency. However, independent outlets, often offering unique culinary concepts and personalized service, play a vital role in the market's diversity.
Location: Retail locations, owing to high foot traffic, and Standalone establishments, offering dedicated dining experiences, are key drivers of foodservice sales. Travel hubs also represent significant revenue streams, particularly for convenient F&B options.
Food Service Industry in Japan Product Developments
Recent product developments highlight a focus on innovation and catering to evolving consumer preferences. April 2023 saw McDonald's Corporation's strategic collaboration with the popular anime franchise One Piece, reimagining the Chicken Tatsuta Burger with themed packaging, a move designed to tap into the anime fan base and create buzz. Similarly, KFC's April 2023 launch of a new range of hash brown burgers, including the Karihoku Hash Filet Burger variants, showcases a commitment to offering novel textures and flavors within their core product offerings. Starbucks Corporation, in April 2023, introduced Oleato™, a new coffee drink combining arabica coffee with Partanna® extra virgin olive oil, signaling a trend towards premium, ingredient-focused beverage innovation and a fusion of familiar tastes with novel culinary elements. These developments underscore the industry's proactive approach to product differentiation and market engagement.
Challenges in the Food Service Industry in Japan Market
The Japanese foodservice industry faces several challenges, including a persistent labor shortage, particularly for skilled kitchen and service staff, which drives up labor costs and can impact service quality. Rising ingredient costs, influenced by global supply chain disruptions and currency fluctuations, also pose a significant threat to profit margins. Stringent food safety regulations and evolving consumer demand for healthier options require continuous adaptation and investment in quality control and menu innovation. Intense competition from both domestic and international players, as well as the growing popularity of home-cooked meals and meal delivery services, necessitates a strong value proposition. The aging demographic also presents a unique challenge, requiring adjustments in service models and product offerings to cater to a population with different dietary needs and preferences, potentially impacting overall market volume by 2-3% annually in certain traditional segments.
Forces Driving Food Service Industry in Japan Growth
Several forces are propelling the growth of Japan's foodservice industry. Technological advancements, particularly in delivery platforms, automation, and data analytics, are enhancing operational efficiency and expanding market reach. Economic factors, such as a steady, albeit moderate, economic growth and a desire for premium experiences among affluent consumers, are boosting spending on dining out. Government initiatives promoting tourism and the "Cool Japan" cultural export further drive demand from both international visitors and domestic consumers seeking authentic experiences. The increasing urbanization of Japan leads to higher population density in key areas, creating concentrated demand for convenient and diverse foodservice options.
Challenges in the Food Service Industry in Japan Market
Long-term growth catalysts for the Japanese foodservice industry lie in sustained innovation and strategic market expansions. The continued development of unique and high-quality culinary experiences, drawing inspiration from both traditional Japanese flavors and global trends, will be crucial. Embracing sustainable practices, from sourcing to waste reduction, is becoming an increasingly important factor for consumer loyalty and brand reputation. Furthermore, strategic partnerships and the exploration of new business models, such as the integration of technology into customer loyalty programs and personalized marketing, will unlock further growth potential. The industry's ability to adapt to demographic shifts by offering specialized products and services, such as convenient and healthy options for the elderly, will also be a key long-term driver.
Emerging Opportunities in Food Service Industry in Japan
Emerging opportunities within Japan's foodservice sector are abundant, driven by evolving consumer preferences and technological integration. The burgeoning demand for plant-based and health-focused dining presents a significant avenue for growth, with numerous outlets exploring vegan, vegetarian, and low-calorie menu options. The continued expansion of the delivery and takeaway market, accelerated by cloud kitchens and advanced logistics, offers a substantial opportunity for brands to reach wider customer bases with reduced overhead. Experiential dining, including themed restaurants, pop-up events, and interactive culinary experiences, caters to consumers seeking memorable occasions. Furthermore, niche markets like specialized dietary needs (e.g., gluten-free, allergen-friendly) and gourmet convenience foods are poised for growth as consumer awareness and demand increase.
Leading Players in the Food Service Industry in Japan Sector
- MOS Food Services Inc
- Yum! Brands Inc
- Seven & I Holdings Co Ltd
- Food & Life Companies
- Plenus Company Limited
- Kura Sushi Inc
- Toridoll Holdings Corporation
- Skylark Holdings Co Ltd
- Lotteria Co Ltd
- Komeda Holdings Co Ltd
- Domino’s Pizza Enterprises Ltd
- Starbucks Corporation
- Colowide Co Ltd
- Yoshinoya Holdings Co Ltd
- McDonald's Corporation
- Zensho Holding
Key Milestones in Food Service Industry in Japan Industry
- April 2023: McDonald's Corporation partnered with One Piece, a Japanese anime franchise, to launch a newer version of the burger, i.e., the Chicken Tatsuta Burger. The packaging has been themed with One Piece imagery, enhancing brand engagement with a specific consumer demographic.
- April 2023: KFC launched a range of hash brown burgers available nationwide, including Karihoku Hash Filet Burger, Karihoku Hash Filet BBQ Burger, and Karihoku Hash Filet Spicy Burger, introducing new flavor profiles and textures to its menu.
- April 2023: In Japan, Starbucks introduced a new type of coffee drink called Oleato™, consisting of arabica coffee and Partanna® extra virgin olive oil, signaling a move towards premium, ingredient-focused beverage innovation and a fusion of culinary concepts.
Strategic Outlook for Food Service Industry in Japan Market
The strategic outlook for Japan's foodservice market is characterized by a strong emphasis on adapting to evolving consumer demands for health, convenience, and unique experiences. Growth accelerators will include the continued integration of technology for enhanced operational efficiency and personalized customer engagement, particularly within delivery and online ordering platforms. Investments in sustainable practices, from sourcing to waste management, will be critical for long-term brand value and consumer loyalty. Furthermore, exploring niche market segments, such as specialized dietary needs and premium convenience foods, alongside potential M&A activities for market consolidation and concept acquisition, will be pivotal. The industry is poised for sustained growth driven by innovation, strategic partnerships, and a deep understanding of the sophisticated Japanese consumer.
Food Service Industry in Japan Segmentation
-
1. Foodservice Type
-
1.1. Cafes & Bars
-
1.1.1. By Cuisine
- 1.1.1.1. Bars & Pubs
- 1.1.1.2. Juice/Smoothie/Desserts Bars
- 1.1.1.3. Specialist Coffee & Tea Shops
-
1.1.1. By Cuisine
- 1.2. Cloud Kitchen
-
1.3. Full Service Restaurants
- 1.3.1. Asian
- 1.3.2. European
- 1.3.3. Latin American
- 1.3.4. Middle Eastern
- 1.3.5. North American
- 1.3.6. Other FSR Cuisines
-
1.4. Quick Service Restaurants
- 1.4.1. Bakeries
- 1.4.2. Burger
- 1.4.3. Ice Cream
- 1.4.4. Meat-based Cuisines
- 1.4.5. Pizza
- 1.4.6. Other QSR Cuisines
-
1.1. Cafes & Bars
-
2. Outlet
- 2.1. Chained Outlets
- 2.2. Independent Outlets
-
3. Location
- 3.1. Leisure
- 3.2. Lodging
- 3.3. Retail
- 3.4. Standalone
- 3.5. Travel
Food Service Industry in Japan Segmentation By Geography
-
1. North America
- 1.1. United States
- 1.2. Canada
- 1.3. Mexico
-
2. South America
- 2.1. Brazil
- 2.2. Argentina
- 2.3. Rest of South America
-
3. Europe
- 3.1. United Kingdom
- 3.2. Germany
- 3.3. France
- 3.4. Italy
- 3.5. Spain
- 3.6. Russia
- 3.7. Benelux
- 3.8. Nordics
- 3.9. Rest of Europe
-
4. Middle East & Africa
- 4.1. Turkey
- 4.2. Israel
- 4.3. GCC
- 4.4. North Africa
- 4.5. South Africa
- 4.6. Rest of Middle East & Africa
-
5. Asia Pacific
- 5.1. China
- 5.2. India
- 5.3. Japan
- 5.4. South Korea
- 5.5. ASEAN
- 5.6. Oceania
- 5.7. Rest of Asia Pacific
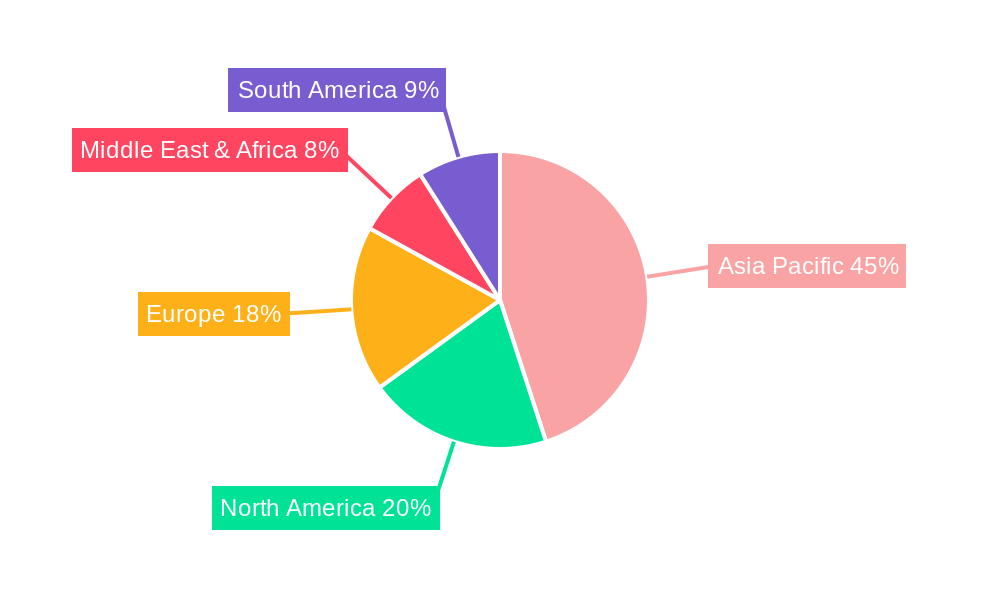
Food Service Industry in Japan Regional Market Share
Geographic Coverage of Food Service Industry in Japan
Food Service Industry in Japan REPORT HIGHLIGHTS
| Aspects | Details |
|---|---|
| Study Period | 2020-2034 |
| Base Year | 2025 |
| Estimated Year | 2026 |
| Forecast Period | 2026-2034 |
| Historical Period | 2020-2025 |
| Growth Rate | CAGR of 12.7% from 2020-2034 |
| Segmentation |
|
Table of Contents
- 1. Introduction
- 1.1. Research Scope
- 1.2. Market Segmentation
- 1.3. Research Objective
- 1.4. Definitions and Assumptions
- 2. Executive Summary
- 2.1. Market Snapshot
- 3. Market Dynamics
- 3.1. Market Drivers
- 3.2. Market Restrains
- 3.3. Market Trends
- 3.4. Market Opportunities
- 4. Market Factor Analysis
- 4.1. Porters Five Forces
- 4.1.1. Bargaining Power of Suppliers
- 4.1.2. Bargaining Power of Buyers
- 4.1.3. Threat of New Entrants
- 4.1.4. Threat of Substitutes
- 4.1.5. Competitive Rivalry
- 4.2. PESTEL analysis
- 4.3. BCG Analysis
- 4.3.1. Stars (High Growth, High Market Share)
- 4.3.2. Cash Cows (Low Growth, High Market Share)
- 4.3.3. Question Mark (High Growth, Low Market Share)
- 4.3.4. Dogs (Low Growth, Low Market Share)
- 4.4. Ansoff Matrix Analysis
- 4.5. Supply Chain Analysis
- 4.6. Regulatory Landscape
- 4.7. Current Market Potential and Opportunity Assessment (TAM–SAM–SOM Framework)
- 4.8. MSR Analyst Note
- 4.1. Porters Five Forces
- 5. Market Analysis, Insights and Forecast 2021-2033
- 5.1. Market Analysis, Insights and Forecast - by Foodservice Type
- 5.1.1. Cafes & Bars
- 5.1.1.1. By Cuisine
- 5.1.1.1.1. Bars & Pubs
- 5.1.1.1.2. Juice/Smoothie/Desserts Bars
- 5.1.1.1.3. Specialist Coffee & Tea Shops
- 5.1.1.1. By Cuisine
- 5.1.2. Cloud Kitchen
- 5.1.3. Full Service Restaurants
- 5.1.3.1. Asian
- 5.1.3.2. European
- 5.1.3.3. Latin American
- 5.1.3.4. Middle Eastern
- 5.1.3.5. North American
- 5.1.3.6. Other FSR Cuisines
- 5.1.4. Quick Service Restaurants
- 5.1.4.1. Bakeries
- 5.1.4.2. Burger
- 5.1.4.3. Ice Cream
- 5.1.4.4. Meat-based Cuisines
- 5.1.4.5. Pizza
- 5.1.4.6. Other QSR Cuisines
- 5.1.1. Cafes & Bars
- 5.2. Market Analysis, Insights and Forecast - by Outlet
- 5.2.1. Chained Outlets
- 5.2.2. Independent Outlets
- 5.3. Market Analysis, Insights and Forecast - by Location
- 5.3.1. Leisure
- 5.3.2. Lodging
- 5.3.3. Retail
- 5.3.4. Standalone
- 5.3.5. Travel
- 5.4. Market Analysis, Insights and Forecast - by Region
- 5.4.1. North America
- 5.4.2. South America
- 5.4.3. Europe
- 5.4.4. Middle East & Africa
- 5.4.5. Asia Pacific
- 5.1. Market Analysis, Insights and Forecast - by Foodservice Type
- 6. Global Food Service Industry in Japan Analysis, Insights and Forecast, 2021-2033
- 6.1. Market Analysis, Insights and Forecast - by Foodservice Type
- 6.1.1. Cafes & Bars
- 6.1.1.1. By Cuisine
- 6.1.1.1.1. Bars & Pubs
- 6.1.1.1.2. Juice/Smoothie/Desserts Bars
- 6.1.1.1.3. Specialist Coffee & Tea Shops
- 6.1.1.1. By Cuisine
- 6.1.2. Cloud Kitchen
- 6.1.3. Full Service Restaurants
- 6.1.3.1. Asian
- 6.1.3.2. European
- 6.1.3.3. Latin American
- 6.1.3.4. Middle Eastern
- 6.1.3.5. North American
- 6.1.3.6. Other FSR Cuisines
- 6.1.4. Quick Service Restaurants
- 6.1.4.1. Bakeries
- 6.1.4.2. Burger
- 6.1.4.3. Ice Cream
- 6.1.4.4. Meat-based Cuisines
- 6.1.4.5. Pizza
- 6.1.4.6. Other QSR Cuisines
- 6.1.1. Cafes & Bars
- 6.2. Market Analysis, Insights and Forecast - by Outlet
- 6.2.1. Chained Outlets
- 6.2.2. Independent Outlets
- 6.3. Market Analysis, Insights and Forecast - by Location
- 6.3.1. Leisure
- 6.3.2. Lodging
- 6.3.3. Retail
- 6.3.4. Standalone
- 6.3.5. Travel
- 6.1. Market Analysis, Insights and Forecast - by Foodservice Type
- 7. North America Food Service Industry in Japan Analysis, Insights and Forecast, 2020-2032
- 7.1. Market Analysis, Insights and Forecast - by Foodservice Type
- 7.1.1. Cafes & Bars
- 7.1.1.1. By Cuisine
- 7.1.1.1.1. Bars & Pubs
- 7.1.1.1.2. Juice/Smoothie/Desserts Bars
- 7.1.1.1.3. Specialist Coffee & Tea Shops
- 7.1.1.1. By Cuisine
- 7.1.2. Cloud Kitchen
- 7.1.3. Full Service Restaurants
- 7.1.3.1. Asian
- 7.1.3.2. European
- 7.1.3.3. Latin American
- 7.1.3.4. Middle Eastern
- 7.1.3.5. North American
- 7.1.3.6. Other FSR Cuisines
- 7.1.4. Quick Service Restaurants
- 7.1.4.1. Bakeries
- 7.1.4.2. Burger
- 7.1.4.3. Ice Cream
- 7.1.4.4. Meat-based Cuisines
- 7.1.4.5. Pizza
- 7.1.4.6. Other QSR Cuisines
- 7.1.1. Cafes & Bars
- 7.2. Market Analysis, Insights and Forecast - by Outlet
- 7.2.1. Chained Outlets
- 7.2.2. Independent Outlets
- 7.3. Market Analysis, Insights and Forecast - by Location
- 7.3.1. Leisure
- 7.3.2. Lodging
- 7.3.3. Retail
- 7.3.4. Standalone
- 7.3.5. Travel
- 7.1. Market Analysis, Insights and Forecast - by Foodservice Type
- 8. South America Food Service Industry in Japan Analysis, Insights and Forecast, 2020-2032
- 8.1. Market Analysis, Insights and Forecast - by Foodservice Type
- 8.1.1. Cafes & Bars
- 8.1.1.1. By Cuisine
- 8.1.1.1.1. Bars & Pubs
- 8.1.1.1.2. Juice/Smoothie/Desserts Bars
- 8.1.1.1.3. Specialist Coffee & Tea Shops
- 8.1.1.1. By Cuisine
- 8.1.2. Cloud Kitchen
- 8.1.3. Full Service Restaurants
- 8.1.3.1. Asian
- 8.1.3.2. European
- 8.1.3.3. Latin American
- 8.1.3.4. Middle Eastern
- 8.1.3.5. North American
- 8.1.3.6. Other FSR Cuisines
- 8.1.4. Quick Service Restaurants
- 8.1.4.1. Bakeries
- 8.1.4.2. Burger
- 8.1.4.3. Ice Cream
- 8.1.4.4. Meat-based Cuisines
- 8.1.4.5. Pizza
- 8.1.4.6. Other QSR Cuisines
- 8.1.1. Cafes & Bars
- 8.2. Market Analysis, Insights and Forecast - by Outlet
- 8.2.1. Chained Outlets
- 8.2.2. Independent Outlets
- 8.3. Market Analysis, Insights and Forecast - by Location
- 8.3.1. Leisure
- 8.3.2. Lodging
- 8.3.3. Retail
- 8.3.4. Standalone
- 8.3.5. Travel
- 8.1. Market Analysis, Insights and Forecast - by Foodservice Type
- 9. Europe Food Service Industry in Japan Analysis, Insights and Forecast, 2020-2032
- 9.1. Market Analysis, Insights and Forecast - by Foodservice Type
- 9.1.1. Cafes & Bars
- 9.1.1.1. By Cuisine
- 9.1.1.1.1. Bars & Pubs
- 9.1.1.1.2. Juice/Smoothie/Desserts Bars
- 9.1.1.1.3. Specialist Coffee & Tea Shops
- 9.1.1.1. By Cuisine
- 9.1.2. Cloud Kitchen
- 9.1.3. Full Service Restaurants
- 9.1.3.1. Asian
- 9.1.3.2. European
- 9.1.3.3. Latin American
- 9.1.3.4. Middle Eastern
- 9.1.3.5. North American
- 9.1.3.6. Other FSR Cuisines
- 9.1.4. Quick Service Restaurants
- 9.1.4.1. Bakeries
- 9.1.4.2. Burger
- 9.1.4.3. Ice Cream
- 9.1.4.4. Meat-based Cuisines
- 9.1.4.5. Pizza
- 9.1.4.6. Other QSR Cuisines
- 9.1.1. Cafes & Bars
- 9.2. Market Analysis, Insights and Forecast - by Outlet
- 9.2.1. Chained Outlets
- 9.2.2. Independent Outlets
- 9.3. Market Analysis, Insights and Forecast - by Location
- 9.3.1. Leisure
- 9.3.2. Lodging
- 9.3.3. Retail
- 9.3.4. Standalone
- 9.3.5. Travel
- 9.1. Market Analysis, Insights and Forecast - by Foodservice Type
- 10. Middle East & Africa Food Service Industry in Japan Analysis, Insights and Forecast, 2020-2032
- 10.1. Market Analysis, Insights and Forecast - by Foodservice Type
- 10.1.1. Cafes & Bars
- 10.1.1.1. By Cuisine
- 10.1.1.1.1. Bars & Pubs
- 10.1.1.1.2. Juice/Smoothie/Desserts Bars
- 10.1.1.1.3. Specialist Coffee & Tea Shops
- 10.1.1.1. By Cuisine
- 10.1.2. Cloud Kitchen
- 10.1.3. Full Service Restaurants
- 10.1.3.1. Asian
- 10.1.3.2. European
- 10.1.3.3. Latin American
- 10.1.3.4. Middle Eastern
- 10.1.3.5. North American
- 10.1.3.6. Other FSR Cuisines
- 10.1.4. Quick Service Restaurants
- 10.1.4.1. Bakeries
- 10.1.4.2. Burger
- 10.1.4.3. Ice Cream
- 10.1.4.4. Meat-based Cuisines
- 10.1.4.5. Pizza
- 10.1.4.6. Other QSR Cuisines
- 10.1.1. Cafes & Bars
- 10.2. Market Analysis, Insights and Forecast - by Outlet
- 10.2.1. Chained Outlets
- 10.2.2. Independent Outlets
- 10.3. Market Analysis, Insights and Forecast - by Location
- 10.3.1. Leisure
- 10.3.2. Lodging
- 10.3.3. Retail
- 10.3.4. Standalone
- 10.3.5. Travel
- 10.1. Market Analysis, Insights and Forecast - by Foodservice Type
- 11. Asia Pacific Food Service Industry in Japan Analysis, Insights and Forecast, 2020-2032
- 11.1. Market Analysis, Insights and Forecast - by Foodservice Type
- 11.1.1. Cafes & Bars
- 11.1.1.1. By Cuisine
- 11.1.1.1.1. Bars & Pubs
- 11.1.1.1.2. Juice/Smoothie/Desserts Bars
- 11.1.1.1.3. Specialist Coffee & Tea Shops
- 11.1.1.1. By Cuisine
- 11.1.2. Cloud Kitchen
- 11.1.3. Full Service Restaurants
- 11.1.3.1. Asian
- 11.1.3.2. European
- 11.1.3.3. Latin American
- 11.1.3.4. Middle Eastern
- 11.1.3.5. North American
- 11.1.3.6. Other FSR Cuisines
- 11.1.4. Quick Service Restaurants
- 11.1.4.1. Bakeries
- 11.1.4.2. Burger
- 11.1.4.3. Ice Cream
- 11.1.4.4. Meat-based Cuisines
- 11.1.4.5. Pizza
- 11.1.4.6. Other QSR Cuisines
- 11.1.1. Cafes & Bars
- 11.2. Market Analysis, Insights and Forecast - by Outlet
- 11.2.1. Chained Outlets
- 11.2.2. Independent Outlets
- 11.3. Market Analysis, Insights and Forecast - by Location
- 11.3.1. Leisure
- 11.3.2. Lodging
- 11.3.3. Retail
- 11.3.4. Standalone
- 11.3.5. Travel
- 11.1. Market Analysis, Insights and Forecast - by Foodservice Type
- 12. Competitive Analysis
- 12.1. Company Profiles
- 12.1.1 MOS Food Services Inc
- 12.1.1.1. Company Overview
- 12.1.1.2. Products
- 12.1.1.3. Company Financials
- 12.1.1.4. SWOT Analysis
- 12.1.2 Yum! Brands Inc
- 12.1.2.1. Company Overview
- 12.1.2.2. Products
- 12.1.2.3. Company Financials
- 12.1.2.4. SWOT Analysis
- 12.1.3 Seven & I Holdings Co Ltd
- 12.1.3.1. Company Overview
- 12.1.3.2. Products
- 12.1.3.3. Company Financials
- 12.1.3.4. SWOT Analysis
- 12.1.4 Food & Life Companies
- 12.1.4.1. Company Overview
- 12.1.4.2. Products
- 12.1.4.3. Company Financials
- 12.1.4.4. SWOT Analysis
- 12.1.5 Plenus Company Limited
- 12.1.5.1. Company Overview
- 12.1.5.2. Products
- 12.1.5.3. Company Financials
- 12.1.5.4. SWOT Analysis
- 12.1.6 Kura Sushi Inc
- 12.1.6.1. Company Overview
- 12.1.6.2. Products
- 12.1.6.3. Company Financials
- 12.1.6.4. SWOT Analysis
- 12.1.7 Toridoll Holdings Corporation
- 12.1.7.1. Company Overview
- 12.1.7.2. Products
- 12.1.7.3. Company Financials
- 12.1.7.4. SWOT Analysis
- 12.1.8 Skylark Holdings Co Ltd
- 12.1.8.1. Company Overview
- 12.1.8.2. Products
- 12.1.8.3. Company Financials
- 12.1.8.4. SWOT Analysis
- 12.1.9 Lotteria Co Ltd
- 12.1.9.1. Company Overview
- 12.1.9.2. Products
- 12.1.9.3. Company Financials
- 12.1.9.4. SWOT Analysis
- 12.1.10 Komeda Holdings Co Ltd
- 12.1.10.1. Company Overview
- 12.1.10.2. Products
- 12.1.10.3. Company Financials
- 12.1.10.4. SWOT Analysis
- 12.1.11 Domino’s Pizza Enterprises Ltd
- 12.1.11.1. Company Overview
- 12.1.11.2. Products
- 12.1.11.3. Company Financials
- 12.1.11.4. SWOT Analysis
- 12.1.12 Starbucks Corporation
- 12.1.12.1. Company Overview
- 12.1.12.2. Products
- 12.1.12.3. Company Financials
- 12.1.12.4. SWOT Analysis
- 12.1.13 Colowide Co Ltd
- 12.1.13.1. Company Overview
- 12.1.13.2. Products
- 12.1.13.3. Company Financials
- 12.1.13.4. SWOT Analysis
- 12.1.14 Yoshinoya Holdings Co Ltd
- 12.1.14.1. Company Overview
- 12.1.14.2. Products
- 12.1.14.3. Company Financials
- 12.1.14.4. SWOT Analysis
- 12.1.15 McDonald's Corporation
- 12.1.15.1. Company Overview
- 12.1.15.2. Products
- 12.1.15.3. Company Financials
- 12.1.15.4. SWOT Analysis
- 12.1.16 Zensho Holding
- 12.1.16.1. Company Overview
- 12.1.16.2. Products
- 12.1.16.3. Company Financials
- 12.1.16.4. SWOT Analysis
- 12.1.1 MOS Food Services Inc
- 12.2. Market Entropy
- 12.2.1 Company's Key Areas Served
- 12.2.2 Recent Developments
- 12.3. Company Market Share Analysis 2025
- 12.3.1 Top 5 Companies Market Share Analysis
- 12.3.2 Top 3 Companies Market Share Analysis
- 12.4. List of Potential Customers
- 13. Research Methodology
List of Figures
- Figure 1: Global Food Service Industry in Japan Revenue Breakdown (billion, %) by Region 2025 & 2033
- Figure 2: North America Food Service Industry in Japan Revenue (billion), by Foodservice Type 2025 & 2033
- Figure 3: North America Food Service Industry in Japan Revenue Share (%), by Foodservice Type 2025 & 2033
- Figure 4: North America Food Service Industry in Japan Revenue (billion), by Outlet 2025 & 2033
- Figure 5: North America Food Service Industry in Japan Revenue Share (%), by Outlet 2025 & 2033
- Figure 6: North America Food Service Industry in Japan Revenue (billion), by Location 2025 & 2033
- Figure 7: North America Food Service Industry in Japan Revenue Share (%), by Location 2025 & 2033
- Figure 8: North America Food Service Industry in Japan Revenue (billion), by Country 2025 & 2033
- Figure 9: North America Food Service Industry in Japan Revenue Share (%), by Country 2025 & 2033
- Figure 10: South America Food Service Industry in Japan Revenue (billion), by Foodservice Type 2025 & 2033
- Figure 11: South America Food Service Industry in Japan Revenue Share (%), by Foodservice Type 2025 & 2033
- Figure 12: South America Food Service Industry in Japan Revenue (billion), by Outlet 2025 & 2033
- Figure 13: South America Food Service Industry in Japan Revenue Share (%), by Outlet 2025 & 2033
- Figure 14: South America Food Service Industry in Japan Revenue (billion), by Location 2025 & 2033
- Figure 15: South America Food Service Industry in Japan Revenue Share (%), by Location 2025 & 2033
- Figure 16: South America Food Service Industry in Japan Revenue (billion), by Country 2025 & 2033
- Figure 17: South America Food Service Industry in Japan Revenue Share (%), by Country 2025 & 2033
- Figure 18: Europe Food Service Industry in Japan Revenue (billion), by Foodservice Type 2025 & 2033
- Figure 19: Europe Food Service Industry in Japan Revenue Share (%), by Foodservice Type 2025 & 2033
- Figure 20: Europe Food Service Industry in Japan Revenue (billion), by Outlet 2025 & 2033
- Figure 21: Europe Food Service Industry in Japan Revenue Share (%), by Outlet 2025 & 2033
- Figure 22: Europe Food Service Industry in Japan Revenue (billion), by Location 2025 & 2033
- Figure 23: Europe Food Service Industry in Japan Revenue Share (%), by Location 2025 & 2033
- Figure 24: Europe Food Service Industry in Japan Revenue (billion), by Country 2025 & 2033
- Figure 25: Europe Food Service Industry in Japan Revenue Share (%), by Country 2025 & 2033
- Figure 26: Middle East & Africa Food Service Industry in Japan Revenue (billion), by Foodservice Type 2025 & 2033
- Figure 27: Middle East & Africa Food Service Industry in Japan Revenue Share (%), by Foodservice Type 2025 & 2033
- Figure 28: Middle East & Africa Food Service Industry in Japan Revenue (billion), by Outlet 2025 & 2033
- Figure 29: Middle East & Africa Food Service Industry in Japan Revenue Share (%), by Outlet 2025 & 2033
- Figure 30: Middle East & Africa Food Service Industry in Japan Revenue (billion), by Location 2025 & 2033
- Figure 31: Middle East & Africa Food Service Industry in Japan Revenue Share (%), by Location 2025 & 2033
- Figure 32: Middle East & Africa Food Service Industry in Japan Revenue (billion), by Country 2025 & 2033
- Figure 33: Middle East & Africa Food Service Industry in Japan Revenue Share (%), by Country 2025 & 2033
- Figure 34: Asia Pacific Food Service Industry in Japan Revenue (billion), by Foodservice Type 2025 & 2033
- Figure 35: Asia Pacific Food Service Industry in Japan Revenue Share (%), by Foodservice Type 2025 & 2033
- Figure 36: Asia Pacific Food Service Industry in Japan Revenue (billion), by Outlet 2025 & 2033
- Figure 37: Asia Pacific Food Service Industry in Japan Revenue Share (%), by Outlet 2025 & 2033
- Figure 38: Asia Pacific Food Service Industry in Japan Revenue (billion), by Location 2025 & 2033
- Figure 39: Asia Pacific Food Service Industry in Japan Revenue Share (%), by Location 2025 & 2033
- Figure 40: Asia Pacific Food Service Industry in Japan Revenue (billion), by Country 2025 & 2033
- Figure 41: Asia Pacific Food Service Industry in Japan Revenue Share (%), by Country 2025 & 2033
List of Tables
- Table 1: Global Food Service Industry in Japan Revenue billion Forecast, by Foodservice Type 2020 & 2033
- Table 2: Global Food Service Industry in Japan Revenue billion Forecast, by Outlet 2020 & 2033
- Table 3: Global Food Service Industry in Japan Revenue billion Forecast, by Location 2020 & 2033
- Table 4: Global Food Service Industry in Japan Revenue billion Forecast, by Region 2020 & 2033
- Table 5: Global Food Service Industry in Japan Revenue billion Forecast, by Foodservice Type 2020 & 2033
- Table 6: Global Food Service Industry in Japan Revenue billion Forecast, by Outlet 2020 & 2033
- Table 7: Global Food Service Industry in Japan Revenue billion Forecast, by Location 2020 & 2033
- Table 8: Global Food Service Industry in Japan Revenue billion Forecast, by Country 2020 & 2033
- Table 9: United States Food Service Industry in Japan Revenue (billion) Forecast, by Application 2020 & 2033
- Table 10: Canada Food Service Industry in Japan Revenue (billion) Forecast, by Application 2020 & 2033
- Table 11: Mexico Food Service Industry in Japan Revenue (billion) Forecast, by Application 2020 & 2033
- Table 12: Global Food Service Industry in Japan Revenue billion Forecast, by Foodservice Type 2020 & 2033
- Table 13: Global Food Service Industry in Japan Revenue billion Forecast, by Outlet 2020 & 2033
- Table 14: Global Food Service Industry in Japan Revenue billion Forecast, by Location 2020 & 2033
- Table 15: Global Food Service Industry in Japan Revenue billion Forecast, by Country 2020 & 2033
- Table 16: Brazil Food Service Industry in Japan Revenue (billion) Forecast, by Application 2020 & 2033
- Table 17: Argentina Food Service Industry in Japan Revenue (billion) Forecast, by Application 2020 & 2033
- Table 18: Rest of South America Food Service Industry in Japan Revenue (billion) Forecast, by Application 2020 & 2033
- Table 19: Global Food Service Industry in Japan Revenue billion Forecast, by Foodservice Type 2020 & 2033
- Table 20: Global Food Service Industry in Japan Revenue billion Forecast, by Outlet 2020 & 2033
- Table 21: Global Food Service Industry in Japan Revenue billion Forecast, by Location 2020 & 2033
- Table 22: Global Food Service Industry in Japan Revenue billion Forecast, by Country 2020 & 2033
- Table 23: United Kingdom Food Service Industry in Japan Revenue (billion) Forecast, by Application 2020 & 2033
- Table 24: Germany Food Service Industry in Japan Revenue (billion) Forecast, by Application 2020 & 2033
- Table 25: France Food Service Industry in Japan Revenue (billion) Forecast, by Application 2020 & 2033
- Table 26: Italy Food Service Industry in Japan Revenue (billion) Forecast, by Application 2020 & 2033
- Table 27: Spain Food Service Industry in Japan Revenue (billion) Forecast, by Application 2020 & 2033
- Table 28: Russia Food Service Industry in Japan Revenue (billion) Forecast, by Application 2020 & 2033
- Table 29: Benelux Food Service Industry in Japan Revenue (billion) Forecast, by Application 2020 & 2033
- Table 30: Nordics Food Service Industry in Japan Revenue (billion) Forecast, by Application 2020 & 2033
- Table 31: Rest of Europe Food Service Industry in Japan Revenue (billion) Forecast, by Application 2020 & 2033
- Table 32: Global Food Service Industry in Japan Revenue billion Forecast, by Foodservice Type 2020 & 2033
- Table 33: Global Food Service Industry in Japan Revenue billion Forecast, by Outlet 2020 & 2033
- Table 34: Global Food Service Industry in Japan Revenue billion Forecast, by Location 2020 & 2033
- Table 35: Global Food Service Industry in Japan Revenue billion Forecast, by Country 2020 & 2033
- Table 36: Turkey Food Service Industry in Japan Revenue (billion) Forecast, by Application 2020 & 2033
- Table 37: Israel Food Service Industry in Japan Revenue (billion) Forecast, by Application 2020 & 2033
- Table 38: GCC Food Service Industry in Japan Revenue (billion) Forecast, by Application 2020 & 2033
- Table 39: North Africa Food Service Industry in Japan Revenue (billion) Forecast, by Application 2020 & 2033
- Table 40: South Africa Food Service Industry in Japan Revenue (billion) Forecast, by Application 2020 & 2033
- Table 41: Rest of Middle East & Africa Food Service Industry in Japan Revenue (billion) Forecast, by Application 2020 & 2033
- Table 42: Global Food Service Industry in Japan Revenue billion Forecast, by Foodservice Type 2020 & 2033
- Table 43: Global Food Service Industry in Japan Revenue billion Forecast, by Outlet 2020 & 2033
- Table 44: Global Food Service Industry in Japan Revenue billion Forecast, by Location 2020 & 2033
- Table 45: Global Food Service Industry in Japan Revenue billion Forecast, by Country 2020 & 2033
- Table 46: China Food Service Industry in Japan Revenue (billion) Forecast, by Application 2020 & 2033
- Table 47: India Food Service Industry in Japan Revenue (billion) Forecast, by Application 2020 & 2033
- Table 48: Japan Food Service Industry in Japan Revenue (billion) Forecast, by Application 2020 & 2033
- Table 49: South Korea Food Service Industry in Japan Revenue (billion) Forecast, by Application 2020 & 2033
- Table 50: ASEAN Food Service Industry in Japan Revenue (billion) Forecast, by Application 2020 & 2033
- Table 51: Oceania Food Service Industry in Japan Revenue (billion) Forecast, by Application 2020 & 2033
- Table 52: Rest of Asia Pacific Food Service Industry in Japan Revenue (billion) Forecast, by Application 2020 & 2033
Frequently Asked Questions
1. What is the projected Compound Annual Growth Rate (CAGR) of the Food Service Industry in Japan?
The projected CAGR is approximately 12.7%.
2. Which companies are prominent players in the Food Service Industry in Japan?
Key companies in the market include MOS Food Services Inc, Yum! Brands Inc, Seven & I Holdings Co Ltd, Food & Life Companies, Plenus Company Limited, Kura Sushi Inc, Toridoll Holdings Corporation, Skylark Holdings Co Ltd, Lotteria Co Ltd, Komeda Holdings Co Ltd, Domino’s Pizza Enterprises Ltd, Starbucks Corporation, Colowide Co Ltd, Yoshinoya Holdings Co Ltd, McDonald's Corporation, Zensho Holding.
3. What are the main segments of the Food Service Industry in Japan?
The market segments include Foodservice Type, Outlet, Location.
4. Can you provide details about the market size?
The market size is estimated to be USD 256.5 billion as of 2022.
5. What are some drivers contributing to market growth?
Rising Health Consciousness among consumer.
6. What are the notable trends driving market growth?
Quick service restaurants held the major share in the market due to the constant launch of new products.
7. Are there any restraints impacting market growth?
High Cost of natural Ingredients.
8. Can you provide examples of recent developments in the market?
April 2023: McDonald's Corporation partnered with One Piece, a Japanese anime franchise, to launch a newer version of the burger, i.e., the Chicken Tatsuta Burger. The packaging has been themed with One Piece imagery.April 2023: KFC launched a range of hash brown burgers available nationwide, including Karihoku Hash Filet Burger, Karihoku Hash Filet BBQ Burger, and Karihoku Hash Filet Spicy Burger.April 2023: In Japan, Starbucks introduced a new type of coffee drink called Oleato™, consisting of arabica coffee and Partanna® extra virgin olive oil.
9. What pricing options are available for accessing the report?
Pricing options include single-user, multi-user, and enterprise licenses priced at USD 3800, USD 4500, and USD 5800 respectively.
10. Is the market size provided in terms of value or volume?
The market size is provided in terms of value, measured in billion.
11. Are there any specific market keywords associated with the report?
Yes, the market keyword associated with the report is "Food Service Industry in Japan," which aids in identifying and referencing the specific market segment covered.
12. How do I determine which pricing option suits my needs best?
The pricing options vary based on user requirements and access needs. Individual users may opt for single-user licenses, while businesses requiring broader access may choose multi-user or enterprise licenses for cost-effective access to the report.
13. Are there any additional resources or data provided in the Food Service Industry in Japan report?
While the report offers comprehensive insights, it's advisable to review the specific contents or supplementary materials provided to ascertain if additional resources or data are available.
14. How can I stay updated on further developments or reports in the Food Service Industry in Japan?
To stay informed about further developments, trends, and reports in the Food Service Industry in Japan, consider subscribing to industry newsletters, following relevant companies and organizations, or regularly checking reputable industry news sources and publications.
Methodology
Step 1 - Identification of Relevant Samples Size from Population Database


Step 2 - Approaches for Defining Global Market Size (Value, Volume* & Price*)

Note*: In applicable scenarios
Step 3 - Data Sources
Primary Research
- Web Analytics
- Survey Reports
- Research Institute
- Latest Research Reports
- Opinion Leaders
Secondary Research
- Annual Reports
- White Paper
- Latest Press Release
- Industry Association
- Paid Database
- Investor Presentations

Step 4 - Data Triangulation
Involves using different sources of information in order to increase the validity of a study
These sources are likely to be stakeholders in a program - participants, other researchers, program staff, other community members, and so on.
Then we put all data in single framework & apply various statistical tools to find out the dynamic on the market.
During the analysis stage, feedback from the stakeholder groups would be compared to determine areas of agreement as well as areas of divergence