

Key Insights
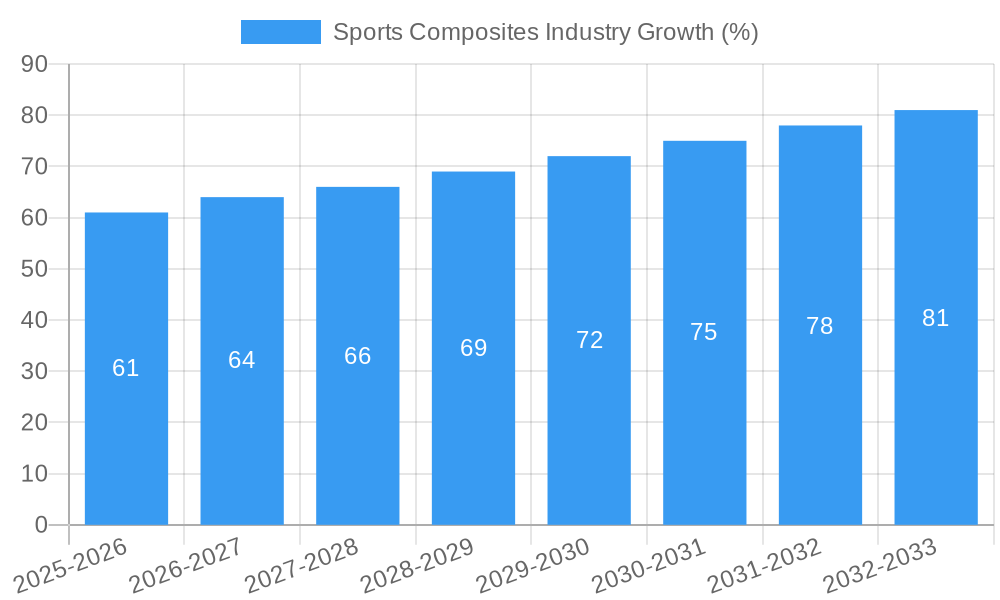
The global sports composites market, valued at approximately $1.5 billion in 2025, is projected to experience robust growth, driven by increasing demand for lightweight, high-performance sporting goods. A Compound Annual Growth Rate (CAGR) of 4.11% from 2025 to 2033 indicates a significant expansion of the market, reaching an estimated value exceeding $2.2 billion by 2033. This growth is fueled by several key factors. Firstly, the rising popularity of various sports, particularly those requiring specialized equipment like cycling, sailing, and motorsports, directly fuels demand for advanced composite materials offering superior strength-to-weight ratios and durability. Secondly, continuous advancements in composite materials technology, leading to lighter, stronger, and more customizable products, are further driving market expansion. The increasing focus on athlete performance and injury prevention also contributes significantly, as composite materials allow for the development of equipment better suited to specific athletic needs. Finally, the growing adoption of sustainable manufacturing practices within the sports industry is also influencing the market, with manufacturers increasingly incorporating eco-friendly composites into their production processes.
However, the market faces certain challenges. High manufacturing costs associated with specialized composite materials and skilled labor can hinder broader adoption, particularly in price-sensitive markets. Furthermore, the potential for environmental concerns related to the lifecycle of certain composite materials and their disposal needs to be addressed for long-term sustainability. Despite these restraints, the overall outlook for the sports composites market remains positive, with ongoing innovation and increasing consumer demand expected to drive continued growth throughout the forecast period. Key players like Celanese Corporation, Toray Industries Inc., and SGL Carbon are actively shaping the market through their technological advancements and product diversification strategies. Segmentation within the market is likely driven by the type of sport (e.g., cycling, sailing, motorsports), the specific composite material used (e.g., carbon fiber, fiberglass), and the geographic region.

Sports Composites Industry Market Report: 2019-2033
This comprehensive report provides an in-depth analysis of the global Sports Composites Industry, covering market dynamics, key players, emerging trends, and future growth prospects. With a study period spanning 2019-2033, a base year of 2025, and a forecast period of 2025-2033, this report offers invaluable insights for industry stakeholders, investors, and businesses seeking to navigate this dynamic sector. The global market is projected to reach xx Million by 2033, exhibiting a CAGR of xx% during the forecast period.
Sports Composites Industry Market Concentration & Dynamics
The Sports Composites Industry is characterized by a moderately concentrated market with several key players holding significant market share. While precise market share data for individual companies is proprietary information, we estimate that the top five players (including Celanese Corporation, Toray Industries Inc., Mitsubishi Chemical Carbon Fiber and Composites Inc., SGL Carbon, and Exel Composites) collectively account for approximately xx% of the global market in 2025. The industry’s innovation ecosystem is vibrant, driven by continuous advancements in materials science and manufacturing technologies. Regulatory frameworks vary across regions, impacting material approvals and sustainability standards. Substitute products, such as traditional materials like wood and metal, present competition, especially in price-sensitive segments. End-user trends towards lighter, stronger, and more durable sports equipment fuel demand for composite materials.
Mergers and Acquisitions (M&A) Activity:
- The industry has witnessed significant M&A activity in recent years. For instance, in February 2022, Celanese Corporation's acquisition of DuPont's Mobility & Materials business for USD 11.0 billion dramatically reshaped the competitive landscape.
- We estimate that xx M&A deals involving Sports Composites companies occurred between 2019 and 2024.
- The increasing strategic focus on consolidation points to potential for further M&A activity in the coming years.
Sports Composites Industry Industry Insights & Trends
The global Sports Composites Industry is experiencing robust growth, propelled by several key factors. The increasing popularity of various sports, particularly at professional and amateur levels, drives demand for high-performance sporting goods. The market size reached xx Million in 2024, and is projected to reach xx Million by 2033. Technological advancements in fiber reinforcement, resin systems, and manufacturing processes lead to lighter, stronger, and more durable products. This has resulted in improved performance characteristics for sports equipment, attracting both athletes and manufacturers. Evolving consumer preferences toward personalized and sustainable products are also shaping the industry, encouraging innovation in areas such as bio-based composites and customizable equipment. The overall growth is further enhanced by rising disposable incomes and increased participation in sports globally.
Key Markets & Segments Leading Sports Composites Industry
The North American and European regions currently dominate the Sports Composites Industry, driven by strong consumer demand and a robust sporting goods manufacturing base. Asia-Pacific is projected to show the fastest growth, fueled by rising disposable incomes and increasing participation in sports.
Drivers of Regional Dominance:
- North America: Strong established sporting goods manufacturing sector, high consumer spending on sports equipment.
- Europe: Established market with technologically advanced manufacturing capabilities, significant investments in R&D.
- Asia-Pacific: Rapid economic growth, rising disposable incomes, increasing participation in various sports.
Specific country-level analysis is included in the full report showing further nuances within regional dominance.
Sports Composites Industry Product Developments
Recent years have witnessed significant advancements in sports composite materials, focusing on enhanced performance, durability, and sustainability. Innovations include the development of high-strength carbon fiber reinforced polymers (CFRP), advanced resin systems offering improved impact resistance and weight reduction, and bio-based composites made from sustainable raw materials. These advancements deliver competitive advantages by providing superior performance to athletes and manufacturers.
Challenges in the Sports Composites Industry Market
The Sports Composites Industry faces several challenges, including fluctuating raw material prices, complex supply chains vulnerable to disruptions, and intense competition from established and emerging players. Regulatory hurdles regarding material safety and environmental compliance can also impose significant costs and impact product development. The combined effect of these factors can potentially restrict market growth by xx% by 2033 if not addressed effectively.
Forces Driving Sports Composites Industry Growth
Growth in this sector is fueled by several key factors. Technological advancements in materials science, manufacturing, and design, coupled with economic growth, particularly in developing economies, are critical drivers. Favorable regulatory environments promoting sustainability and innovation further enhance growth. The increasing focus on performance and personalization in sports equipment is also a major catalyst.
Challenges in the Sports Composites Industry Market
Long-term growth in the Sports Composites Industry hinges on continuous innovation, strategic partnerships, and market expansion into new and emerging regions. Collaboration within the industry and with research institutions is vital for fostering advancements in material science and manufacturing technologies. Expanding into untapped markets, particularly developing economies with high growth potential, is crucial for sustained long-term expansion.
Emerging Opportunities in Sports Composites Industry
The industry is rife with opportunities. The increasing demand for lightweight and high-performance equipment in niche sports, coupled with a growing focus on personalized and sustainable products, presents significant avenues for growth. Moreover, exploration of new material combinations and manufacturing processes can open up new product categories and enhance the sustainability profile of the industry.
Leading Players in the Sports Composites Industry Sector
- Celanese Corporation
- Dexcraft
- EPSILON Composite
- Exel Composites
- Mitsubishi Chemical Carbon Fiber and Composites Inc
- Rockman
- Rock West Composites
- SGL Carbon
- Toray Industries Inc
- Topkey
Key Milestones in Sports Composites Industry Industry
- February 2022: Celanese Corporation acquires DuPont's Mobility & Materials (M&M) business for USD 11.0 billion, significantly expanding its market presence and product portfolio.
- [Insert other significant milestones with year/month and brief description of impact on market dynamics]
Strategic Outlook for Sports Composites Industry Market
The Sports Composites Industry is poised for continued growth, driven by technological innovation, evolving consumer preferences, and expanding market opportunities. Strategic partnerships, investments in R&D, and expansion into new geographical markets will be key factors determining the success of companies in this dynamic sector. The focus on sustainability and customization will further shape the future of the industry, requiring companies to adapt and innovate to remain competitive.
Sports Composites Industry Segmentation
-
1. Type
- 1.1. Glass-Fibre Reinforced
- 1.2. Carbon-Fibre Reinforced
- 1.3. Other Types
-
2. Resin Type
- 2.1. Epoxy
- 2.2. Polyurethane
- 2.3. Other Resin Types
-
3. Applications
- 3.1. Golf Shafts
- 3.2. Hockey Sticks
- 3.3. Rackets
- 3.4. Bicycles
- 3.5. Skis and Snowboards
- 3.6. Other Applications
Sports Composites Industry Segmentation By Geography
-
1. Asia Pacific
- 1.1. China
- 1.2. India
- 1.3. Japan
- 1.4. South Korea
- 1.5. Rest of Asia Pacific
-
2. North America
- 2.1. United States
- 2.2. Canada
- 2.3. Mexico
-
3. Europe
- 3.1. Germany
- 3.2. United Kingdom
- 3.3. Italy
- 3.4. France
- 3.5. Rest of Europe
-
4. South America
- 4.1. Brazil
- 4.2. Argentina
- 4.3. Rest of South America
-
5. Middle East and Africa
- 5.1. Saudi Arabia
- 5.2. South Africa
- 5.3. Rest of Middle East and Africa

Sports Composites Industry REPORT HIGHLIGHTS
| Aspects | Details |
|---|---|
| Study Period | 2019-2033 |
| Base Year | 2024 |
| Estimated Year | 2025 |
| Forecast Period | 2025-2033 |
| Historical Period | 2019-2024 |
| Growth Rate | CAGR of 4.11% from 2019-2033 |
| Segmentation |
|
Table of Contents
- 1. Introduction
- 1.1. Research Scope
- 1.2. Market Segmentation
- 1.3. Research Methodology
- 1.4. Definitions and Assumptions
- 2. Executive Summary
- 2.1. Introduction
- 3. Market Dynamics
- 3.1. Introduction
- 3.2. Market Drivers
- 3.2.1. Increasing Demand for Lightweight and High-Performance Sports Equipment; Growing Golf Industry
- 3.3. Market Restrains
- 3.3.1. Increasing Demand for Lightweight and High-Performance Sports Equipment; Growing Golf Industry
- 3.4. Market Trends
- 3.4.1. Increasing Demand for Skis and Snowboards
- 4. Market Factor Analysis
- 4.1. Porters Five Forces
- 4.2. Supply/Value Chain
- 4.3. PESTEL analysis
- 4.4. Market Entropy
- 4.5. Patent/Trademark Analysis
- 5. Global Sports Composites Industry Analysis, Insights and Forecast, 2019-2031
- 5.1. Market Analysis, Insights and Forecast - by Type
- 5.1.1. Glass-Fibre Reinforced
- 5.1.2. Carbon-Fibre Reinforced
- 5.1.3. Other Types
- 5.2. Market Analysis, Insights and Forecast - by Resin Type
- 5.2.1. Epoxy
- 5.2.2. Polyurethane
- 5.2.3. Other Resin Types
- 5.3. Market Analysis, Insights and Forecast - by Applications
- 5.3.1. Golf Shafts
- 5.3.2. Hockey Sticks
- 5.3.3. Rackets
- 5.3.4. Bicycles
- 5.3.5. Skis and Snowboards
- 5.3.6. Other Applications
- 5.4. Market Analysis, Insights and Forecast - by Region
- 5.4.1. Asia Pacific
- 5.4.2. North America
- 5.4.3. Europe
- 5.4.4. South America
- 5.4.5. Middle East and Africa
- 5.1. Market Analysis, Insights and Forecast - by Type
- 6. Asia Pacific Sports Composites Industry Analysis, Insights and Forecast, 2019-2031
- 6.1. Market Analysis, Insights and Forecast - by Type
- 6.1.1. Glass-Fibre Reinforced
- 6.1.2. Carbon-Fibre Reinforced
- 6.1.3. Other Types
- 6.2. Market Analysis, Insights and Forecast - by Resin Type
- 6.2.1. Epoxy
- 6.2.2. Polyurethane
- 6.2.3. Other Resin Types
- 6.3. Market Analysis, Insights and Forecast - by Applications
- 6.3.1. Golf Shafts
- 6.3.2. Hockey Sticks
- 6.3.3. Rackets
- 6.3.4. Bicycles
- 6.3.5. Skis and Snowboards
- 6.3.6. Other Applications
- 6.1. Market Analysis, Insights and Forecast - by Type
- 7. North America Sports Composites Industry Analysis, Insights and Forecast, 2019-2031
- 7.1. Market Analysis, Insights and Forecast - by Type
- 7.1.1. Glass-Fibre Reinforced
- 7.1.2. Carbon-Fibre Reinforced
- 7.1.3. Other Types
- 7.2. Market Analysis, Insights and Forecast - by Resin Type
- 7.2.1. Epoxy
- 7.2.2. Polyurethane
- 7.2.3. Other Resin Types
- 7.3. Market Analysis, Insights and Forecast - by Applications
- 7.3.1. Golf Shafts
- 7.3.2. Hockey Sticks
- 7.3.3. Rackets
- 7.3.4. Bicycles
- 7.3.5. Skis and Snowboards
- 7.3.6. Other Applications
- 7.1. Market Analysis, Insights and Forecast - by Type
- 8. Europe Sports Composites Industry Analysis, Insights and Forecast, 2019-2031
- 8.1. Market Analysis, Insights and Forecast - by Type
- 8.1.1. Glass-Fibre Reinforced
- 8.1.2. Carbon-Fibre Reinforced
- 8.1.3. Other Types
- 8.2. Market Analysis, Insights and Forecast - by Resin Type
- 8.2.1. Epoxy
- 8.2.2. Polyurethane
- 8.2.3. Other Resin Types
- 8.3. Market Analysis, Insights and Forecast - by Applications
- 8.3.1. Golf Shafts
- 8.3.2. Hockey Sticks
- 8.3.3. Rackets
- 8.3.4. Bicycles
- 8.3.5. Skis and Snowboards
- 8.3.6. Other Applications
- 8.1. Market Analysis, Insights and Forecast - by Type
- 9. South America Sports Composites Industry Analysis, Insights and Forecast, 2019-2031
- 9.1. Market Analysis, Insights and Forecast - by Type
- 9.1.1. Glass-Fibre Reinforced
- 9.1.2. Carbon-Fibre Reinforced
- 9.1.3. Other Types
- 9.2. Market Analysis, Insights and Forecast - by Resin Type
- 9.2.1. Epoxy
- 9.2.2. Polyurethane
- 9.2.3. Other Resin Types
- 9.3. Market Analysis, Insights and Forecast - by Applications
- 9.3.1. Golf Shafts
- 9.3.2. Hockey Sticks
- 9.3.3. Rackets
- 9.3.4. Bicycles
- 9.3.5. Skis and Snowboards
- 9.3.6. Other Applications
- 9.1. Market Analysis, Insights and Forecast - by Type
- 10. Middle East and Africa Sports Composites Industry Analysis, Insights and Forecast, 2019-2031
- 10.1. Market Analysis, Insights and Forecast - by Type
- 10.1.1. Glass-Fibre Reinforced
- 10.1.2. Carbon-Fibre Reinforced
- 10.1.3. Other Types
- 10.2. Market Analysis, Insights and Forecast - by Resin Type
- 10.2.1. Epoxy
- 10.2.2. Polyurethane
- 10.2.3. Other Resin Types
- 10.3. Market Analysis, Insights and Forecast - by Applications
- 10.3.1. Golf Shafts
- 10.3.2. Hockey Sticks
- 10.3.3. Rackets
- 10.3.4. Bicycles
- 10.3.5. Skis and Snowboards
- 10.3.6. Other Applications
- 10.1. Market Analysis, Insights and Forecast - by Type
- 11. Competitive Analysis
- 11.1. Global Market Share Analysis 2024
- 11.2. Company Profiles
- 11.2.1 Celanese Corporation
- 11.2.1.1. Overview
- 11.2.1.2. Products
- 11.2.1.3. SWOT Analysis
- 11.2.1.4. Recent Developments
- 11.2.1.5. Financials (Based on Availability)
- 11.2.2 Dexcraft
- 11.2.2.1. Overview
- 11.2.2.2. Products
- 11.2.2.3. SWOT Analysis
- 11.2.2.4. Recent Developments
- 11.2.2.5. Financials (Based on Availability)
- 11.2.3 EPSILON Composite
- 11.2.3.1. Overview
- 11.2.3.2. Products
- 11.2.3.3. SWOT Analysis
- 11.2.3.4. Recent Developments
- 11.2.3.5. Financials (Based on Availability)
- 11.2.4 Exel Composites
- 11.2.4.1. Overview
- 11.2.4.2. Products
- 11.2.4.3. SWOT Analysis
- 11.2.4.4. Recent Developments
- 11.2.4.5. Financials (Based on Availability)
- 11.2.5 Mitsubishi Chemical Carbon Fiber and Composites Inc
- 11.2.5.1. Overview
- 11.2.5.2. Products
- 11.2.5.3. SWOT Analysis
- 11.2.5.4. Recent Developments
- 11.2.5.5. Financials (Based on Availability)
- 11.2.6 Rockman
- 11.2.6.1. Overview
- 11.2.6.2. Products
- 11.2.6.3. SWOT Analysis
- 11.2.6.4. Recent Developments
- 11.2.6.5. Financials (Based on Availability)
- 11.2.7 Rock West Composites
- 11.2.7.1. Overview
- 11.2.7.2. Products
- 11.2.7.3. SWOT Analysis
- 11.2.7.4. Recent Developments
- 11.2.7.5. Financials (Based on Availability)
- 11.2.8 SGL Carbon
- 11.2.8.1. Overview
- 11.2.8.2. Products
- 11.2.8.3. SWOT Analysis
- 11.2.8.4. Recent Developments
- 11.2.8.5. Financials (Based on Availability)
- 11.2.9 Toray Industries Inc
- 11.2.9.1. Overview
- 11.2.9.2. Products
- 11.2.9.3. SWOT Analysis
- 11.2.9.4. Recent Developments
- 11.2.9.5. Financials (Based on Availability)
- 11.2.10 Topkey*List Not Exhaustive
- 11.2.10.1. Overview
- 11.2.10.2. Products
- 11.2.10.3. SWOT Analysis
- 11.2.10.4. Recent Developments
- 11.2.10.5. Financials (Based on Availability)
- 11.2.1 Celanese Corporation
List of Figures
- Figure 1: Global Sports Composites Industry Revenue Breakdown (Million, %) by Region 2024 & 2032
- Figure 2: Asia Pacific Sports Composites Industry Revenue (Million), by Type 2024 & 2032
- Figure 3: Asia Pacific Sports Composites Industry Revenue Share (%), by Type 2024 & 2032
- Figure 4: Asia Pacific Sports Composites Industry Revenue (Million), by Resin Type 2024 & 2032
- Figure 5: Asia Pacific Sports Composites Industry Revenue Share (%), by Resin Type 2024 & 2032
- Figure 6: Asia Pacific Sports Composites Industry Revenue (Million), by Applications 2024 & 2032
- Figure 7: Asia Pacific Sports Composites Industry Revenue Share (%), by Applications 2024 & 2032
- Figure 8: Asia Pacific Sports Composites Industry Revenue (Million), by Country 2024 & 2032
- Figure 9: Asia Pacific Sports Composites Industry Revenue Share (%), by Country 2024 & 2032
- Figure 10: North America Sports Composites Industry Revenue (Million), by Type 2024 & 2032
- Figure 11: North America Sports Composites Industry Revenue Share (%), by Type 2024 & 2032
- Figure 12: North America Sports Composites Industry Revenue (Million), by Resin Type 2024 & 2032
- Figure 13: North America Sports Composites Industry Revenue Share (%), by Resin Type 2024 & 2032
- Figure 14: North America Sports Composites Industry Revenue (Million), by Applications 2024 & 2032
- Figure 15: North America Sports Composites Industry Revenue Share (%), by Applications 2024 & 2032
- Figure 16: North America Sports Composites Industry Revenue (Million), by Country 2024 & 2032
- Figure 17: North America Sports Composites Industry Revenue Share (%), by Country 2024 & 2032
- Figure 18: Europe Sports Composites Industry Revenue (Million), by Type 2024 & 2032
- Figure 19: Europe Sports Composites Industry Revenue Share (%), by Type 2024 & 2032
- Figure 20: Europe Sports Composites Industry Revenue (Million), by Resin Type 2024 & 2032
- Figure 21: Europe Sports Composites Industry Revenue Share (%), by Resin Type 2024 & 2032
- Figure 22: Europe Sports Composites Industry Revenue (Million), by Applications 2024 & 2032
- Figure 23: Europe Sports Composites Industry Revenue Share (%), by Applications 2024 & 2032
- Figure 24: Europe Sports Composites Industry Revenue (Million), by Country 2024 & 2032
- Figure 25: Europe Sports Composites Industry Revenue Share (%), by Country 2024 & 2032
- Figure 26: South America Sports Composites Industry Revenue (Million), by Type 2024 & 2032
- Figure 27: South America Sports Composites Industry Revenue Share (%), by Type 2024 & 2032
- Figure 28: South America Sports Composites Industry Revenue (Million), by Resin Type 2024 & 2032
- Figure 29: South America Sports Composites Industry Revenue Share (%), by Resin Type 2024 & 2032
- Figure 30: South America Sports Composites Industry Revenue (Million), by Applications 2024 & 2032
- Figure 31: South America Sports Composites Industry Revenue Share (%), by Applications 2024 & 2032
- Figure 32: South America Sports Composites Industry Revenue (Million), by Country 2024 & 2032
- Figure 33: South America Sports Composites Industry Revenue Share (%), by Country 2024 & 2032
- Figure 34: Middle East and Africa Sports Composites Industry Revenue (Million), by Type 2024 & 2032
- Figure 35: Middle East and Africa Sports Composites Industry Revenue Share (%), by Type 2024 & 2032
- Figure 36: Middle East and Africa Sports Composites Industry Revenue (Million), by Resin Type 2024 & 2032
- Figure 37: Middle East and Africa Sports Composites Industry Revenue Share (%), by Resin Type 2024 & 2032
- Figure 38: Middle East and Africa Sports Composites Industry Revenue (Million), by Applications 2024 & 2032
- Figure 39: Middle East and Africa Sports Composites Industry Revenue Share (%), by Applications 2024 & 2032
- Figure 40: Middle East and Africa Sports Composites Industry Revenue (Million), by Country 2024 & 2032
- Figure 41: Middle East and Africa Sports Composites Industry Revenue Share (%), by Country 2024 & 2032
List of Tables
- Table 1: Global Sports Composites Industry Revenue Million Forecast, by Region 2019 & 2032
- Table 2: Global Sports Composites Industry Revenue Million Forecast, by Type 2019 & 2032
- Table 3: Global Sports Composites Industry Revenue Million Forecast, by Resin Type 2019 & 2032
- Table 4: Global Sports Composites Industry Revenue Million Forecast, by Applications 2019 & 2032
- Table 5: Global Sports Composites Industry Revenue Million Forecast, by Region 2019 & 2032
- Table 6: Global Sports Composites Industry Revenue Million Forecast, by Type 2019 & 2032
- Table 7: Global Sports Composites Industry Revenue Million Forecast, by Resin Type 2019 & 2032
- Table 8: Global Sports Composites Industry Revenue Million Forecast, by Applications 2019 & 2032
- Table 9: Global Sports Composites Industry Revenue Million Forecast, by Country 2019 & 2032
- Table 10: China Sports Composites Industry Revenue (Million) Forecast, by Application 2019 & 2032
- Table 11: India Sports Composites Industry Revenue (Million) Forecast, by Application 2019 & 2032
- Table 12: Japan Sports Composites Industry Revenue (Million) Forecast, by Application 2019 & 2032
- Table 13: South Korea Sports Composites Industry Revenue (Million) Forecast, by Application 2019 & 2032
- Table 14: Rest of Asia Pacific Sports Composites Industry Revenue (Million) Forecast, by Application 2019 & 2032
- Table 15: Global Sports Composites Industry Revenue Million Forecast, by Type 2019 & 2032
- Table 16: Global Sports Composites Industry Revenue Million Forecast, by Resin Type 2019 & 2032
- Table 17: Global Sports Composites Industry Revenue Million Forecast, by Applications 2019 & 2032
- Table 18: Global Sports Composites Industry Revenue Million Forecast, by Country 2019 & 2032
- Table 19: United States Sports Composites Industry Revenue (Million) Forecast, by Application 2019 & 2032
- Table 20: Canada Sports Composites Industry Revenue (Million) Forecast, by Application 2019 & 2032
- Table 21: Mexico Sports Composites Industry Revenue (Million) Forecast, by Application 2019 & 2032
- Table 22: Global Sports Composites Industry Revenue Million Forecast, by Type 2019 & 2032
- Table 23: Global Sports Composites Industry Revenue Million Forecast, by Resin Type 2019 & 2032
- Table 24: Global Sports Composites Industry Revenue Million Forecast, by Applications 2019 & 2032
- Table 25: Global Sports Composites Industry Revenue Million Forecast, by Country 2019 & 2032
- Table 26: Germany Sports Composites Industry Revenue (Million) Forecast, by Application 2019 & 2032
- Table 27: United Kingdom Sports Composites Industry Revenue (Million) Forecast, by Application 2019 & 2032
- Table 28: Italy Sports Composites Industry Revenue (Million) Forecast, by Application 2019 & 2032
- Table 29: France Sports Composites Industry Revenue (Million) Forecast, by Application 2019 & 2032
- Table 30: Rest of Europe Sports Composites Industry Revenue (Million) Forecast, by Application 2019 & 2032
- Table 31: Global Sports Composites Industry Revenue Million Forecast, by Type 2019 & 2032
- Table 32: Global Sports Composites Industry Revenue Million Forecast, by Resin Type 2019 & 2032
- Table 33: Global Sports Composites Industry Revenue Million Forecast, by Applications 2019 & 2032
- Table 34: Global Sports Composites Industry Revenue Million Forecast, by Country 2019 & 2032
- Table 35: Brazil Sports Composites Industry Revenue (Million) Forecast, by Application 2019 & 2032
- Table 36: Argentina Sports Composites Industry Revenue (Million) Forecast, by Application 2019 & 2032
- Table 37: Rest of South America Sports Composites Industry Revenue (Million) Forecast, by Application 2019 & 2032
- Table 38: Global Sports Composites Industry Revenue Million Forecast, by Type 2019 & 2032
- Table 39: Global Sports Composites Industry Revenue Million Forecast, by Resin Type 2019 & 2032
- Table 40: Global Sports Composites Industry Revenue Million Forecast, by Applications 2019 & 2032
- Table 41: Global Sports Composites Industry Revenue Million Forecast, by Country 2019 & 2032
- Table 42: Saudi Arabia Sports Composites Industry Revenue (Million) Forecast, by Application 2019 & 2032
- Table 43: South Africa Sports Composites Industry Revenue (Million) Forecast, by Application 2019 & 2032
- Table 44: Rest of Middle East and Africa Sports Composites Industry Revenue (Million) Forecast, by Application 2019 & 2032
Frequently Asked Questions
1. What is the projected Compound Annual Growth Rate (CAGR) of the Sports Composites Industry?
The projected CAGR is approximately 4.11%.
2. Which companies are prominent players in the Sports Composites Industry?
Key companies in the market include Celanese Corporation, Dexcraft, EPSILON Composite, Exel Composites, Mitsubishi Chemical Carbon Fiber and Composites Inc, Rockman, Rock West Composites, SGL Carbon, Toray Industries Inc, Topkey*List Not Exhaustive.
3. What are the main segments of the Sports Composites Industry?
The market segments include Type, Resin Type, Applications.
4. Can you provide details about the market size?
The market size is estimated to be USD XX Million as of 2022.
5. What are some drivers contributing to market growth?
Increasing Demand for Lightweight and High-Performance Sports Equipment; Growing Golf Industry.
6. What are the notable trends driving market growth?
Increasing Demand for Skis and Snowboards.
7. Are there any restraints impacting market growth?
Increasing Demand for Lightweight and High-Performance Sports Equipment; Growing Golf Industry.
8. Can you provide examples of recent developments in the market?
In February 2022, Celanese Corporation announced the acquisition of DuPont's Mobility & Materials (M&M) business for USD 11.0 billion. This acquisition will expand the company's product portfolio and extend its reach globally.
9. What pricing options are available for accessing the report?
Pricing options include single-user, multi-user, and enterprise licenses priced at USD 4750, USD 5250, and USD 8750 respectively.
10. Is the market size provided in terms of value or volume?
The market size is provided in terms of value, measured in Million.
11. Are there any specific market keywords associated with the report?
Yes, the market keyword associated with the report is "Sports Composites Industry," which aids in identifying and referencing the specific market segment covered.
12. How do I determine which pricing option suits my needs best?
The pricing options vary based on user requirements and access needs. Individual users may opt for single-user licenses, while businesses requiring broader access may choose multi-user or enterprise licenses for cost-effective access to the report.
13. Are there any additional resources or data provided in the Sports Composites Industry report?
While the report offers comprehensive insights, it's advisable to review the specific contents or supplementary materials provided to ascertain if additional resources or data are available.
14. How can I stay updated on further developments or reports in the Sports Composites Industry?
To stay informed about further developments, trends, and reports in the Sports Composites Industry, consider subscribing to industry newsletters, following relevant companies and organizations, or regularly checking reputable industry news sources and publications.
Methodology
Step 1 - Identification of Relevant Samples Size from Population Database


Step 2 - Approaches for Defining Global Market Size (Value, Volume* & Price*)

Note*: In applicable scenarios
Step 3 - Data Sources
Primary Research
- Web Analytics
- Survey Reports
- Research Institute
- Latest Research Reports
- Opinion Leaders
Secondary Research
- Annual Reports
- White Paper
- Latest Press Release
- Industry Association
- Paid Database
- Investor Presentations

Step 4 - Data Triangulation
Involves using different sources of information in order to increase the validity of a study
These sources are likely to be stakeholders in a program - participants, other researchers, program staff, other community members, and so on.
Then we put all data in single framework & apply various statistical tools to find out the dynamic on the market.
During the analysis stage, feedback from the stakeholder groups would be compared to determine areas of agreement as well as areas of divergence
