

Key Insights
The global submersible pump market, valued at $18.83 billion in 2025, is projected to experience robust growth, driven by increasing demand across diverse sectors. A compound annual growth rate (CAGR) of 8.20% from 2025 to 2033 indicates a significant market expansion, reaching an estimated value exceeding $35 billion by 2033. Key drivers include the rising need for efficient water management solutions in agriculture, industrial processes, and municipal water supply, coupled with the growing oil and gas exploration and extraction activities. Furthermore, the construction boom in emerging economies fuels demand for submersible pumps in construction and mining projects. Market segmentation reveals a strong preference for electric-driven borewell submersible pumps, largely catering to the water and wastewater industry. However, the market also shows considerable potential for hydraulic and other drive types, particularly in specialized applications within oil and gas and mining sectors. Growth is expected to be particularly strong in the Asia-Pacific region, driven by rapid urbanization and infrastructure development in countries like India and China. Competitive landscape analysis indicates significant players like Grundfos, ITT Goulds Pumps, and Ebara Corporation, with their extensive product portfolios and global reach, holding considerable market share. Technological advancements focusing on energy efficiency and enhanced durability will continue shaping market dynamics in the coming years.
The submersible pump market faces certain restraints, primarily related to the high initial investment costs and the potential for equipment failure due to harsh operating conditions. However, ongoing technological innovations are addressing these challenges through the development of robust, energy-efficient designs and improved maintenance practices. The development of smart pumps with integrated monitoring and control systems is also expected to enhance efficiency and reduce downtime. Regional variations in growth rates are expected, reflecting differences in infrastructure development, economic growth, and water resource management policies. North America and Europe will likely maintain a strong position, while rapid growth is anticipated in the Asia-Pacific and Middle East & Africa regions. The competitive landscape will continue to evolve with ongoing mergers, acquisitions, and technological advancements shaping market dynamics and influencing pricing strategies.

Submersible Pump Industry Market Report: 2019-2033
This comprehensive report provides an in-depth analysis of the global submersible pump industry, projecting a market value exceeding $XX Billion by 2033. The study covers the period from 2019 to 2033, with 2025 as the base year and a forecast period spanning 2025-2033. Key players like ITT Goulds Pumps, Grundfos Group, Ebara Corporation, and others are analyzed, revealing market dynamics and future growth trajectories. This report is essential for investors, manufacturers, and industry stakeholders seeking to navigate this dynamic market.
Submersible Pump Industry Market Concentration & Dynamics
The submersible pump market presents a moderately concentrated landscape, dominated by several key players commanding significant market share. In 2025, the top 15 companies—including ITT Goulds Pumps, Grundfos Group, Ebara Corporation, Flowserve Corporation, Weir Group PLC, Atlas Copco AB, Baker Hughes Co, Franklin Electric Co Inc, Borets International Ltd, Halliburton Co, KSB AG, The Gorman-Rupp Company, Sulzer AG, and Schlumberger Limited—collectively held approximately 64% of the global market. However, the presence of numerous smaller, specialized firms fosters a dynamic and competitive environment. This concentration is further analyzed below.
Market Concentration Metrics (2025):
- Top 5 players: [Insert Updated Percentage]% market share
- Top 10 players: [Insert Updated Percentage]% market share
- Top 15 players: 64% market share
The industry's dynamics are influenced by several crucial factors:
- Innovation Ecosystem: Continuous advancements in pump design, materials science (e.g., advanced polymers and alloys), and sophisticated control systems (including IoT integration and AI-driven predictive maintenance) are key drivers of market expansion. The emphasis is shifting towards energy-efficient, sustainable, and smart technologies.
- Regulatory Frameworks: Stringent environmental regulations globally, particularly concerning water conservation, wastewater treatment efficiency, and reduction of carbon emissions, significantly impact market demand and necessitate the development of compliant and environmentally friendly pump solutions.
- Substitute Products and Technological Competition: While submersible pumps retain dominance in various applications, competition from alternative technologies, such as centrifugal pumps and other fluid handling systems, exists, particularly in niche sectors. The competitive landscape is constantly evolving with the introduction of new technologies.
- End-User Trends and Market Segmentation: Robust growth is fueled by increasing demand from the water and wastewater treatment sectors, significant investments in oil and gas extraction, mining operations, and the burgeoning renewable energy sector (e.g., geothermal and solar). Understanding specific market segments (industrial, municipal, agricultural, etc.) is critical for targeted growth strategies.
- Mergers & Acquisitions (M&A) Activity: The industry has witnessed a notable level of M&A activity in recent years, with approximately [Insert Updated Number] deals recorded between 2019 and 2024. These transactions frequently aim to expand product portfolios, integrate advanced technologies, enhance geographical reach, and achieve economies of scale.
Submersible Pump Industry Insights & Trends
The global submersible pump market is experiencing robust growth, projected to reach a value exceeding $XX Billion by 2033, exhibiting a Compound Annual Growth Rate (CAGR) of XX% during the forecast period (2025-2033). This growth is fueled by several key drivers:
- Expanding Infrastructure: Investment in water and wastewater management infrastructure, particularly in developing economies, significantly boosts demand for submersible pumps.
- Technological Advancements: The adoption of smart pumps, featuring remote monitoring, predictive maintenance, and improved energy efficiency, enhances market appeal.
- Rising Energy Costs: The increasing cost of energy motivates the demand for energy-efficient pump models, further driving market growth.
- Growing Industrialization: Expansion across various industrial sectors, including oil and gas, mining, and construction, fuels the demand for reliable and high-performance submersible pumps.
- Government Initiatives: Government initiatives and policies aimed at improving water resource management and promoting sustainable practices positively impact market expansion.

Key Markets & Segments Leading Submersible Pump Industry
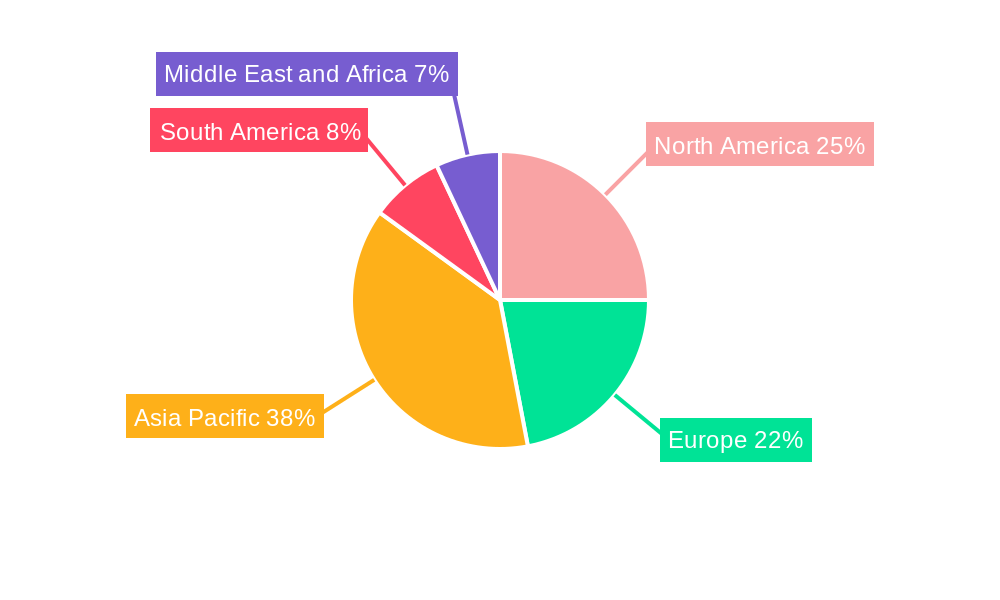
The Asia-Pacific region currently holds the largest market share in the submersible pump industry, driven by rapid infrastructure development and industrial growth in countries like China and India. However, other regions are witnessing significant growth as well.
Key Market Drivers:
- Economic Growth: Strong economic growth in developing countries fuels demand for infrastructure development, including water and wastewater management systems.
- Infrastructure Development: Investment in new and improved water infrastructure, particularly in urban areas, significantly drives market expansion.
- Technological Advancements: The development and adoption of technologically advanced submersible pumps enhance their efficiency and effectiveness, making them more attractive to end-users.
Dominant Segments:
- Type: Electric submersible pumps dominate the market due to their reliability, ease of installation, and cost-effectiveness. Borewell submersible pumps hold a significant share, catering to the widespread use of borewells for water extraction.
- Drive Type: Electric drive pumps are the dominant type, while hydraulic and other drive types cater to niche applications requiring high pressure or specific operational characteristics.
- Head: The segment of pumps with heads between 50m and 100m holds a considerable share, reflecting the common depth ranges encountered in many applications.
- End User: The water and wastewater sector currently accounts for the largest share, followed by the oil and gas and mining and construction industries. Growth in these sectors directly impacts the market's expansion.
Submersible Pump Industry Product Developments
Recent years have witnessed significant advancements in submersible pump technology, including the integration of smart sensors, improved motor designs, and the use of advanced materials for enhanced durability and efficiency. The development of electro-submersible pumps, exemplified by Curtiss-Wright's collaboration with Shell Plc, highlights the trend towards more energy-efficient and reliable solutions for demanding applications such as offshore oil and gas extraction. These innovations are vital for maintaining a competitive edge in the market and meeting the evolving demands of diverse end-user sectors.
Challenges in the Submersible Pump Industry Market
The submersible pump industry faces considerable challenges, including volatile raw material prices (e.g., steel, copper, and rare earth elements) that directly impact production costs, the need for ongoing compliance with stringent environmental regulations (requiring investment in R&D and potentially increasing production costs), and intense competition from both established industry players and new, disruptive entrants. Supply chain vulnerabilities and disruptions regarding essential components can significantly impede production and delivery timelines, impacting profitability. Regional economic downturns and geopolitical instability can further compound these challenges. For instance, the XX% surge in raw material costs between 2022 and 2023 necessitated price adjustments across the market, underscoring the industry's sensitivity to external economic factors.
Forces Driving Submersible Pump Industry Growth
Several factors contribute to the growth of the submersible pump industry. Technological innovations, such as energy-efficient designs and smart pump technologies, are driving adoption. Increasing infrastructure investments in water management and industrial sectors create a significant demand. Furthermore, favorable government policies and initiatives supporting sustainable water management practices fuel market expansion. These combined forces propel the long-term growth of the submersible pump sector.
Challenges in the Submersible Pump Industry Market
The submersible pump industry faces considerable challenges, including volatile raw material prices (e.g., steel, copper, and rare earth elements) that directly impact production costs, the need for ongoing compliance with stringent environmental regulations (requiring investment in R&D and potentially increasing production costs), and intense competition from both established industry players and new, disruptive entrants. Supply chain vulnerabilities and disruptions regarding essential components can significantly impede production and delivery timelines, impacting profitability. Regional economic downturns and geopolitical instability can further compound these challenges. For instance, the XX% surge in raw material costs between 2022 and 2023 necessitated price adjustments across the market, underscoring the industry's sensitivity to external economic factors.
Emerging Opportunities in Submersible Pump Industry
The submersible pump industry is witnessing several promising emerging trends that present significant growth opportunities. Smart pumps with integrated remote monitoring, predictive maintenance capabilities, and advanced data analytics offer substantial potential for enhancing operational efficiency and reducing lifecycle costs. The expansion into the rapidly growing renewable energy sectors—such as geothermal energy extraction and solar-powered water pumping systems—is creating a new wave of demand. The global focus on water conservation and efficient water management underscores the need for innovative submersible pump solutions that prioritize energy efficiency and sustainability, creating a significant market for advanced, eco-friendly technologies.
Leading Players in the Submersible Pump Industry Sector
- ITT Goulds Pumps
- Grundfos Group
- Ebara Corporation
- Flowserve Corporation
- Weir Group PLC
- Atlas Copco AB
- Baker Hughes Co
- Franklin Electric Co Inc
- Borets International Ltd
- Halliburton Co
- KSB AG
- The Gorman-Rupp Company
- Sulzer AG
- Schlumberger Limited
Key Milestones in Submersible Pump Industry Industry
- May 2023: Curtiss-Wright Corporation signs an agreement with Shell Plc to develop and supply electro-submersible pumps for offshore platforms, highlighting advancements in subsea pump technology.
- February 2022: Industrial Flow Solutions acquires Dreno Pompe, expanding its presence in the wastewater pump market and demonstrating ongoing consolidation in the industry.
Strategic Outlook for Submersible Pump Industry Market
The submersible pump industry is poised for continued growth, driven by technological advancements, expanding infrastructure needs, and a growing focus on water resource management. Strategic opportunities lie in developing energy-efficient and smart pump technologies, expanding into emerging markets, and forging strategic alliances to enhance market reach and technological capabilities. The market's future potential is significant, presenting lucrative prospects for businesses willing to invest in innovation and strategic partnerships.
Submersible Pump Industry Segmentation
-
1. Type
- 1.1. Borewell Submersible Pump
- 1.2. Openwell Submersible Pump
- 1.3. Non-clog Submersible Pump
-
2. Drive Type
- 2.1. Electric
- 2.2. Hydraulic
- 2.3. Other Drive Types
-
3. Head
- 3.1. Below 50 m
- 3.2. Between 50 m to 100 m
- 3.3. Above 100 m
-
4. End User
- 4.1. Water and Wastewater
- 4.2. Oil and Gas Industry
- 4.3. Mining and Construction Industry
- 4.4. Other End Users
Submersible Pump Industry Segmentation By Geography
-
1. North America
- 1.1. United States
- 1.2. Canada
- 1.3. Rest of North America
-
2. Europe
- 2.1. Germany
- 2.2. France
- 2.3. United Kingdom
- 2.4. Spain
- 2.5. Nordic Countries
- 2.6. Turkey
- 2.7. Russia
- 2.8. Rest of Europe
-
3. Asia Pacific
- 3.1. China
- 3.2. India
- 3.3. Japan
- 3.4. South Korea
- 3.5. Malaysia
- 3.6. Thailand
- 3.7. Indonesia
- 3.8. Vietnam
- 3.9. Rest of Asia Pacific
-
4. South America
- 4.1. Brazil
- 4.2. Argentina
- 4.3. Colombia
- 4.4. Rest of South America
-
5. Middle East and Africa
- 5.1. Saudi Arabia
- 5.2. United Arab Emirates
- 5.3. South Africa
- 5.4. Nigeria
- 5.5. Qatar
- 5.6. Egypt
- 5.7. Rest of Middle East and Africa
Submersible Pump Industry REPORT HIGHLIGHTS
| Aspects | Details |
|---|---|
| Study Period | 2019-2033 |
| Base Year | 2024 |
| Estimated Year | 2025 |
| Forecast Period | 2025-2033 |
| Historical Period | 2019-2024 |
| Growth Rate | CAGR of 8.20% from 2019-2033 |
| Segmentation |
|
Table of Contents
- 1. Introduction
- 1.1. Research Scope
- 1.2. Market Segmentation
- 1.3. Research Methodology
- 1.4. Definitions and Assumptions
- 2. Executive Summary
- 2.1. Introduction
- 3. Market Dynamics
- 3.1. Introduction
- 3.2. Market Drivers
- 3.2.1. 4.; Rapid Recovery in the Oil and Gas and Mining Industries4.; Surge in the Construction Industry
- 3.3. Market Restrains
- 3.3.1. 4.; High Maintenance and Operation Costs of Submersible Pump Restrain the Market
- 3.4. Market Trends
- 3.4.1. The Oil and Gas Industry is Expected to Dominate the Market
- 4. Market Factor Analysis
- 4.1. Porters Five Forces
- 4.2. Supply/Value Chain
- 4.3. PESTEL analysis
- 4.4. Market Entropy
- 4.5. Patent/Trademark Analysis
- 5. Global Submersible Pump Industry Analysis, Insights and Forecast, 2019-2031
- 5.1. Market Analysis, Insights and Forecast - by Type
- 5.1.1. Borewell Submersible Pump
- 5.1.2. Openwell Submersible Pump
- 5.1.3. Non-clog Submersible Pump
- 5.2. Market Analysis, Insights and Forecast - by Drive Type
- 5.2.1. Electric
- 5.2.2. Hydraulic
- 5.2.3. Other Drive Types
- 5.3. Market Analysis, Insights and Forecast - by Head
- 5.3.1. Below 50 m
- 5.3.2. Between 50 m to 100 m
- 5.3.3. Above 100 m
- 5.4. Market Analysis, Insights and Forecast - by End User
- 5.4.1. Water and Wastewater
- 5.4.2. Oil and Gas Industry
- 5.4.3. Mining and Construction Industry
- 5.4.4. Other End Users
- 5.5. Market Analysis, Insights and Forecast - by Region
- 5.5.1. North America
- 5.5.2. Europe
- 5.5.3. Asia Pacific
- 5.5.4. South America
- 5.5.5. Middle East and Africa
- 5.1. Market Analysis, Insights and Forecast - by Type
- 6. North America Submersible Pump Industry Analysis, Insights and Forecast, 2019-2031
- 6.1. Market Analysis, Insights and Forecast - by Type
- 6.1.1. Borewell Submersible Pump
- 6.1.2. Openwell Submersible Pump
- 6.1.3. Non-clog Submersible Pump
- 6.2. Market Analysis, Insights and Forecast - by Drive Type
- 6.2.1. Electric
- 6.2.2. Hydraulic
- 6.2.3. Other Drive Types
- 6.3. Market Analysis, Insights and Forecast - by Head
- 6.3.1. Below 50 m
- 6.3.2. Between 50 m to 100 m
- 6.3.3. Above 100 m
- 6.4. Market Analysis, Insights and Forecast - by End User
- 6.4.1. Water and Wastewater
- 6.4.2. Oil and Gas Industry
- 6.4.3. Mining and Construction Industry
- 6.4.4. Other End Users
- 6.1. Market Analysis, Insights and Forecast - by Type
- 7. Europe Submersible Pump Industry Analysis, Insights and Forecast, 2019-2031
- 7.1. Market Analysis, Insights and Forecast - by Type
- 7.1.1. Borewell Submersible Pump
- 7.1.2. Openwell Submersible Pump
- 7.1.3. Non-clog Submersible Pump
- 7.2. Market Analysis, Insights and Forecast - by Drive Type
- 7.2.1. Electric
- 7.2.2. Hydraulic
- 7.2.3. Other Drive Types
- 7.3. Market Analysis, Insights and Forecast - by Head
- 7.3.1. Below 50 m
- 7.3.2. Between 50 m to 100 m
- 7.3.3. Above 100 m
- 7.4. Market Analysis, Insights and Forecast - by End User
- 7.4.1. Water and Wastewater
- 7.4.2. Oil and Gas Industry
- 7.4.3. Mining and Construction Industry
- 7.4.4. Other End Users
- 7.1. Market Analysis, Insights and Forecast - by Type
- 8. Asia Pacific Submersible Pump Industry Analysis, Insights and Forecast, 2019-2031
- 8.1. Market Analysis, Insights and Forecast - by Type
- 8.1.1. Borewell Submersible Pump
- 8.1.2. Openwell Submersible Pump
- 8.1.3. Non-clog Submersible Pump
- 8.2. Market Analysis, Insights and Forecast - by Drive Type
- 8.2.1. Electric
- 8.2.2. Hydraulic
- 8.2.3. Other Drive Types
- 8.3. Market Analysis, Insights and Forecast - by Head
- 8.3.1. Below 50 m
- 8.3.2. Between 50 m to 100 m
- 8.3.3. Above 100 m
- 8.4. Market Analysis, Insights and Forecast - by End User
- 8.4.1. Water and Wastewater
- 8.4.2. Oil and Gas Industry
- 8.4.3. Mining and Construction Industry
- 8.4.4. Other End Users
- 8.1. Market Analysis, Insights and Forecast - by Type
- 9. South America Submersible Pump Industry Analysis, Insights and Forecast, 2019-2031
- 9.1. Market Analysis, Insights and Forecast - by Type
- 9.1.1. Borewell Submersible Pump
- 9.1.2. Openwell Submersible Pump
- 9.1.3. Non-clog Submersible Pump
- 9.2. Market Analysis, Insights and Forecast - by Drive Type
- 9.2.1. Electric
- 9.2.2. Hydraulic
- 9.2.3. Other Drive Types
- 9.3. Market Analysis, Insights and Forecast - by Head
- 9.3.1. Below 50 m
- 9.3.2. Between 50 m to 100 m
- 9.3.3. Above 100 m
- 9.4. Market Analysis, Insights and Forecast - by End User
- 9.4.1. Water and Wastewater
- 9.4.2. Oil and Gas Industry
- 9.4.3. Mining and Construction Industry
- 9.4.4. Other End Users
- 9.1. Market Analysis, Insights and Forecast - by Type
- 10. Middle East and Africa Submersible Pump Industry Analysis, Insights and Forecast, 2019-2031
- 10.1. Market Analysis, Insights and Forecast - by Type
- 10.1.1. Borewell Submersible Pump
- 10.1.2. Openwell Submersible Pump
- 10.1.3. Non-clog Submersible Pump
- 10.2. Market Analysis, Insights and Forecast - by Drive Type
- 10.2.1. Electric
- 10.2.2. Hydraulic
- 10.2.3. Other Drive Types
- 10.3. Market Analysis, Insights and Forecast - by Head
- 10.3.1. Below 50 m
- 10.3.2. Between 50 m to 100 m
- 10.3.3. Above 100 m
- 10.4. Market Analysis, Insights and Forecast - by End User
- 10.4.1. Water and Wastewater
- 10.4.2. Oil and Gas Industry
- 10.4.3. Mining and Construction Industry
- 10.4.4. Other End Users
- 10.1. Market Analysis, Insights and Forecast - by Type
- 11. North America Submersible Pump Industry Analysis, Insights and Forecast, 2019-2031
- 11.1. Market Analysis, Insights and Forecast - By Country/Sub-region
- 11.1.1 United States
- 11.1.2 Canada
- 11.1.3 Rest of North America
- 12. Europe Submersible Pump Industry Analysis, Insights and Forecast, 2019-2031
- 12.1. Market Analysis, Insights and Forecast - By Country/Sub-region
- 12.1.1 Germany
- 12.1.2 France
- 12.1.3 United Kingdom
- 12.1.4 Spain
- 12.1.5 Nordic Countries
- 12.1.6 Turkey
- 12.1.7 Russia
- 12.1.8 Rest of Europe
- 13. Asia Pacific Submersible Pump Industry Analysis, Insights and Forecast, 2019-2031
- 13.1. Market Analysis, Insights and Forecast - By Country/Sub-region
- 13.1.1 China
- 13.1.2 India
- 13.1.3 Japan
- 13.1.4 South Korea
- 13.1.5 Malaysia
- 13.1.6 Thailand
- 13.1.7 Indonesia
- 13.1.8 Vietnam
- 13.1.9 Rest of Asia Pacific
- 14. South America Submersible Pump Industry Analysis, Insights and Forecast, 2019-2031
- 14.1. Market Analysis, Insights and Forecast - By Country/Sub-region
- 14.1.1 Brazil
- 14.1.2 Argentina
- 14.1.3 Colombia
- 14.1.4 Rest of South America
- 15. Middle East and Africa Submersible Pump Industry Analysis, Insights and Forecast, 2019-2031
- 15.1. Market Analysis, Insights and Forecast - By Country/Sub-region
- 15.1.1 Saudi Arabia
- 15.1.2 United Arab Emirates
- 15.1.3 South Africa
- 15.1.4 Nigeria
- 15.1.5 Qatar
- 15.1.6 Egypt
- 15.1.7 Rest of Middle East and Africa
- 16. Competitive Analysis
- 16.1. Global Market Share Analysis 2024
- 16.2. Company Profiles
- 16.2.1 ITT Goulds Pumps
- 16.2.1.1. Overview
- 16.2.1.2. Products
- 16.2.1.3. SWOT Analysis
- 16.2.1.4. Recent Developments
- 16.2.1.5. Financials (Based on Availability)
- 16.2.2 Grundfos Group
- 16.2.2.1. Overview
- 16.2.2.2. Products
- 16.2.2.3. SWOT Analysis
- 16.2.2.4. Recent Developments
- 16.2.2.5. Financials (Based on Availability)
- 16.2.3 Ebara Corporation
- 16.2.3.1. Overview
- 16.2.3.2. Products
- 16.2.3.3. SWOT Analysis
- 16.2.3.4. Recent Developments
- 16.2.3.5. Financials (Based on Availability)
- 16.2.4 Flowserve Corporation
- 16.2.4.1. Overview
- 16.2.4.2. Products
- 16.2.4.3. SWOT Analysis
- 16.2.4.4. Recent Developments
- 16.2.4.5. Financials (Based on Availability)
- 16.2.5 Weir Group PLC
- 16.2.5.1. Overview
- 16.2.5.2. Products
- 16.2.5.3. SWOT Analysis
- 16.2.5.4. Recent Developments
- 16.2.5.5. Financials (Based on Availability)
- 16.2.6 Atlas Copco AB
- 16.2.6.1. Overview
- 16.2.6.2. Products
- 16.2.6.3. SWOT Analysis
- 16.2.6.4. Recent Developments
- 16.2.6.5. Financials (Based on Availability)
- 16.2.7 Baker Hughes Co
- 16.2.7.1. Overview
- 16.2.7.2. Products
- 16.2.7.3. SWOT Analysis
- 16.2.7.4. Recent Developments
- 16.2.7.5. Financials (Based on Availability)
- 16.2.8 Franklin Electric Co Inc
- 16.2.8.1. Overview
- 16.2.8.2. Products
- 16.2.8.3. SWOT Analysis
- 16.2.8.4. Recent Developments
- 16.2.8.5. Financials (Based on Availability)
- 16.2.9 Borets International Ltd
- 16.2.9.1. Overview
- 16.2.9.2. Products
- 16.2.9.3. SWOT Analysis
- 16.2.9.4. Recent Developments
- 16.2.9.5. Financials (Based on Availability)
- 16.2.10 Halliburton Co
- 16.2.10.1. Overview
- 16.2.10.2. Products
- 16.2.10.3. SWOT Analysis
- 16.2.10.4. Recent Developments
- 16.2.10.5. Financials (Based on Availability)
- 16.2.11 KSB AG*List Not Exhaustive 6 4 Market Ranking/Share Analysi
- 16.2.11.1. Overview
- 16.2.11.2. Products
- 16.2.11.3. SWOT Analysis
- 16.2.11.4. Recent Developments
- 16.2.11.5. Financials (Based on Availability)
- 16.2.12 The Gorman-Rupp Company
- 16.2.12.1. Overview
- 16.2.12.2. Products
- 16.2.12.3. SWOT Analysis
- 16.2.12.4. Recent Developments
- 16.2.12.5. Financials (Based on Availability)
- 16.2.13 Sulzer AG
- 16.2.13.1. Overview
- 16.2.13.2. Products
- 16.2.13.3. SWOT Analysis
- 16.2.13.4. Recent Developments
- 16.2.13.5. Financials (Based on Availability)
- 16.2.14 Schlumberger Limited
- 16.2.14.1. Overview
- 16.2.14.2. Products
- 16.2.14.3. SWOT Analysis
- 16.2.14.4. Recent Developments
- 16.2.14.5. Financials (Based on Availability)
- 16.2.1 ITT Goulds Pumps
List of Figures
- Figure 1: Global Submersible Pump Industry Revenue Breakdown (Million, %) by Region 2024 & 2032
- Figure 2: North America Submersible Pump Industry Revenue (Million), by Country 2024 & 2032
- Figure 3: North America Submersible Pump Industry Revenue Share (%), by Country 2024 & 2032
- Figure 4: Europe Submersible Pump Industry Revenue (Million), by Country 2024 & 2032
- Figure 5: Europe Submersible Pump Industry Revenue Share (%), by Country 2024 & 2032
- Figure 6: Asia Pacific Submersible Pump Industry Revenue (Million), by Country 2024 & 2032
- Figure 7: Asia Pacific Submersible Pump Industry Revenue Share (%), by Country 2024 & 2032
- Figure 8: South America Submersible Pump Industry Revenue (Million), by Country 2024 & 2032
- Figure 9: South America Submersible Pump Industry Revenue Share (%), by Country 2024 & 2032
- Figure 10: Middle East and Africa Submersible Pump Industry Revenue (Million), by Country 2024 & 2032
- Figure 11: Middle East and Africa Submersible Pump Industry Revenue Share (%), by Country 2024 & 2032
- Figure 12: North America Submersible Pump Industry Revenue (Million), by Type 2024 & 2032
- Figure 13: North America Submersible Pump Industry Revenue Share (%), by Type 2024 & 2032
- Figure 14: North America Submersible Pump Industry Revenue (Million), by Drive Type 2024 & 2032
- Figure 15: North America Submersible Pump Industry Revenue Share (%), by Drive Type 2024 & 2032
- Figure 16: North America Submersible Pump Industry Revenue (Million), by Head 2024 & 2032
- Figure 17: North America Submersible Pump Industry Revenue Share (%), by Head 2024 & 2032
- Figure 18: North America Submersible Pump Industry Revenue (Million), by End User 2024 & 2032
- Figure 19: North America Submersible Pump Industry Revenue Share (%), by End User 2024 & 2032
- Figure 20: North America Submersible Pump Industry Revenue (Million), by Country 2024 & 2032
- Figure 21: North America Submersible Pump Industry Revenue Share (%), by Country 2024 & 2032
- Figure 22: Europe Submersible Pump Industry Revenue (Million), by Type 2024 & 2032
- Figure 23: Europe Submersible Pump Industry Revenue Share (%), by Type 2024 & 2032
- Figure 24: Europe Submersible Pump Industry Revenue (Million), by Drive Type 2024 & 2032
- Figure 25: Europe Submersible Pump Industry Revenue Share (%), by Drive Type 2024 & 2032
- Figure 26: Europe Submersible Pump Industry Revenue (Million), by Head 2024 & 2032
- Figure 27: Europe Submersible Pump Industry Revenue Share (%), by Head 2024 & 2032
- Figure 28: Europe Submersible Pump Industry Revenue (Million), by End User 2024 & 2032
- Figure 29: Europe Submersible Pump Industry Revenue Share (%), by End User 2024 & 2032
- Figure 30: Europe Submersible Pump Industry Revenue (Million), by Country 2024 & 2032
- Figure 31: Europe Submersible Pump Industry Revenue Share (%), by Country 2024 & 2032
- Figure 32: Asia Pacific Submersible Pump Industry Revenue (Million), by Type 2024 & 2032
- Figure 33: Asia Pacific Submersible Pump Industry Revenue Share (%), by Type 2024 & 2032
- Figure 34: Asia Pacific Submersible Pump Industry Revenue (Million), by Drive Type 2024 & 2032
- Figure 35: Asia Pacific Submersible Pump Industry Revenue Share (%), by Drive Type 2024 & 2032
- Figure 36: Asia Pacific Submersible Pump Industry Revenue (Million), by Head 2024 & 2032
- Figure 37: Asia Pacific Submersible Pump Industry Revenue Share (%), by Head 2024 & 2032
- Figure 38: Asia Pacific Submersible Pump Industry Revenue (Million), by End User 2024 & 2032
- Figure 39: Asia Pacific Submersible Pump Industry Revenue Share (%), by End User 2024 & 2032
- Figure 40: Asia Pacific Submersible Pump Industry Revenue (Million), by Country 2024 & 2032
- Figure 41: Asia Pacific Submersible Pump Industry Revenue Share (%), by Country 2024 & 2032
- Figure 42: South America Submersible Pump Industry Revenue (Million), by Type 2024 & 2032
- Figure 43: South America Submersible Pump Industry Revenue Share (%), by Type 2024 & 2032
- Figure 44: South America Submersible Pump Industry Revenue (Million), by Drive Type 2024 & 2032
- Figure 45: South America Submersible Pump Industry Revenue Share (%), by Drive Type 2024 & 2032
- Figure 46: South America Submersible Pump Industry Revenue (Million), by Head 2024 & 2032
- Figure 47: South America Submersible Pump Industry Revenue Share (%), by Head 2024 & 2032
- Figure 48: South America Submersible Pump Industry Revenue (Million), by End User 2024 & 2032
- Figure 49: South America Submersible Pump Industry Revenue Share (%), by End User 2024 & 2032
- Figure 50: South America Submersible Pump Industry Revenue (Million), by Country 2024 & 2032
- Figure 51: South America Submersible Pump Industry Revenue Share (%), by Country 2024 & 2032
- Figure 52: Middle East and Africa Submersible Pump Industry Revenue (Million), by Type 2024 & 2032
- Figure 53: Middle East and Africa Submersible Pump Industry Revenue Share (%), by Type 2024 & 2032
- Figure 54: Middle East and Africa Submersible Pump Industry Revenue (Million), by Drive Type 2024 & 2032
- Figure 55: Middle East and Africa Submersible Pump Industry Revenue Share (%), by Drive Type 2024 & 2032
- Figure 56: Middle East and Africa Submersible Pump Industry Revenue (Million), by Head 2024 & 2032
- Figure 57: Middle East and Africa Submersible Pump Industry Revenue Share (%), by Head 2024 & 2032
- Figure 58: Middle East and Africa Submersible Pump Industry Revenue (Million), by End User 2024 & 2032
- Figure 59: Middle East and Africa Submersible Pump Industry Revenue Share (%), by End User 2024 & 2032
- Figure 60: Middle East and Africa Submersible Pump Industry Revenue (Million), by Country 2024 & 2032
- Figure 61: Middle East and Africa Submersible Pump Industry Revenue Share (%), by Country 2024 & 2032
List of Tables
- Table 1: Global Submersible Pump Industry Revenue Million Forecast, by Region 2019 & 2032
- Table 2: Global Submersible Pump Industry Revenue Million Forecast, by Type 2019 & 2032
- Table 3: Global Submersible Pump Industry Revenue Million Forecast, by Drive Type 2019 & 2032
- Table 4: Global Submersible Pump Industry Revenue Million Forecast, by Head 2019 & 2032
- Table 5: Global Submersible Pump Industry Revenue Million Forecast, by End User 2019 & 2032
- Table 6: Global Submersible Pump Industry Revenue Million Forecast, by Region 2019 & 2032
- Table 7: Global Submersible Pump Industry Revenue Million Forecast, by Country 2019 & 2032
- Table 8: United States Submersible Pump Industry Revenue (Million) Forecast, by Application 2019 & 2032
- Table 9: Canada Submersible Pump Industry Revenue (Million) Forecast, by Application 2019 & 2032
- Table 10: Rest of North America Submersible Pump Industry Revenue (Million) Forecast, by Application 2019 & 2032
- Table 11: Global Submersible Pump Industry Revenue Million Forecast, by Country 2019 & 2032
- Table 12: Germany Submersible Pump Industry Revenue (Million) Forecast, by Application 2019 & 2032
- Table 13: France Submersible Pump Industry Revenue (Million) Forecast, by Application 2019 & 2032
- Table 14: United Kingdom Submersible Pump Industry Revenue (Million) Forecast, by Application 2019 & 2032
- Table 15: Spain Submersible Pump Industry Revenue (Million) Forecast, by Application 2019 & 2032
- Table 16: Nordic Countries Submersible Pump Industry Revenue (Million) Forecast, by Application 2019 & 2032
- Table 17: Turkey Submersible Pump Industry Revenue (Million) Forecast, by Application 2019 & 2032
- Table 18: Russia Submersible Pump Industry Revenue (Million) Forecast, by Application 2019 & 2032
- Table 19: Rest of Europe Submersible Pump Industry Revenue (Million) Forecast, by Application 2019 & 2032
- Table 20: Global Submersible Pump Industry Revenue Million Forecast, by Country 2019 & 2032
- Table 21: China Submersible Pump Industry Revenue (Million) Forecast, by Application 2019 & 2032
- Table 22: India Submersible Pump Industry Revenue (Million) Forecast, by Application 2019 & 2032
- Table 23: Japan Submersible Pump Industry Revenue (Million) Forecast, by Application 2019 & 2032
- Table 24: South Korea Submersible Pump Industry Revenue (Million) Forecast, by Application 2019 & 2032
- Table 25: Malaysia Submersible Pump Industry Revenue (Million) Forecast, by Application 2019 & 2032
- Table 26: Thailand Submersible Pump Industry Revenue (Million) Forecast, by Application 2019 & 2032
- Table 27: Indonesia Submersible Pump Industry Revenue (Million) Forecast, by Application 2019 & 2032
- Table 28: Vietnam Submersible Pump Industry Revenue (Million) Forecast, by Application 2019 & 2032
- Table 29: Rest of Asia Pacific Submersible Pump Industry Revenue (Million) Forecast, by Application 2019 & 2032
- Table 30: Global Submersible Pump Industry Revenue Million Forecast, by Country 2019 & 2032
- Table 31: Brazil Submersible Pump Industry Revenue (Million) Forecast, by Application 2019 & 2032
- Table 32: Argentina Submersible Pump Industry Revenue (Million) Forecast, by Application 2019 & 2032
- Table 33: Colombia Submersible Pump Industry Revenue (Million) Forecast, by Application 2019 & 2032
- Table 34: Rest of South America Submersible Pump Industry Revenue (Million) Forecast, by Application 2019 & 2032
- Table 35: Global Submersible Pump Industry Revenue Million Forecast, by Country 2019 & 2032
- Table 36: Saudi Arabia Submersible Pump Industry Revenue (Million) Forecast, by Application 2019 & 2032
- Table 37: United Arab Emirates Submersible Pump Industry Revenue (Million) Forecast, by Application 2019 & 2032
- Table 38: South Africa Submersible Pump Industry Revenue (Million) Forecast, by Application 2019 & 2032
- Table 39: Nigeria Submersible Pump Industry Revenue (Million) Forecast, by Application 2019 & 2032
- Table 40: Qatar Submersible Pump Industry Revenue (Million) Forecast, by Application 2019 & 2032
- Table 41: Egypt Submersible Pump Industry Revenue (Million) Forecast, by Application 2019 & 2032
- Table 42: Rest of Middle East and Africa Submersible Pump Industry Revenue (Million) Forecast, by Application 2019 & 2032
- Table 43: Global Submersible Pump Industry Revenue Million Forecast, by Type 2019 & 2032
- Table 44: Global Submersible Pump Industry Revenue Million Forecast, by Drive Type 2019 & 2032
- Table 45: Global Submersible Pump Industry Revenue Million Forecast, by Head 2019 & 2032
- Table 46: Global Submersible Pump Industry Revenue Million Forecast, by End User 2019 & 2032
- Table 47: Global Submersible Pump Industry Revenue Million Forecast, by Country 2019 & 2032
- Table 48: United States Submersible Pump Industry Revenue (Million) Forecast, by Application 2019 & 2032
- Table 49: Canada Submersible Pump Industry Revenue (Million) Forecast, by Application 2019 & 2032
- Table 50: Rest of North America Submersible Pump Industry Revenue (Million) Forecast, by Application 2019 & 2032
- Table 51: Global Submersible Pump Industry Revenue Million Forecast, by Type 2019 & 2032
- Table 52: Global Submersible Pump Industry Revenue Million Forecast, by Drive Type 2019 & 2032
- Table 53: Global Submersible Pump Industry Revenue Million Forecast, by Head 2019 & 2032
- Table 54: Global Submersible Pump Industry Revenue Million Forecast, by End User 2019 & 2032
- Table 55: Global Submersible Pump Industry Revenue Million Forecast, by Country 2019 & 2032
- Table 56: Germany Submersible Pump Industry Revenue (Million) Forecast, by Application 2019 & 2032
- Table 57: France Submersible Pump Industry Revenue (Million) Forecast, by Application 2019 & 2032
- Table 58: United Kingdom Submersible Pump Industry Revenue (Million) Forecast, by Application 2019 & 2032
- Table 59: Spain Submersible Pump Industry Revenue (Million) Forecast, by Application 2019 & 2032
- Table 60: Nordic Countries Submersible Pump Industry Revenue (Million) Forecast, by Application 2019 & 2032
- Table 61: Turkey Submersible Pump Industry Revenue (Million) Forecast, by Application 2019 & 2032
- Table 62: Russia Submersible Pump Industry Revenue (Million) Forecast, by Application 2019 & 2032
- Table 63: Rest of Europe Submersible Pump Industry Revenue (Million) Forecast, by Application 2019 & 2032
- Table 64: Global Submersible Pump Industry Revenue Million Forecast, by Type 2019 & 2032
- Table 65: Global Submersible Pump Industry Revenue Million Forecast, by Drive Type 2019 & 2032
- Table 66: Global Submersible Pump Industry Revenue Million Forecast, by Head 2019 & 2032
- Table 67: Global Submersible Pump Industry Revenue Million Forecast, by End User 2019 & 2032
- Table 68: Global Submersible Pump Industry Revenue Million Forecast, by Country 2019 & 2032
- Table 69: China Submersible Pump Industry Revenue (Million) Forecast, by Application 2019 & 2032
- Table 70: India Submersible Pump Industry Revenue (Million) Forecast, by Application 2019 & 2032
- Table 71: Japan Submersible Pump Industry Revenue (Million) Forecast, by Application 2019 & 2032
- Table 72: South Korea Submersible Pump Industry Revenue (Million) Forecast, by Application 2019 & 2032
- Table 73: Malaysia Submersible Pump Industry Revenue (Million) Forecast, by Application 2019 & 2032
- Table 74: Thailand Submersible Pump Industry Revenue (Million) Forecast, by Application 2019 & 2032
- Table 75: Indonesia Submersible Pump Industry Revenue (Million) Forecast, by Application 2019 & 2032
- Table 76: Vietnam Submersible Pump Industry Revenue (Million) Forecast, by Application 2019 & 2032
- Table 77: Rest of Asia Pacific Submersible Pump Industry Revenue (Million) Forecast, by Application 2019 & 2032
- Table 78: Global Submersible Pump Industry Revenue Million Forecast, by Type 2019 & 2032
- Table 79: Global Submersible Pump Industry Revenue Million Forecast, by Drive Type 2019 & 2032
- Table 80: Global Submersible Pump Industry Revenue Million Forecast, by Head 2019 & 2032
- Table 81: Global Submersible Pump Industry Revenue Million Forecast, by End User 2019 & 2032
- Table 82: Global Submersible Pump Industry Revenue Million Forecast, by Country 2019 & 2032
- Table 83: Brazil Submersible Pump Industry Revenue (Million) Forecast, by Application 2019 & 2032
- Table 84: Argentina Submersible Pump Industry Revenue (Million) Forecast, by Application 2019 & 2032
- Table 85: Colombia Submersible Pump Industry Revenue (Million) Forecast, by Application 2019 & 2032
- Table 86: Rest of South America Submersible Pump Industry Revenue (Million) Forecast, by Application 2019 & 2032
- Table 87: Global Submersible Pump Industry Revenue Million Forecast, by Type 2019 & 2032
- Table 88: Global Submersible Pump Industry Revenue Million Forecast, by Drive Type 2019 & 2032
- Table 89: Global Submersible Pump Industry Revenue Million Forecast, by Head 2019 & 2032
- Table 90: Global Submersible Pump Industry Revenue Million Forecast, by End User 2019 & 2032
- Table 91: Global Submersible Pump Industry Revenue Million Forecast, by Country 2019 & 2032
- Table 92: Saudi Arabia Submersible Pump Industry Revenue (Million) Forecast, by Application 2019 & 2032
- Table 93: United Arab Emirates Submersible Pump Industry Revenue (Million) Forecast, by Application 2019 & 2032
- Table 94: South Africa Submersible Pump Industry Revenue (Million) Forecast, by Application 2019 & 2032
- Table 95: Nigeria Submersible Pump Industry Revenue (Million) Forecast, by Application 2019 & 2032
- Table 96: Qatar Submersible Pump Industry Revenue (Million) Forecast, by Application 2019 & 2032
- Table 97: Egypt Submersible Pump Industry Revenue (Million) Forecast, by Application 2019 & 2032
- Table 98: Rest of Middle East and Africa Submersible Pump Industry Revenue (Million) Forecast, by Application 2019 & 2032
Frequently Asked Questions
1. What is the projected Compound Annual Growth Rate (CAGR) of the Submersible Pump Industry?
The projected CAGR is approximately 8.20%.
2. Which companies are prominent players in the Submersible Pump Industry?
Key companies in the market include ITT Goulds Pumps, Grundfos Group, Ebara Corporation, Flowserve Corporation, Weir Group PLC, Atlas Copco AB, Baker Hughes Co, Franklin Electric Co Inc, Borets International Ltd, Halliburton Co, KSB AG*List Not Exhaustive 6 4 Market Ranking/Share Analysi, The Gorman-Rupp Company, Sulzer AG, Schlumberger Limited.
3. What are the main segments of the Submersible Pump Industry?
The market segments include Type, Drive Type, Head, End User.
4. Can you provide details about the market size?
The market size is estimated to be USD 18.83 Million as of 2022.
5. What are some drivers contributing to market growth?
4.; Rapid Recovery in the Oil and Gas and Mining Industries4.; Surge in the Construction Industry.
6. What are the notable trends driving market growth?
The Oil and Gas Industry is Expected to Dominate the Market.
7. Are there any restraints impacting market growth?
4.; High Maintenance and Operation Costs of Submersible Pump Restrain the Market.
8. Can you provide examples of recent developments in the market?
In May 2023, Curtiss-Wright Corporation announced to sign an agreement with Shell Plc to test, manufacture, and provide operational support for an electro-submersible pump for a for a Shell offshore platform in the Gulf of Mexico. The goal of this initiative is to Curtiss-Wright's canned motor technology as an effective and reliable alternative to current subsea pump technologies.
9. What pricing options are available for accessing the report?
Pricing options include single-user, multi-user, and enterprise licenses priced at USD 4750, USD 5250, and USD 8750 respectively.
10. Is the market size provided in terms of value or volume?
The market size is provided in terms of value, measured in Million.
11. Are there any specific market keywords associated with the report?
Yes, the market keyword associated with the report is "Submersible Pump Industry," which aids in identifying and referencing the specific market segment covered.
12. How do I determine which pricing option suits my needs best?
The pricing options vary based on user requirements and access needs. Individual users may opt for single-user licenses, while businesses requiring broader access may choose multi-user or enterprise licenses for cost-effective access to the report.
13. Are there any additional resources or data provided in the Submersible Pump Industry report?
While the report offers comprehensive insights, it's advisable to review the specific contents or supplementary materials provided to ascertain if additional resources or data are available.
14. How can I stay updated on further developments or reports in the Submersible Pump Industry?
To stay informed about further developments, trends, and reports in the Submersible Pump Industry, consider subscribing to industry newsletters, following relevant companies and organizations, or regularly checking reputable industry news sources and publications.
Methodology
Step 1 - Identification of Relevant Samples Size from Population Database


Step 2 - Approaches for Defining Global Market Size (Value, Volume* & Price*)

Note*: In applicable scenarios
Step 3 - Data Sources
Primary Research
- Web Analytics
- Survey Reports
- Research Institute
- Latest Research Reports
- Opinion Leaders
Secondary Research
- Annual Reports
- White Paper
- Latest Press Release
- Industry Association
- Paid Database
- Investor Presentations

Step 4 - Data Triangulation
Involves using different sources of information in order to increase the validity of a study
These sources are likely to be stakeholders in a program - participants, other researchers, program staff, other community members, and so on.
Then we put all data in single framework & apply various statistical tools to find out the dynamic on the market.
During the analysis stage, feedback from the stakeholder groups would be compared to determine areas of agreement as well as areas of divergence
