

Key Insights
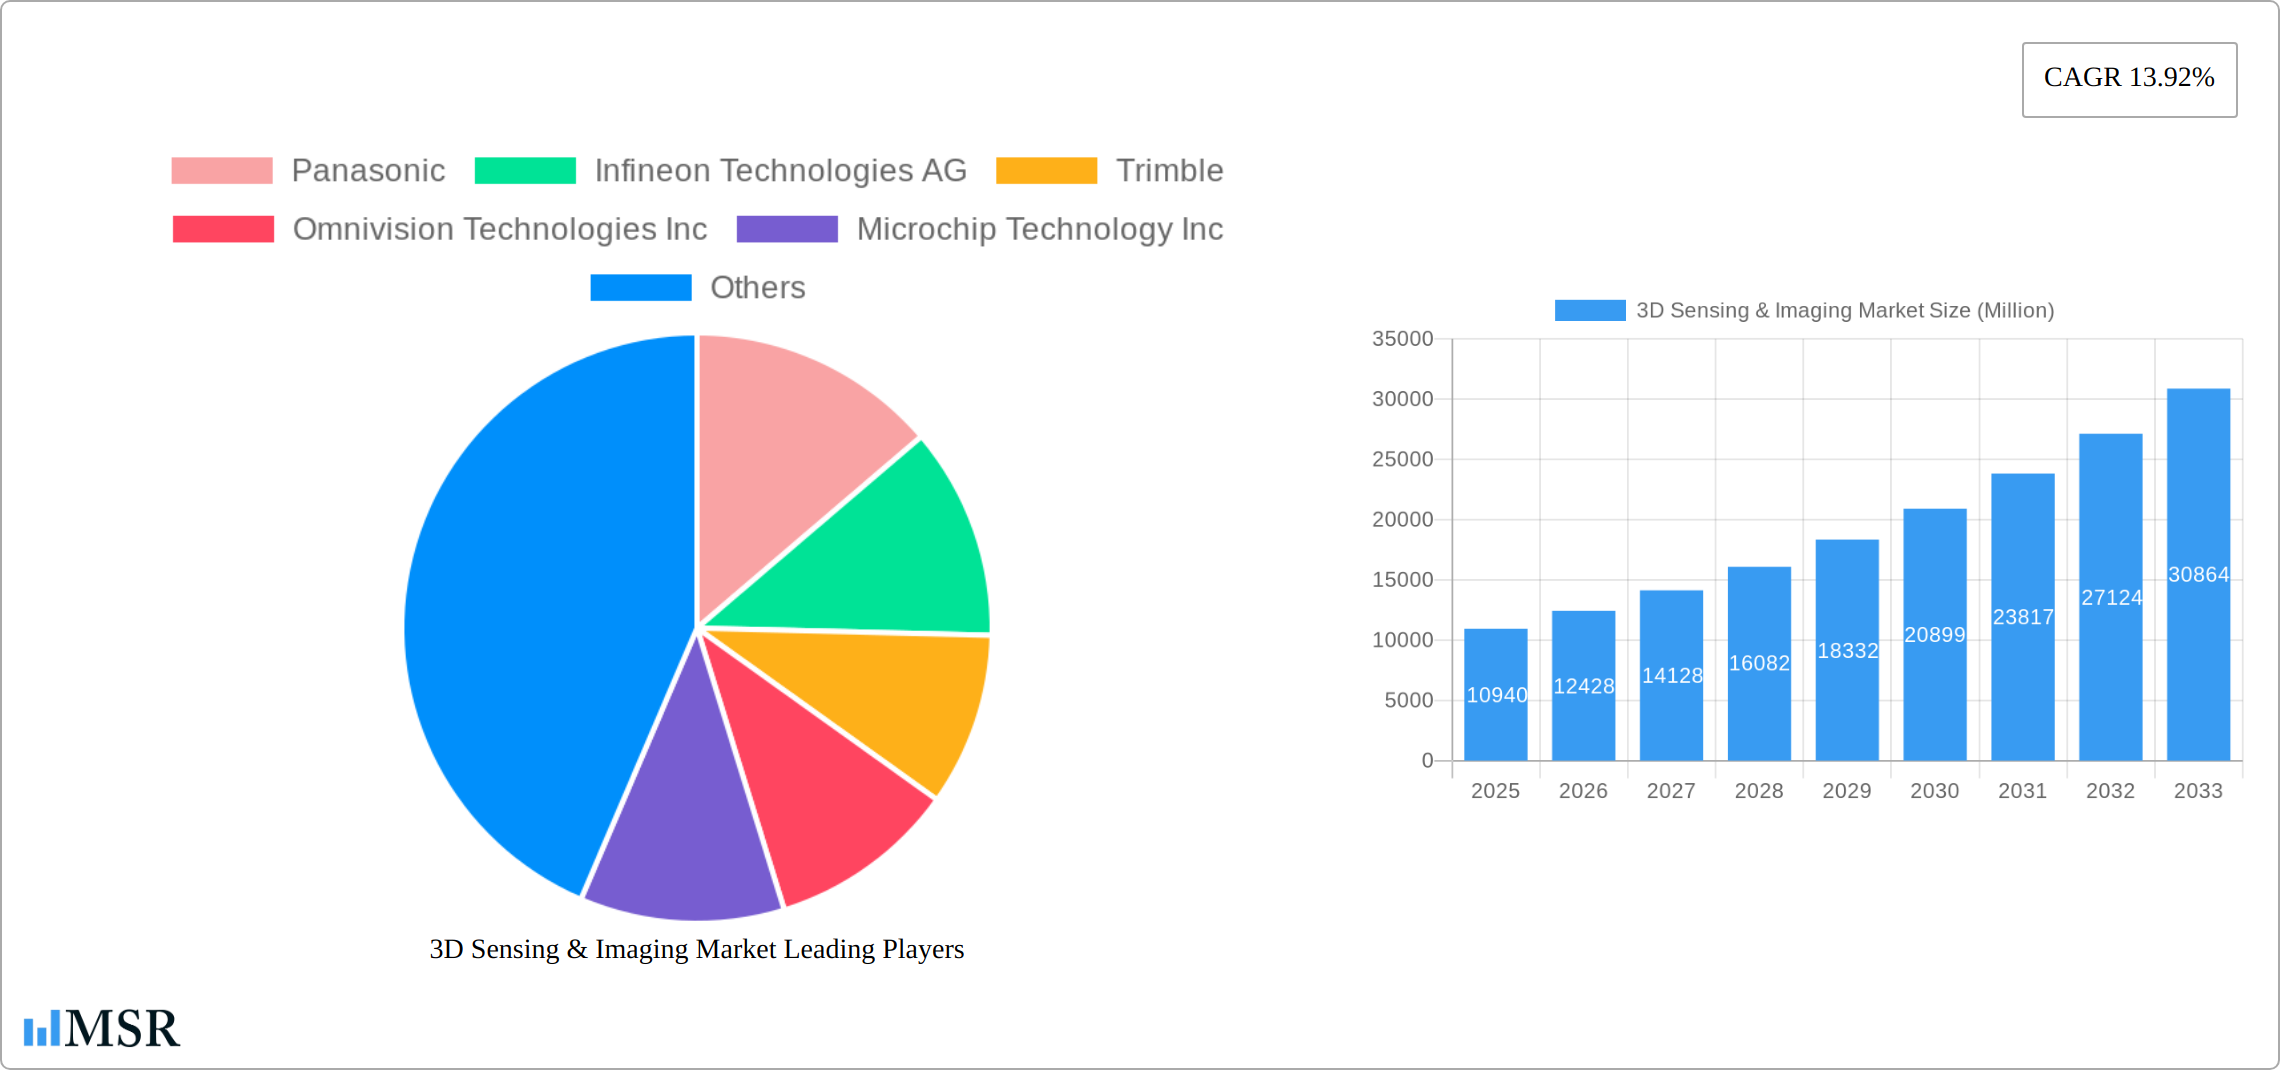
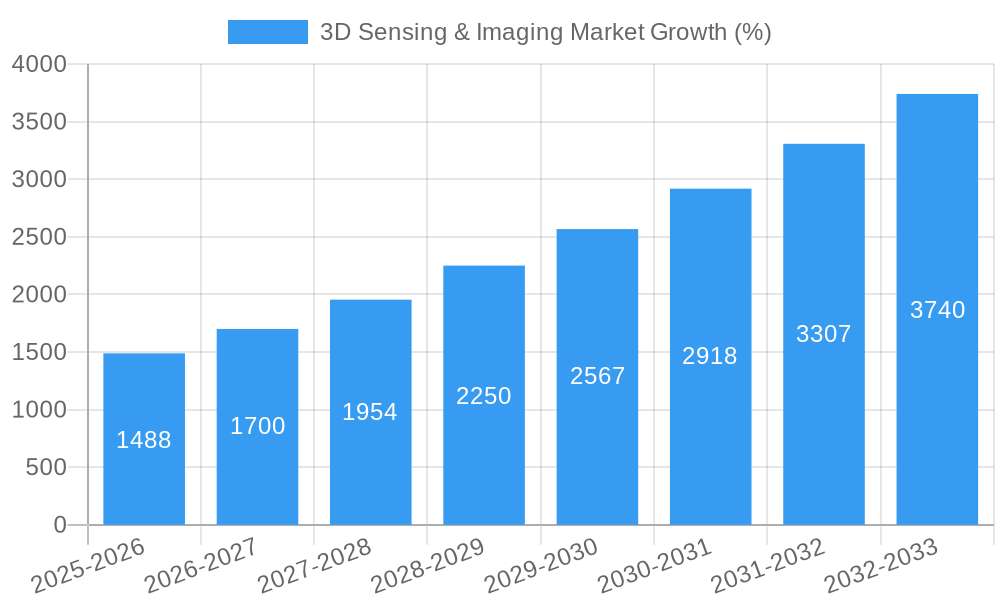
The 3D sensing and imaging market is experiencing robust growth, projected to reach \$10.94 billion in 2025 and maintain a Compound Annual Growth Rate (CAGR) of 13.92% from 2025 to 2033. This expansion is fueled by several key drivers. The increasing adoption of 3D sensing technologies across diverse end-user industries like consumer electronics (driven by the demand for advanced features in smartphones and gaming consoles), automotive (for advanced driver-assistance systems and autonomous driving), and healthcare (for medical imaging and minimally invasive surgeries) is a significant factor. Further advancements in technology, such as the improvement in accuracy and resolution of Time-of-Flight and Structured Light sensors, are lowering costs and expanding application possibilities. The growing demand for enhanced security and surveillance systems, coupled with the rising popularity of immersive experiences in media and entertainment, also contribute to this market's growth trajectory. While challenges such as high initial investment costs and the complexity of integrating 3D sensing systems into existing infrastructure exist, the overall market outlook remains positive due to continuous technological innovation and expanding application areas.
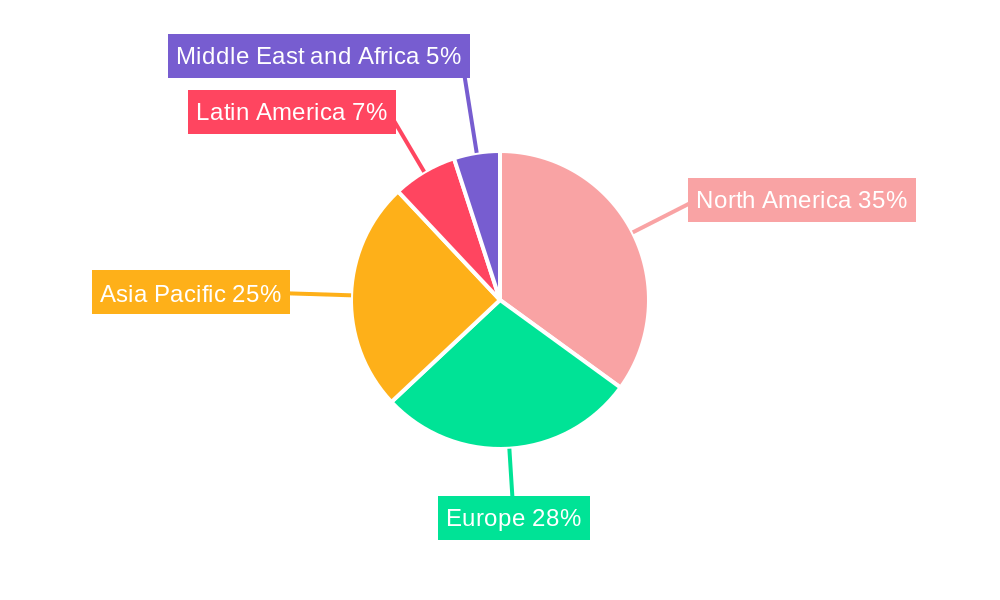
The market segmentation reveals significant opportunities across various components (hardware, software, and services), technologies (Ultrasound, Structured Light, Time of Flight, Stereoscopic Vision), sensor types (position, image, temperature, accelerometer, proximity), and connectivity options (wired and wireless). Leading players like Panasonic, Infineon Technologies, Trimble, and others are actively investing in research and development to maintain their competitive edge. Geographical distribution suggests a strong presence across North America, Europe, and the Asia-Pacific region, with the latter expected to witness significant growth in the coming years, driven by rising smartphone adoption and industrial automation. The competitive landscape is dynamic, characterized by both established players and emerging startups, leading to ongoing innovation and consolidation within the market. The forecast period of 2025-2033 anticipates sustained growth, particularly in regions with rapidly developing technological infrastructure and expanding consumer demand.
3D Sensing & Imaging Market Report: 2019-2033
This comprehensive report provides an in-depth analysis of the 3D Sensing & Imaging market, offering valuable insights for stakeholders across the value chain. The study covers the period 2019-2033, with a focus on the forecast period 2025-2033 and a base year of 2025. The report analyzes market dynamics, key segments, leading players (including Panasonic, Infineon Technologies AG, Trimble, and more), and emerging trends shaping this rapidly evolving sector. Expect detailed breakdowns by technology (Time of Flight, Structured Light, etc.), end-user industry (Automotive, Healthcare, Consumer Electronics, etc.), and component (Hardware, Software, Services). Discover crucial market size estimations (in Millions) and CAGR projections, alongside actionable insights to navigate the competitive landscape and capitalize on future opportunities.
3D Sensing & Imaging Market Concentration & Dynamics
The 3D Sensing & Imaging market exhibits a moderately concentrated structure, with several major players holding significant market share. However, the presence of numerous smaller, specialized companies fosters a dynamic competitive landscape. Innovation is a key driver, with continuous advancements in sensor technologies, processing power, and algorithms. Regulatory frameworks, particularly concerning data privacy and safety standards, play a significant role in shaping market growth. Substitute products, such as traditional 2D imaging systems, exert competitive pressure, though the unique capabilities of 3D sensing are increasingly favored in various applications. End-user trends towards automation, personalization, and improved user experiences fuel market demand. M&A activity is prevalent, reflecting consolidation efforts and attempts to expand market reach and technological capabilities.
- Market Concentration: The top 5 players account for approximately xx% of the market share in 2025.
- Innovation Ecosystems: Strong collaboration between technology providers, research institutions, and end-users drives innovation.
- Regulatory Frameworks: Compliance with data privacy regulations (e.g., GDPR) and safety standards (e.g., automotive safety standards) are crucial.
- Substitute Products: 2D imaging remains a competitive alternative in some segments, but 3D offers advantages in depth perception and object recognition.
- End-User Trends: Demand for automation, enhanced user experiences, and personalized products drives adoption.
- M&A Activity: An estimated xx M&A deals occurred in the 3D sensing and imaging sector between 2019 and 2024.
3D Sensing & Imaging Market Industry Insights & Trends
The 3D Sensing & Imaging market is experiencing robust growth, driven by the increasing demand for advanced imaging capabilities across diverse industries. The market size was valued at $xx Million in 2024 and is projected to reach $xx Million by 2033, exhibiting a CAGR of xx% during the forecast period. Several factors contribute to this growth trajectory. Technological advancements, particularly in Time-of-Flight (ToF) and Structured Light technologies, are continuously improving sensor performance, accuracy, and affordability. Consumer preference for immersive and interactive experiences is driving adoption in consumer electronics and media & entertainment. Furthermore, the rise of autonomous vehicles, robotics, and advanced healthcare applications fuels significant demand for high-precision 3D sensing solutions. Disruptions stemming from new entrants and innovative technologies maintain a dynamic market environment.
Key Markets & Segments Leading 3D Sensing & Imaging Market
The Automotive sector is currently the leading end-user industry for 3D sensing & imaging, driven by the rapid adoption of Advanced Driver-Assistance Systems (ADAS) and autonomous driving technologies. However, the Consumer Electronics segment is anticipated to witness significant growth in the coming years, propelled by the increasing demand for 3D sensing in smartphones, augmented reality (AR), and virtual reality (VR) devices.
Key Market Drivers:
- Automotive: ADAS, autonomous driving, and parking assistance systems.
- Consumer Electronics: Smartphones, AR/VR devices, gaming consoles.
- Healthcare: Medical imaging, robotic surgery, and diagnostics.
- Aerospace & Defense: Navigation, surveillance, and target acquisition.
- Security & Surveillance: Facial recognition, perimeter security, and object detection.
- Media and Entertainment: 3D filmmaking, virtual production, and immersive gaming.
Dominant Segments:
- Technology: Time-of-Flight (ToF) and Structured Light dominate due to their balance of performance and cost-effectiveness.
- Component: Hardware holds the largest market share, but software and services are growing rapidly.
- Type: Image sensors are the most prevalent type, followed by position sensors.
- Connectivity: Wireless network connectivity is gaining traction due to its flexibility and ease of integration.
Regional Dominance: North America and Asia Pacific currently hold the largest market share, but growth is projected to be strong across all major regions.
3D Sensing & Imaging Market Product Developments
Recent advancements in 3D sensing and imaging have led to the development of smaller, more energy-efficient, and cost-effective sensors with improved accuracy and resolution. This progress has broadened the applications of 3D sensing across various industries, from consumer electronics to autonomous vehicles. The integration of artificial intelligence (AI) and machine learning (ML) algorithms further enhances the capabilities of 3D sensing systems, enabling advanced features like object recognition, scene understanding, and gesture control. This evolution translates to a competitive advantage for companies offering superior performance and innovative features.
Challenges in the 3D Sensing & Imaging Market Market
Several challenges hinder the growth of the 3D Sensing & Imaging market. High manufacturing costs and complexity, particularly for advanced technologies like LiDAR, pose significant barriers to wider adoption. Supply chain disruptions and the availability of specialized components can also impact production and market availability. Furthermore, stringent regulatory requirements and safety standards, particularly in the automotive and healthcare sectors, add to the complexity and cost. Intense competition among established players and emerging startups intensifies the pressure on margins and market share. These factors collectively restrain the market's growth rate.
Forces Driving 3D Sensing & Imaging Market Growth
Technological advancements are the primary force driving market growth. Improvements in sensor technology, processing power, and algorithms enhance accuracy, resolution, and affordability. Economic factors, such as rising disposable incomes and increased investments in automation across various industries, also fuel demand. Supportive government regulations, promoting the adoption of advanced technologies in key sectors (e.g., autonomous vehicles), further stimulate market growth. The increasing demand for enhanced user experiences and immersive technologies across multiple applications fuels market expansion.
Challenges in the 3D Sensing & Imaging Market Market
Long-term growth hinges on continued technological innovation, particularly in areas like miniaturization, power efficiency, and cost reduction. Strategic partnerships between technology providers and end-user industries can accelerate adoption. Market expansion into new applications and emerging regions presents significant opportunities for long-term growth. Addressing current challenges (like supply chain constraints and regulatory hurdles) will be crucial for sustained expansion.
Emerging Opportunities in 3D Sensing & Imaging Market
Emerging trends like the metaverse and the Internet of Things (IoT) present significant opportunities for the 3D sensing & imaging market. The demand for highly accurate depth sensing in AR/VR applications is driving innovation. New applications in areas like smart homes, robotics, and industrial automation are also emerging. The growing focus on healthcare applications, including remote patient monitoring and minimally invasive surgery, offers significant potential for growth. Consumer preference for more immersive and interactive experiences fuels demand for improved 3D sensing capabilities.
Leading Players in the 3D Sensing & Imaging Market Sector
- Panasonic
- Infineon Technologies AG
- Trimble
- Omnivision Technologies Inc
- Microchip Technology Inc
- GE Healthcare
- Lockheed Martin
- Adobe
- STMicroelectronics
- Sick AG
- Faro
- Texas Instruments Incorporated
- Autodesk
- Keyence
- Dassault Systèmes
- Qualcomm Inc
Key Milestones in 3D Sensing & Imaging Market Industry
- December 2021: LIPS Corporation unveiled new 3D structured light cameras targeting smart factories, healthcare, and the metaverse.
- January 2022: Pmdtechnologies AG launched the flexx2 3D time-of-flight development kit, featuring improved depth-sensing performance.
- March 2022: LIPS Corporation and Newsight Imaging signed an MoU to develop eTOF-based 3D vision systems for Industry 4.0 and AIoT.
Strategic Outlook for 3D Sensing & Imaging Market Market
The 3D Sensing & Imaging market is poised for substantial growth, driven by ongoing technological advancements and increasing adoption across diverse sectors. Strategic partnerships, investments in R&D, and expansion into new applications will be crucial for success. Companies focusing on innovation, cost optimization, and efficient supply chains will be best positioned to capitalize on the market's future potential. The market's trajectory is positive, fueled by expanding applications and technological improvements.
3D Sensing & Imaging Market Segmentation
-
1. Component
- 1.1. Hardware
- 1.2. Software
- 1.3. Services
-
2. Technology
- 2.1. Ultrasound
- 2.2. Structured Light
- 2.3. Time of Flight
- 2.4. Stereoscopic Vision
- 2.5. Other Technologies
-
3. Type
- 3.1. Position Sensor
- 3.2. Image Sensor
- 3.3. Temperature Sensor
- 3.4. Accelerometer Sensor
- 3.5. Proximity Sensor
- 3.6. Other Types
-
4. Connectivity
- 4.1. Wired Network Connectivity
- 4.2. Wireless Network Connectivity
-
5. End-user Industry
- 5.1. Consumer Electronics
- 5.2. Automotive
- 5.3. Healthcare
- 5.4. Aerospace and Defense
- 5.5. Security and Surveillance
- 5.6. Media and Entertainment
- 5.7. Other End-user Industries
3D Sensing & Imaging Market Segmentation By Geography
- 1. North America
- 2. Europe
- 3. Asia Pacific
- 4. Middle East and Africa
- 5. Latin America
3D Sensing & Imaging Market REPORT HIGHLIGHTS
| Aspects | Details |
|---|---|
| Study Period | 2019-2033 |
| Base Year | 2024 |
| Estimated Year | 2025 |
| Forecast Period | 2025-2033 |
| Historical Period | 2019-2024 |
| Growth Rate | CAGR of 13.92% from 2019-2033 |
| Segmentation |
|
Table of Contents
- 1. Introduction
- 1.1. Research Scope
- 1.2. Market Segmentation
- 1.3. Research Methodology
- 1.4. Definitions and Assumptions
- 2. Executive Summary
- 2.1. Introduction
- 3. Market Dynamics
- 3.1. Introduction
- 3.2. Market Drivers
- 3.2.1. Integration of Optical and Electronic Components in Miniaturized Electronics Devices; Rising Demand for 3D-Enabled Devices in Consumer Electronics; Growing Penetration of Image Sensors in Automobiles; Growing Requirement of Security and Surveillance Systems
- 3.3. Market Restrains
- 3.3.1. High Manufacturing Cost of Image Sensors; Limited Integration With Other Devices; High Cost Required for the Maintenance of these Devices
- 3.4. Market Trends
- 3.4.1. Automotive Sector Expected to Drive Market Growth
- 4. Market Factor Analysis
- 4.1. Porters Five Forces
- 4.2. Supply/Value Chain
- 4.3. PESTEL analysis
- 4.4. Market Entropy
- 4.5. Patent/Trademark Analysis
- 5. Global 3D Sensing & Imaging Market Analysis, Insights and Forecast, 2019-2031
- 5.1. Market Analysis, Insights and Forecast - by Component
- 5.1.1. Hardware
- 5.1.2. Software
- 5.1.3. Services
- 5.2. Market Analysis, Insights and Forecast - by Technology
- 5.2.1. Ultrasound
- 5.2.2. Structured Light
- 5.2.3. Time of Flight
- 5.2.4. Stereoscopic Vision
- 5.2.5. Other Technologies
- 5.3. Market Analysis, Insights and Forecast - by Type
- 5.3.1. Position Sensor
- 5.3.2. Image Sensor
- 5.3.3. Temperature Sensor
- 5.3.4. Accelerometer Sensor
- 5.3.5. Proximity Sensor
- 5.3.6. Other Types
- 5.4. Market Analysis, Insights and Forecast - by Connectivity
- 5.4.1. Wired Network Connectivity
- 5.4.2. Wireless Network Connectivity
- 5.5. Market Analysis, Insights and Forecast - by End-user Industry
- 5.5.1. Consumer Electronics
- 5.5.2. Automotive
- 5.5.3. Healthcare
- 5.5.4. Aerospace and Defense
- 5.5.5. Security and Surveillance
- 5.5.6. Media and Entertainment
- 5.5.7. Other End-user Industries
- 5.6. Market Analysis, Insights and Forecast - by Region
- 5.6.1. North America
- 5.6.2. Europe
- 5.6.3. Asia Pacific
- 5.6.4. Middle East and Africa
- 5.6.5. Latin America
- 5.1. Market Analysis, Insights and Forecast - by Component
- 6. North America 3D Sensing & Imaging Market Analysis, Insights and Forecast, 2019-2031
- 6.1. Market Analysis, Insights and Forecast - by Component
- 6.1.1. Hardware
- 6.1.2. Software
- 6.1.3. Services
- 6.2. Market Analysis, Insights and Forecast - by Technology
- 6.2.1. Ultrasound
- 6.2.2. Structured Light
- 6.2.3. Time of Flight
- 6.2.4. Stereoscopic Vision
- 6.2.5. Other Technologies
- 6.3. Market Analysis, Insights and Forecast - by Type
- 6.3.1. Position Sensor
- 6.3.2. Image Sensor
- 6.3.3. Temperature Sensor
- 6.3.4. Accelerometer Sensor
- 6.3.5. Proximity Sensor
- 6.3.6. Other Types
- 6.4. Market Analysis, Insights and Forecast - by Connectivity
- 6.4.1. Wired Network Connectivity
- 6.4.2. Wireless Network Connectivity
- 6.5. Market Analysis, Insights and Forecast - by End-user Industry
- 6.5.1. Consumer Electronics
- 6.5.2. Automotive
- 6.5.3. Healthcare
- 6.5.4. Aerospace and Defense
- 6.5.5. Security and Surveillance
- 6.5.6. Media and Entertainment
- 6.5.7. Other End-user Industries
- 6.1. Market Analysis, Insights and Forecast - by Component
- 7. Europe 3D Sensing & Imaging Market Analysis, Insights and Forecast, 2019-2031
- 7.1. Market Analysis, Insights and Forecast - by Component
- 7.1.1. Hardware
- 7.1.2. Software
- 7.1.3. Services
- 7.2. Market Analysis, Insights and Forecast - by Technology
- 7.2.1. Ultrasound
- 7.2.2. Structured Light
- 7.2.3. Time of Flight
- 7.2.4. Stereoscopic Vision
- 7.2.5. Other Technologies
- 7.3. Market Analysis, Insights and Forecast - by Type
- 7.3.1. Position Sensor
- 7.3.2. Image Sensor
- 7.3.3. Temperature Sensor
- 7.3.4. Accelerometer Sensor
- 7.3.5. Proximity Sensor
- 7.3.6. Other Types
- 7.4. Market Analysis, Insights and Forecast - by Connectivity
- 7.4.1. Wired Network Connectivity
- 7.4.2. Wireless Network Connectivity
- 7.5. Market Analysis, Insights and Forecast - by End-user Industry
- 7.5.1. Consumer Electronics
- 7.5.2. Automotive
- 7.5.3. Healthcare
- 7.5.4. Aerospace and Defense
- 7.5.5. Security and Surveillance
- 7.5.6. Media and Entertainment
- 7.5.7. Other End-user Industries
- 7.1. Market Analysis, Insights and Forecast - by Component
- 8. Asia Pacific 3D Sensing & Imaging Market Analysis, Insights and Forecast, 2019-2031
- 8.1. Market Analysis, Insights and Forecast - by Component
- 8.1.1. Hardware
- 8.1.2. Software
- 8.1.3. Services
- 8.2. Market Analysis, Insights and Forecast - by Technology
- 8.2.1. Ultrasound
- 8.2.2. Structured Light
- 8.2.3. Time of Flight
- 8.2.4. Stereoscopic Vision
- 8.2.5. Other Technologies
- 8.3. Market Analysis, Insights and Forecast - by Type
- 8.3.1. Position Sensor
- 8.3.2. Image Sensor
- 8.3.3. Temperature Sensor
- 8.3.4. Accelerometer Sensor
- 8.3.5. Proximity Sensor
- 8.3.6. Other Types
- 8.4. Market Analysis, Insights and Forecast - by Connectivity
- 8.4.1. Wired Network Connectivity
- 8.4.2. Wireless Network Connectivity
- 8.5. Market Analysis, Insights and Forecast - by End-user Industry
- 8.5.1. Consumer Electronics
- 8.5.2. Automotive
- 8.5.3. Healthcare
- 8.5.4. Aerospace and Defense
- 8.5.5. Security and Surveillance
- 8.5.6. Media and Entertainment
- 8.5.7. Other End-user Industries
- 8.1. Market Analysis, Insights and Forecast - by Component
- 9. Middle East and Africa 3D Sensing & Imaging Market Analysis, Insights and Forecast, 2019-2031
- 9.1. Market Analysis, Insights and Forecast - by Component
- 9.1.1. Hardware
- 9.1.2. Software
- 9.1.3. Services
- 9.2. Market Analysis, Insights and Forecast - by Technology
- 9.2.1. Ultrasound
- 9.2.2. Structured Light
- 9.2.3. Time of Flight
- 9.2.4. Stereoscopic Vision
- 9.2.5. Other Technologies
- 9.3. Market Analysis, Insights and Forecast - by Type
- 9.3.1. Position Sensor
- 9.3.2. Image Sensor
- 9.3.3. Temperature Sensor
- 9.3.4. Accelerometer Sensor
- 9.3.5. Proximity Sensor
- 9.3.6. Other Types
- 9.4. Market Analysis, Insights and Forecast - by Connectivity
- 9.4.1. Wired Network Connectivity
- 9.4.2. Wireless Network Connectivity
- 9.5. Market Analysis, Insights and Forecast - by End-user Industry
- 9.5.1. Consumer Electronics
- 9.5.2. Automotive
- 9.5.3. Healthcare
- 9.5.4. Aerospace and Defense
- 9.5.5. Security and Surveillance
- 9.5.6. Media and Entertainment
- 9.5.7. Other End-user Industries
- 9.1. Market Analysis, Insights and Forecast - by Component
- 10. Latin America 3D Sensing & Imaging Market Analysis, Insights and Forecast, 2019-2031
- 10.1. Market Analysis, Insights and Forecast - by Component
- 10.1.1. Hardware
- 10.1.2. Software
- 10.1.3. Services
- 10.2. Market Analysis, Insights and Forecast - by Technology
- 10.2.1. Ultrasound
- 10.2.2. Structured Light
- 10.2.3. Time of Flight
- 10.2.4. Stereoscopic Vision
- 10.2.5. Other Technologies
- 10.3. Market Analysis, Insights and Forecast - by Type
- 10.3.1. Position Sensor
- 10.3.2. Image Sensor
- 10.3.3. Temperature Sensor
- 10.3.4. Accelerometer Sensor
- 10.3.5. Proximity Sensor
- 10.3.6. Other Types
- 10.4. Market Analysis, Insights and Forecast - by Connectivity
- 10.4.1. Wired Network Connectivity
- 10.4.2. Wireless Network Connectivity
- 10.5. Market Analysis, Insights and Forecast - by End-user Industry
- 10.5.1. Consumer Electronics
- 10.5.2. Automotive
- 10.5.3. Healthcare
- 10.5.4. Aerospace and Defense
- 10.5.5. Security and Surveillance
- 10.5.6. Media and Entertainment
- 10.5.7. Other End-user Industries
- 10.1. Market Analysis, Insights and Forecast - by Component
- 11. North America 3D Sensing & Imaging Market Analysis, Insights and Forecast, 2019-2031
- 11.1. Market Analysis, Insights and Forecast - By Country/Sub-region
- 11.1.1.
- 12. Europe 3D Sensing & Imaging Market Analysis, Insights and Forecast, 2019-2031
- 12.1. Market Analysis, Insights and Forecast - By Country/Sub-region
- 12.1.1.
- 13. Asia Pacific 3D Sensing & Imaging Market Analysis, Insights and Forecast, 2019-2031
- 13.1. Market Analysis, Insights and Forecast - By Country/Sub-region
- 13.1.1.
- 14. Latin America 3D Sensing & Imaging Market Analysis, Insights and Forecast, 2019-2031
- 14.1. Market Analysis, Insights and Forecast - By Country/Sub-region
- 14.1.1.
- 15. Middle East and Africa 3D Sensing & Imaging Market Analysis, Insights and Forecast, 2019-2031
- 15.1. Market Analysis, Insights and Forecast - By Country/Sub-region
- 15.1.1.
- 16. Competitive Analysis
- 16.1. Global Market Share Analysis 2024
- 16.2. Company Profiles
- 16.2.1 Panasonic
- 16.2.1.1. Overview
- 16.2.1.2. Products
- 16.2.1.3. SWOT Analysis
- 16.2.1.4. Recent Developments
- 16.2.1.5. Financials (Based on Availability)
- 16.2.2 Infineon Technologies AG
- 16.2.2.1. Overview
- 16.2.2.2. Products
- 16.2.2.3. SWOT Analysis
- 16.2.2.4. Recent Developments
- 16.2.2.5. Financials (Based on Availability)
- 16.2.3 Trimble
- 16.2.3.1. Overview
- 16.2.3.2. Products
- 16.2.3.3. SWOT Analysis
- 16.2.3.4. Recent Developments
- 16.2.3.5. Financials (Based on Availability)
- 16.2.4 Omnivision Technologies Inc
- 16.2.4.1. Overview
- 16.2.4.2. Products
- 16.2.4.3. SWOT Analysis
- 16.2.4.4. Recent Developments
- 16.2.4.5. Financials (Based on Availability)
- 16.2.5 Microchip Technology Inc
- 16.2.5.1. Overview
- 16.2.5.2. Products
- 16.2.5.3. SWOT Analysis
- 16.2.5.4. Recent Developments
- 16.2.5.5. Financials (Based on Availability)
- 16.2.6 GE Healthcare
- 16.2.6.1. Overview
- 16.2.6.2. Products
- 16.2.6.3. SWOT Analysis
- 16.2.6.4. Recent Developments
- 16.2.6.5. Financials (Based on Availability)
- 16.2.7 Lockheed Martin
- 16.2.7.1. Overview
- 16.2.7.2. Products
- 16.2.7.3. SWOT Analysis
- 16.2.7.4. Recent Developments
- 16.2.7.5. Financials (Based on Availability)
- 16.2.8 Adobe
- 16.2.8.1. Overview
- 16.2.8.2. Products
- 16.2.8.3. SWOT Analysis
- 16.2.8.4. Recent Developments
- 16.2.8.5. Financials (Based on Availability)
- 16.2.9 STMicroelectronics
- 16.2.9.1. Overview
- 16.2.9.2. Products
- 16.2.9.3. SWOT Analysis
- 16.2.9.4. Recent Developments
- 16.2.9.5. Financials (Based on Availability)
- 16.2.10 Google
- 16.2.10.1. Overview
- 16.2.10.2. Products
- 16.2.10.3. SWOT Analysis
- 16.2.10.4. Recent Developments
- 16.2.10.5. Financials (Based on Availability)
- 16.2.11 Sick AG
- 16.2.11.1. Overview
- 16.2.11.2. Products
- 16.2.11.3. SWOT Analysis
- 16.2.11.4. Recent Developments
- 16.2.11.5. Financials (Based on Availability)
- 16.2.12 Faro
- 16.2.12.1. Overview
- 16.2.12.2. Products
- 16.2.12.3. SWOT Analysis
- 16.2.12.4. Recent Developments
- 16.2.12.5. Financials (Based on Availability)
- 16.2.13 Texas Instruments Incorporated
- 16.2.13.1. Overview
- 16.2.13.2. Products
- 16.2.13.3. SWOT Analysis
- 16.2.13.4. Recent Developments
- 16.2.13.5. Financials (Based on Availability)
- 16.2.14 Autodesk
- 16.2.14.1. Overview
- 16.2.14.2. Products
- 16.2.14.3. SWOT Analysis
- 16.2.14.4. Recent Developments
- 16.2.14.5. Financials (Based on Availability)
- 16.2.15 Keyence
- 16.2.15.1. Overview
- 16.2.15.2. Products
- 16.2.15.3. SWOT Analysis
- 16.2.15.4. Recent Developments
- 16.2.15.5. Financials (Based on Availability)
- 16.2.16 Dassault Systems*List Not Exhaustive
- 16.2.16.1. Overview
- 16.2.16.2. Products
- 16.2.16.3. SWOT Analysis
- 16.2.16.4. Recent Developments
- 16.2.16.5. Financials (Based on Availability)
- 16.2.17 Qualcomm Inc
- 16.2.17.1. Overview
- 16.2.17.2. Products
- 16.2.17.3. SWOT Analysis
- 16.2.17.4. Recent Developments
- 16.2.17.5. Financials (Based on Availability)
- 16.2.1 Panasonic
List of Figures
- Figure 1: Global 3D Sensing & Imaging Market Revenue Breakdown (Million, %) by Region 2024 & 2032
- Figure 2: North America 3D Sensing & Imaging Market Revenue (Million), by Country 2024 & 2032
- Figure 3: North America 3D Sensing & Imaging Market Revenue Share (%), by Country 2024 & 2032
- Figure 4: Europe 3D Sensing & Imaging Market Revenue (Million), by Country 2024 & 2032
- Figure 5: Europe 3D Sensing & Imaging Market Revenue Share (%), by Country 2024 & 2032
- Figure 6: Asia Pacific 3D Sensing & Imaging Market Revenue (Million), by Country 2024 & 2032
- Figure 7: Asia Pacific 3D Sensing & Imaging Market Revenue Share (%), by Country 2024 & 2032
- Figure 8: Latin America 3D Sensing & Imaging Market Revenue (Million), by Country 2024 & 2032
- Figure 9: Latin America 3D Sensing & Imaging Market Revenue Share (%), by Country 2024 & 2032
- Figure 10: Middle East and Africa 3D Sensing & Imaging Market Revenue (Million), by Country 2024 & 2032
- Figure 11: Middle East and Africa 3D Sensing & Imaging Market Revenue Share (%), by Country 2024 & 2032
- Figure 12: North America 3D Sensing & Imaging Market Revenue (Million), by Component 2024 & 2032
- Figure 13: North America 3D Sensing & Imaging Market Revenue Share (%), by Component 2024 & 2032
- Figure 14: North America 3D Sensing & Imaging Market Revenue (Million), by Technology 2024 & 2032
- Figure 15: North America 3D Sensing & Imaging Market Revenue Share (%), by Technology 2024 & 2032
- Figure 16: North America 3D Sensing & Imaging Market Revenue (Million), by Type 2024 & 2032
- Figure 17: North America 3D Sensing & Imaging Market Revenue Share (%), by Type 2024 & 2032
- Figure 18: North America 3D Sensing & Imaging Market Revenue (Million), by Connectivity 2024 & 2032
- Figure 19: North America 3D Sensing & Imaging Market Revenue Share (%), by Connectivity 2024 & 2032
- Figure 20: North America 3D Sensing & Imaging Market Revenue (Million), by End-user Industry 2024 & 2032
- Figure 21: North America 3D Sensing & Imaging Market Revenue Share (%), by End-user Industry 2024 & 2032
- Figure 22: North America 3D Sensing & Imaging Market Revenue (Million), by Country 2024 & 2032
- Figure 23: North America 3D Sensing & Imaging Market Revenue Share (%), by Country 2024 & 2032
- Figure 24: Europe 3D Sensing & Imaging Market Revenue (Million), by Component 2024 & 2032
- Figure 25: Europe 3D Sensing & Imaging Market Revenue Share (%), by Component 2024 & 2032
- Figure 26: Europe 3D Sensing & Imaging Market Revenue (Million), by Technology 2024 & 2032
- Figure 27: Europe 3D Sensing & Imaging Market Revenue Share (%), by Technology 2024 & 2032
- Figure 28: Europe 3D Sensing & Imaging Market Revenue (Million), by Type 2024 & 2032
- Figure 29: Europe 3D Sensing & Imaging Market Revenue Share (%), by Type 2024 & 2032
- Figure 30: Europe 3D Sensing & Imaging Market Revenue (Million), by Connectivity 2024 & 2032
- Figure 31: Europe 3D Sensing & Imaging Market Revenue Share (%), by Connectivity 2024 & 2032
- Figure 32: Europe 3D Sensing & Imaging Market Revenue (Million), by End-user Industry 2024 & 2032
- Figure 33: Europe 3D Sensing & Imaging Market Revenue Share (%), by End-user Industry 2024 & 2032
- Figure 34: Europe 3D Sensing & Imaging Market Revenue (Million), by Country 2024 & 2032
- Figure 35: Europe 3D Sensing & Imaging Market Revenue Share (%), by Country 2024 & 2032
- Figure 36: Asia Pacific 3D Sensing & Imaging Market Revenue (Million), by Component 2024 & 2032
- Figure 37: Asia Pacific 3D Sensing & Imaging Market Revenue Share (%), by Component 2024 & 2032
- Figure 38: Asia Pacific 3D Sensing & Imaging Market Revenue (Million), by Technology 2024 & 2032
- Figure 39: Asia Pacific 3D Sensing & Imaging Market Revenue Share (%), by Technology 2024 & 2032
- Figure 40: Asia Pacific 3D Sensing & Imaging Market Revenue (Million), by Type 2024 & 2032
- Figure 41: Asia Pacific 3D Sensing & Imaging Market Revenue Share (%), by Type 2024 & 2032
- Figure 42: Asia Pacific 3D Sensing & Imaging Market Revenue (Million), by Connectivity 2024 & 2032
- Figure 43: Asia Pacific 3D Sensing & Imaging Market Revenue Share (%), by Connectivity 2024 & 2032
- Figure 44: Asia Pacific 3D Sensing & Imaging Market Revenue (Million), by End-user Industry 2024 & 2032
- Figure 45: Asia Pacific 3D Sensing & Imaging Market Revenue Share (%), by End-user Industry 2024 & 2032
- Figure 46: Asia Pacific 3D Sensing & Imaging Market Revenue (Million), by Country 2024 & 2032
- Figure 47: Asia Pacific 3D Sensing & Imaging Market Revenue Share (%), by Country 2024 & 2032
- Figure 48: Middle East and Africa 3D Sensing & Imaging Market Revenue (Million), by Component 2024 & 2032
- Figure 49: Middle East and Africa 3D Sensing & Imaging Market Revenue Share (%), by Component 2024 & 2032
- Figure 50: Middle East and Africa 3D Sensing & Imaging Market Revenue (Million), by Technology 2024 & 2032
- Figure 51: Middle East and Africa 3D Sensing & Imaging Market Revenue Share (%), by Technology 2024 & 2032
- Figure 52: Middle East and Africa 3D Sensing & Imaging Market Revenue (Million), by Type 2024 & 2032
- Figure 53: Middle East and Africa 3D Sensing & Imaging Market Revenue Share (%), by Type 2024 & 2032
- Figure 54: Middle East and Africa 3D Sensing & Imaging Market Revenue (Million), by Connectivity 2024 & 2032
- Figure 55: Middle East and Africa 3D Sensing & Imaging Market Revenue Share (%), by Connectivity 2024 & 2032
- Figure 56: Middle East and Africa 3D Sensing & Imaging Market Revenue (Million), by End-user Industry 2024 & 2032
- Figure 57: Middle East and Africa 3D Sensing & Imaging Market Revenue Share (%), by End-user Industry 2024 & 2032
- Figure 58: Middle East and Africa 3D Sensing & Imaging Market Revenue (Million), by Country 2024 & 2032
- Figure 59: Middle East and Africa 3D Sensing & Imaging Market Revenue Share (%), by Country 2024 & 2032
- Figure 60: Latin America 3D Sensing & Imaging Market Revenue (Million), by Component 2024 & 2032
- Figure 61: Latin America 3D Sensing & Imaging Market Revenue Share (%), by Component 2024 & 2032
- Figure 62: Latin America 3D Sensing & Imaging Market Revenue (Million), by Technology 2024 & 2032
- Figure 63: Latin America 3D Sensing & Imaging Market Revenue Share (%), by Technology 2024 & 2032
- Figure 64: Latin America 3D Sensing & Imaging Market Revenue (Million), by Type 2024 & 2032
- Figure 65: Latin America 3D Sensing & Imaging Market Revenue Share (%), by Type 2024 & 2032
- Figure 66: Latin America 3D Sensing & Imaging Market Revenue (Million), by Connectivity 2024 & 2032
- Figure 67: Latin America 3D Sensing & Imaging Market Revenue Share (%), by Connectivity 2024 & 2032
- Figure 68: Latin America 3D Sensing & Imaging Market Revenue (Million), by End-user Industry 2024 & 2032
- Figure 69: Latin America 3D Sensing & Imaging Market Revenue Share (%), by End-user Industry 2024 & 2032
- Figure 70: Latin America 3D Sensing & Imaging Market Revenue (Million), by Country 2024 & 2032
- Figure 71: Latin America 3D Sensing & Imaging Market Revenue Share (%), by Country 2024 & 2032
List of Tables
- Table 1: Global 3D Sensing & Imaging Market Revenue Million Forecast, by Region 2019 & 2032
- Table 2: Global 3D Sensing & Imaging Market Revenue Million Forecast, by Component 2019 & 2032
- Table 3: Global 3D Sensing & Imaging Market Revenue Million Forecast, by Technology 2019 & 2032
- Table 4: Global 3D Sensing & Imaging Market Revenue Million Forecast, by Type 2019 & 2032
- Table 5: Global 3D Sensing & Imaging Market Revenue Million Forecast, by Connectivity 2019 & 2032
- Table 6: Global 3D Sensing & Imaging Market Revenue Million Forecast, by End-user Industry 2019 & 2032
- Table 7: Global 3D Sensing & Imaging Market Revenue Million Forecast, by Region 2019 & 2032
- Table 8: Global 3D Sensing & Imaging Market Revenue Million Forecast, by Country 2019 & 2032
- Table 9: 3D Sensing & Imaging Market Revenue (Million) Forecast, by Application 2019 & 2032
- Table 10: Global 3D Sensing & Imaging Market Revenue Million Forecast, by Country 2019 & 2032
- Table 11: 3D Sensing & Imaging Market Revenue (Million) Forecast, by Application 2019 & 2032
- Table 12: Global 3D Sensing & Imaging Market Revenue Million Forecast, by Country 2019 & 2032
- Table 13: 3D Sensing & Imaging Market Revenue (Million) Forecast, by Application 2019 & 2032
- Table 14: Global 3D Sensing & Imaging Market Revenue Million Forecast, by Country 2019 & 2032
- Table 15: 3D Sensing & Imaging Market Revenue (Million) Forecast, by Application 2019 & 2032
- Table 16: Global 3D Sensing & Imaging Market Revenue Million Forecast, by Country 2019 & 2032
- Table 17: 3D Sensing & Imaging Market Revenue (Million) Forecast, by Application 2019 & 2032
- Table 18: Global 3D Sensing & Imaging Market Revenue Million Forecast, by Component 2019 & 2032
- Table 19: Global 3D Sensing & Imaging Market Revenue Million Forecast, by Technology 2019 & 2032
- Table 20: Global 3D Sensing & Imaging Market Revenue Million Forecast, by Type 2019 & 2032
- Table 21: Global 3D Sensing & Imaging Market Revenue Million Forecast, by Connectivity 2019 & 2032
- Table 22: Global 3D Sensing & Imaging Market Revenue Million Forecast, by End-user Industry 2019 & 2032
- Table 23: Global 3D Sensing & Imaging Market Revenue Million Forecast, by Country 2019 & 2032
- Table 24: Global 3D Sensing & Imaging Market Revenue Million Forecast, by Component 2019 & 2032
- Table 25: Global 3D Sensing & Imaging Market Revenue Million Forecast, by Technology 2019 & 2032
- Table 26: Global 3D Sensing & Imaging Market Revenue Million Forecast, by Type 2019 & 2032
- Table 27: Global 3D Sensing & Imaging Market Revenue Million Forecast, by Connectivity 2019 & 2032
- Table 28: Global 3D Sensing & Imaging Market Revenue Million Forecast, by End-user Industry 2019 & 2032
- Table 29: Global 3D Sensing & Imaging Market Revenue Million Forecast, by Country 2019 & 2032
- Table 30: Global 3D Sensing & Imaging Market Revenue Million Forecast, by Component 2019 & 2032
- Table 31: Global 3D Sensing & Imaging Market Revenue Million Forecast, by Technology 2019 & 2032
- Table 32: Global 3D Sensing & Imaging Market Revenue Million Forecast, by Type 2019 & 2032
- Table 33: Global 3D Sensing & Imaging Market Revenue Million Forecast, by Connectivity 2019 & 2032
- Table 34: Global 3D Sensing & Imaging Market Revenue Million Forecast, by End-user Industry 2019 & 2032
- Table 35: Global 3D Sensing & Imaging Market Revenue Million Forecast, by Country 2019 & 2032
- Table 36: Global 3D Sensing & Imaging Market Revenue Million Forecast, by Component 2019 & 2032
- Table 37: Global 3D Sensing & Imaging Market Revenue Million Forecast, by Technology 2019 & 2032
- Table 38: Global 3D Sensing & Imaging Market Revenue Million Forecast, by Type 2019 & 2032
- Table 39: Global 3D Sensing & Imaging Market Revenue Million Forecast, by Connectivity 2019 & 2032
- Table 40: Global 3D Sensing & Imaging Market Revenue Million Forecast, by End-user Industry 2019 & 2032
- Table 41: Global 3D Sensing & Imaging Market Revenue Million Forecast, by Country 2019 & 2032
- Table 42: Global 3D Sensing & Imaging Market Revenue Million Forecast, by Component 2019 & 2032
- Table 43: Global 3D Sensing & Imaging Market Revenue Million Forecast, by Technology 2019 & 2032
- Table 44: Global 3D Sensing & Imaging Market Revenue Million Forecast, by Type 2019 & 2032
- Table 45: Global 3D Sensing & Imaging Market Revenue Million Forecast, by Connectivity 2019 & 2032
- Table 46: Global 3D Sensing & Imaging Market Revenue Million Forecast, by End-user Industry 2019 & 2032
- Table 47: Global 3D Sensing & Imaging Market Revenue Million Forecast, by Country 2019 & 2032
Frequently Asked Questions
1. What is the projected Compound Annual Growth Rate (CAGR) of the 3D Sensing & Imaging Market?
The projected CAGR is approximately 13.92%.
2. Which companies are prominent players in the 3D Sensing & Imaging Market?
Key companies in the market include Panasonic, Infineon Technologies AG, Trimble, Omnivision Technologies Inc, Microchip Technology Inc, GE Healthcare, Lockheed Martin, Adobe, STMicroelectronics, Google, Sick AG, Faro, Texas Instruments Incorporated, Autodesk, Keyence, Dassault Systems*List Not Exhaustive, Qualcomm Inc.
3. What are the main segments of the 3D Sensing & Imaging Market?
The market segments include Component, Technology, Type, Connectivity, End-user Industry.
4. Can you provide details about the market size?
The market size is estimated to be USD 10.94 Million as of 2022.
5. What are some drivers contributing to market growth?
Integration of Optical and Electronic Components in Miniaturized Electronics Devices; Rising Demand for 3D-Enabled Devices in Consumer Electronics; Growing Penetration of Image Sensors in Automobiles; Growing Requirement of Security and Surveillance Systems.
6. What are the notable trends driving market growth?
Automotive Sector Expected to Drive Market Growth.
7. Are there any restraints impacting market growth?
High Manufacturing Cost of Image Sensors; Limited Integration With Other Devices; High Cost Required for the Maintenance of these Devices.
8. Can you provide examples of recent developments in the market?
March 2022 - LIPS Corporation and Newsight Imaging signed a Memorandum of Understanding (MoU) to develop, promote, and facilitate eTOF (enhanced-Time-Of-Flight) based 3D vision systems for industry 4.0 usage-cases and AIoT.
9. What pricing options are available for accessing the report?
Pricing options include single-user, multi-user, and enterprise licenses priced at USD 4750, USD 5250, and USD 8750 respectively.
10. Is the market size provided in terms of value or volume?
The market size is provided in terms of value, measured in Million.
11. Are there any specific market keywords associated with the report?
Yes, the market keyword associated with the report is "3D Sensing & Imaging Market," which aids in identifying and referencing the specific market segment covered.
12. How do I determine which pricing option suits my needs best?
The pricing options vary based on user requirements and access needs. Individual users may opt for single-user licenses, while businesses requiring broader access may choose multi-user or enterprise licenses for cost-effective access to the report.
13. Are there any additional resources or data provided in the 3D Sensing & Imaging Market report?
While the report offers comprehensive insights, it's advisable to review the specific contents or supplementary materials provided to ascertain if additional resources or data are available.
14. How can I stay updated on further developments or reports in the 3D Sensing & Imaging Market?
To stay informed about further developments, trends, and reports in the 3D Sensing & Imaging Market, consider subscribing to industry newsletters, following relevant companies and organizations, or regularly checking reputable industry news sources and publications.
Methodology
Step 1 - Identification of Relevant Samples Size from Population Database


Step 2 - Approaches for Defining Global Market Size (Value, Volume* & Price*)

Note*: In applicable scenarios
Step 3 - Data Sources
Primary Research
- Web Analytics
- Survey Reports
- Research Institute
- Latest Research Reports
- Opinion Leaders
Secondary Research
- Annual Reports
- White Paper
- Latest Press Release
- Industry Association
- Paid Database
- Investor Presentations

Step 4 - Data Triangulation
Involves using different sources of information in order to increase the validity of a study
These sources are likely to be stakeholders in a program - participants, other researchers, program staff, other community members, and so on.
Then we put all data in single framework & apply various statistical tools to find out the dynamic on the market.
During the analysis stage, feedback from the stakeholder groups would be compared to determine areas of agreement as well as areas of divergence
