

Key Insights for 5G RedCap Chip Market
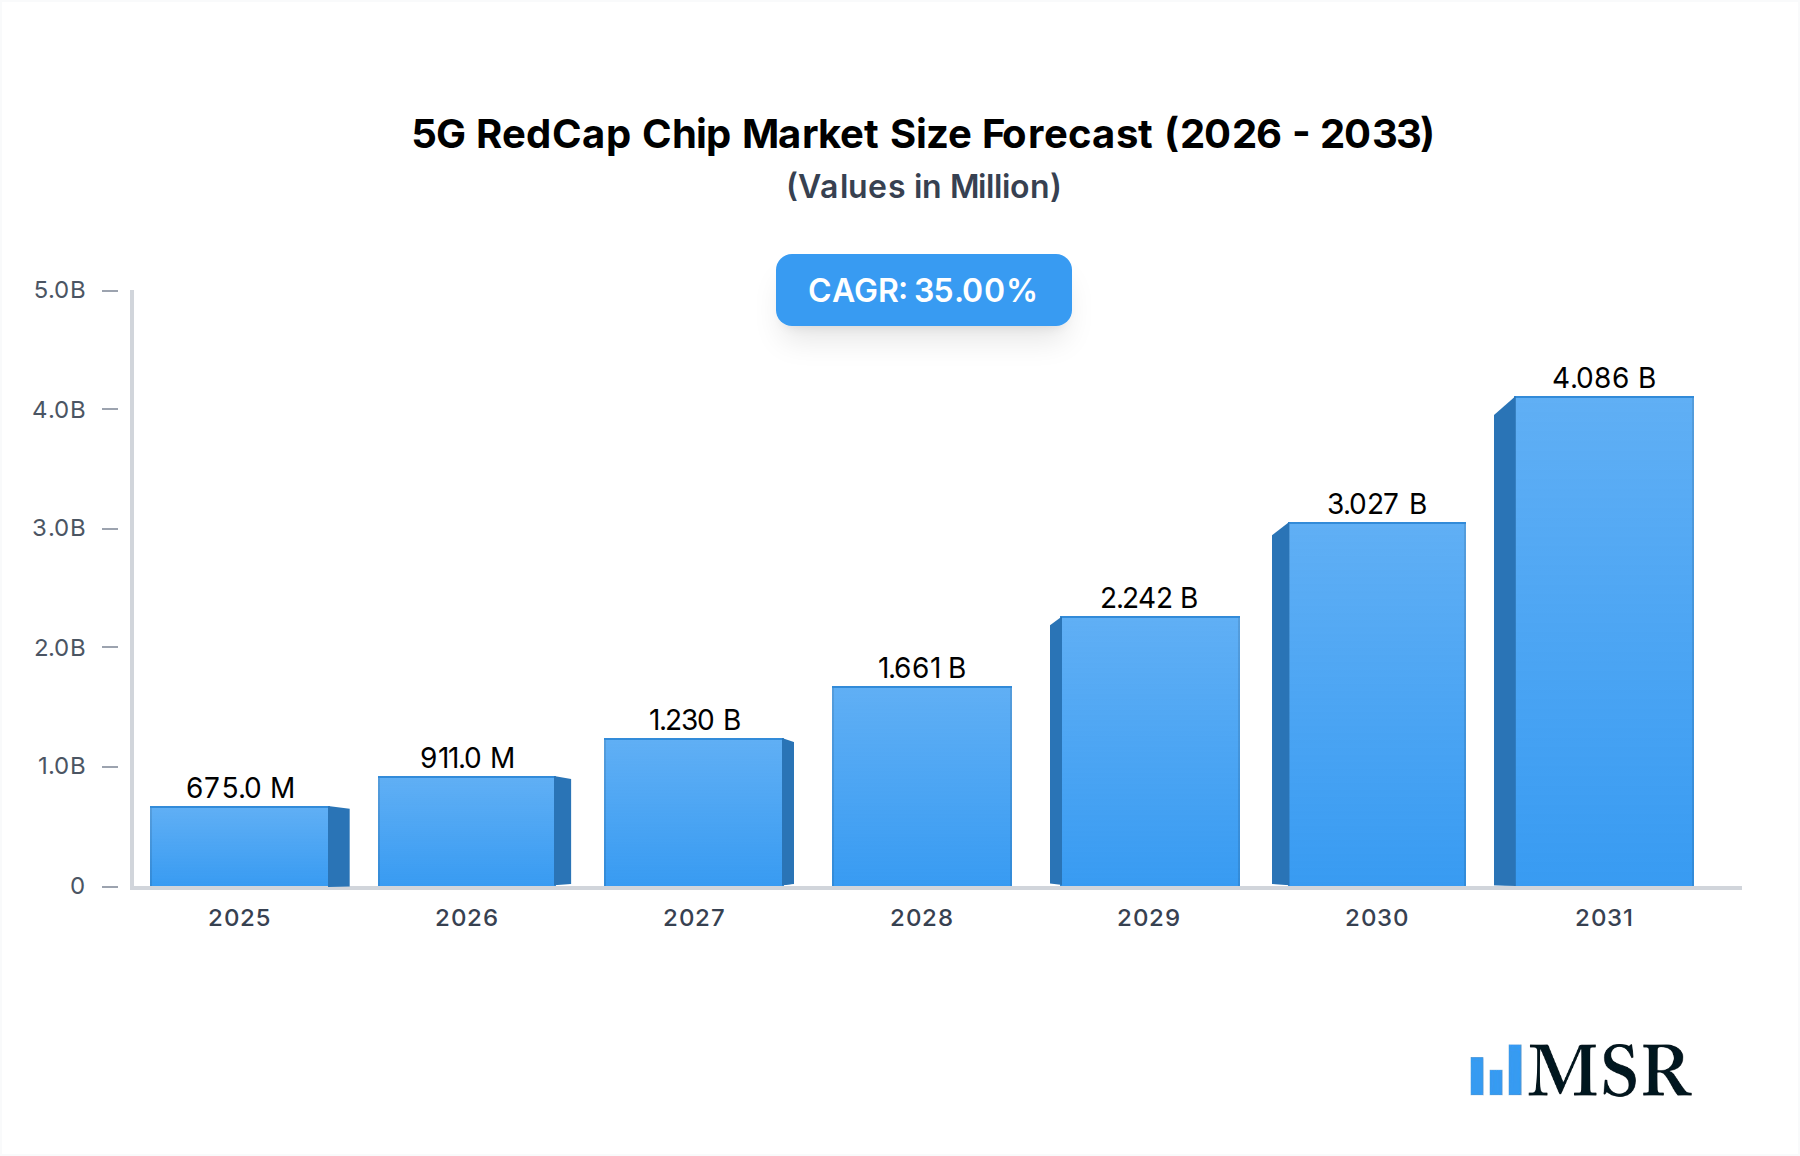
The 5G RedCap Chip Market, a nascent yet rapidly expanding segment within the broader wireless communication ecosystem, is poised for extraordinary growth. Valued at an estimated $500 million in 2025, this market is projected to reach approximately $6,952.7 million by 2034, demonstrating an impressive Compound Annual Growth Rate (CAGR) of 35% over the forecast period. This robust expansion is primarily driven by the imperative for cost-effective, power-efficient, and optimized 5G connectivity solutions tailored for a vast array of mid-tier Internet of Things (IoT) applications. RedCap (Reduced Capability) technology, formally standardized in 3GPP Release 17, bridges the performance and complexity gap between high-end 5G NR and low-power wide-area network (LPWAN) technologies like NB-IoT and LTE-M. This sweet spot enables a new wave of devices requiring moderate bandwidth, extended battery life, and enhanced reliability without the overhead of full-fledged 5G modules. Key demand drivers include the escalating deployment of Industry 4.0 initiatives, the proliferation of smart city infrastructure, and the growing adoption of connected health solutions. Macro tailwinds such as global digitalization trends, increasing investment in 5G network expansion, and the continuous innovation in semiconductor manufacturing are further propelling market dynamics. The need for reliable, secure, and future-proof connectivity in industrial sensors, surveillance cameras, enhanced wearables, and smart utility meters is making RedCap an increasingly attractive proposition. As original equipment manufacturers (OEMs) and solution integrators seek to upgrade existing IoT devices or deploy new ones with superior performance metrics than legacy LPWAN, the 5G RedCap Chip Market is set to capture significant traction. The market outlook remains exceptionally positive, characterized by aggressive R&D, strategic partnerships, and a strong drive towards ecosystem development to facilitate widespread adoption across diverse end-user industries.

5G RedCap Chip Market Size (In Million)
Sub-6 GHz (FR1) Segment Dominance in 5G RedCap Chip Market
The frequency band segment analysis reveals that the Sub-6 GHz (FR1) segment is anticipated to hold the dominant revenue share in the 5G RedCap Chip Market. This dominance is primarily attributed to several inherent advantages of the FR1 band for RedCap's target applications. Sub-6 GHz spectrum offers a superior balance of coverage and capacity compared to millimeter-wave (mmWave) (FR2), making it ideal for widespread deployments in urban, suburban, and even indoor environments where line-of-sight is often obstructed. The propagation characteristics of Sub-6 GHz frequencies allow for broader cell sizes and better penetration through obstacles, significantly reducing the density of base stations required for adequate coverage. This translates directly into lower deployment costs for network operators and more reliable connectivity for RedCap devices, which are often deployed in challenging RF environments. Furthermore, the global rollout of 5G networks has largely prioritized the Sub-6 GHz band, leading to a more mature ecosystem, wider availability of spectrum, and earlier adoption curves for chipsets supporting this frequency range. Companies such as Qualcomm Technologies, Inc., MediaTek Inc., and Samsung Electronics Co., Ltd. have extensively developed their 5G NR portfolios around the Sub-6 GHz band, ensuring robust support and optimization for RedCap implementations. The technical complexity and cost associated with mmWave deployment, coupled with its limited penetration capabilities, mean that the mmWave (FR2) segment for RedCap, while offering ultra-high bandwidth, will likely remain a niche for specific high-density or localized applications where such speeds are paramount, such as high-definition video surveillance or certain industrial automation tasks within a factory floor. However, for the majority of mid-tier IoT applications, including those within the Automotive Telematics Market, Smart Metering Market, and general IoT Devices Market, the Sub-6 GHz band provides the optimal blend of performance, cost-efficiency, and ubiquitous coverage. This robust foundation ensures that the Sub-6 GHz (FR1) segment will not only dominate but also continue to expand its share as RedCap technology proliferates globally.
5G RedCap Chip Company Market Share
Key Market Drivers for 5G RedCap Chip Market Growth
The expansion of the 5G RedCap Chip Market is propelled by several critical factors addressing the evolving needs of the connected world, specifically for the Cellular IoT Market. Firstly, the optimal balance of performance and cost-efficiency stands as a primary driver. RedCap technology is designed to offer significantly lower power consumption and reduced complexity compared to full 5G NR modules, often at a substantial cost reduction of 50-70% in module price and 50-80% in power consumption relative to conventional 5G eMBB. This makes 5G connectivity viable for a broader range of price-sensitive IoT applications that require more than LPWAN but less than enhanced mobile broadband. This efficiency directly impacts the viability of new products within the Wearable Devices Market and the Smart Metering Market. Secondly, the global rollout and densification of 5G networks provide the necessary infrastructure for RedCap devices. As of early 2024, over 280 commercial 5G networks have been launched globally, with continued investment in expanding coverage and capacity. This widespread availability of 5G spectrum and network resources creates a fertile ground for RedCap adoption, offering a clear upgrade path from legacy 2G/3G/4G IoT devices. Thirdly, the diversification of mid-tier IoT applications is fueling demand. RedCap fills a crucial gap between ultra-low bandwidth LPWAN Devices Market solutions (like NB-IoT, with ~100 Kbps downlink) and high-performance 5G, enabling applications that need speeds in the tens to hundreds of Mbps (e.g., 50-150 Mbps downlink). This makes it suitable for industrial sensors, video surveillance cameras requiring efficient data transfer, and sophisticated telematics systems in the Automotive Telematics Market. Finally, advancements in semiconductor manufacturing and design are crucial. Continuous innovation in the Semiconductor Foundry Market, leading to smaller process nodes, improved power management, and higher integration levels, allows chip manufacturers to produce RedCap chipsets that are not only more powerful but also more compact and energy-efficient. This enables the integration of RedCap capabilities into smaller form factors for devices, further broadening its addressable market.
Competitive Ecosystem of 5G RedCap Chip Market
- Qualcomm Technologies, Inc.: A pioneering force in 5G cellular technologies, Qualcomm is leveraging its extensive IP portfolio to develop leading RedCap chipsets, providing comprehensive solutions that enable diverse IoT and industrial use cases with optimized performance and power efficiency.
- MediaTek Inc.: Known for its highly integrated and cost-effective chipsets, MediaTek is actively expanding its RedCap offerings to capture market share in mass-market IoT applications, focusing on delivering competitive solutions with robust feature sets.
- Samsung Electronics Co., Ltd.: With a strong foundation in semiconductor manufacturing and mobile communications, Samsung is developing its own RedCap chip solutions, aiming to integrate these advanced connectivity capabilities across its vast ecosystem of consumer and enterprise devices.
- UNISOC Communications Inc.: A significant player in the Chinese semiconductor market, UNISOC is developing RedCap chipsets that balance performance and affordability, targeting the rapidly growing IoT sectors in Asia Pacific and emerging economies.
- Sequans Communications S.A.: A specialist in 4G LTE-M and NB-IoT, Sequans is strategically transitioning and expanding its portfolio to include 5G RedCap, aiming to offer seamless migration paths and enhanced capabilities for its existing industrial and enterprise IoT customer base.
- ASR Microelectronics Co., Ltd.: An emerging fabless semiconductor company, ASR Microelectronics is focusing on competitive RedCap solutions, aiming to provide high-performance yet cost-effective chipsets for a wide range of IoT applications.
- Huawei Technologies Co., Ltd.: Despite global restrictions, Huawei continues to invest heavily in 5G R&D, including RedCap, for its network equipment and industrial IoT solutions, fostering an ecosystem for advanced cellular connectivity.
- Intel Corporation: With a strong legacy in computing and connectivity, Intel continues to explore and develop solutions for specialized 5G segments like RedCap, particularly for enterprise, industrial, and infrastructure applications where its expertise in high-performance computing can be leveraged.
- Nokia Corporation: Primarily a network infrastructure provider, Nokia's strategic interest in RedCap lies in enabling and promoting the adoption of these devices on its 5G networks, ensuring interoperability and performance for enterprise and industrial customers.
- Telefonaktiebolaget LM Ericsson: Similar to Nokia, Ericsson focuses on ensuring its 5G network infrastructure is fully optimized to support RedCap devices, driving the ecosystem for mid-tier 5G IoT applications and enabling new revenue streams for operators.
Recent Developments & Milestones in 5G RedCap Chip Market
- July 2022: The 3GPP Release 17 standard, which officially introduced and defined the specifications for 5G RedCap (Reduced Capability) technology, was completed. This milestone formally paved the way for chip manufacturers to begin commercial development.
- Early 2023: Initial silicon prototypes of 5G RedCap chipsets began to emerge from leading vendors, enabling early testing and validation by module makers and network equipment providers.
- October 2023: Qualcomm Technologies announced its first commercial 5G RedCap modem, the Snapdragon X35, designed to accelerate the adoption of RedCap across various IoT and industrial applications. This marked a significant step towards product availability.
- January 2024: MediaTek Inc. unveiled its own comprehensive 5G RedCap platform, emphasizing power efficiency and cost optimization for a broad range of mid-tier 5G IoT devices, signaling intensifying competition in the market.
- March 2024: Several telecom operators in Asia Pacific and Europe announced successful lab trials and initial field deployments of RedCap-enabled devices on their live 5G networks, demonstrating the technology's readiness for commercial use.
- Mid-2024: Major module vendors began sampling RedCap-integrated modules to their OEM partners, facilitating the design and development of end-user products for the upcoming commercial launch phase.
- Q4 2024: Industry analysts and market reports started to forecast significant market growth from 2025 onwards, anticipating a ramp-up in commercial RedCap device deployments across sectors like smart cities, industrial IoT, and enhanced wearables.
Regional Market Breakdown for 5G RedCap Chip Market
The 5G RedCap Chip Market exhibits varied growth trajectories and adoption rates across different global regions, influenced by the pace of 5G network deployment, industrial digitalization, and governmental initiatives. Asia Pacific is projected to emerge as the dominant and fastest-growing region, anticipated to hold the largest revenue share and exhibit the highest CAGR over the forecast period. Countries like China, South Korea, and Japan are at the forefront of 5G infrastructure rollout and industrial IoT adoption. China, in particular, with its extensive manufacturing base and aggressive investment in smart city projects and Industry 4.0, is a major demand driver for RedCap chips in the Cellular IoT Market. This region's robust ecosystem, including a strong Semiconductor Foundry Market, facilitates both supply and demand. North America is expected to be another significant market, driven by early 5G adoption, a mature industrial sector, and high demand for advanced connectivity solutions in applications like the Automotive Telematics Market and sophisticated IoT Devices Market. The presence of key technology developers and a strong enterprise focus contribute to its substantial market share. Europe is anticipated to show steady growth, fueled by strong governmental support for Industry 4.0, smart grid initiatives (impacting the Smart Metering Market), and a growing focus on sustainable and efficient urban development. Germany, France, and the UK are leading this transition, albeit at a more measured pace than parts of Asia. The Middle East & Africa and South America regions, while starting from a smaller base, are expected to exhibit accelerating growth, driven by increasing 5G infrastructure investments, economic diversification efforts, and the rising need for digital transformation across various sectors. These emerging markets represent crucial long-term opportunities as 5G RedCap technology becomes more accessible and cost-effective, potentially spurring demand for Dual Mode Chip Market solutions as networks mature.
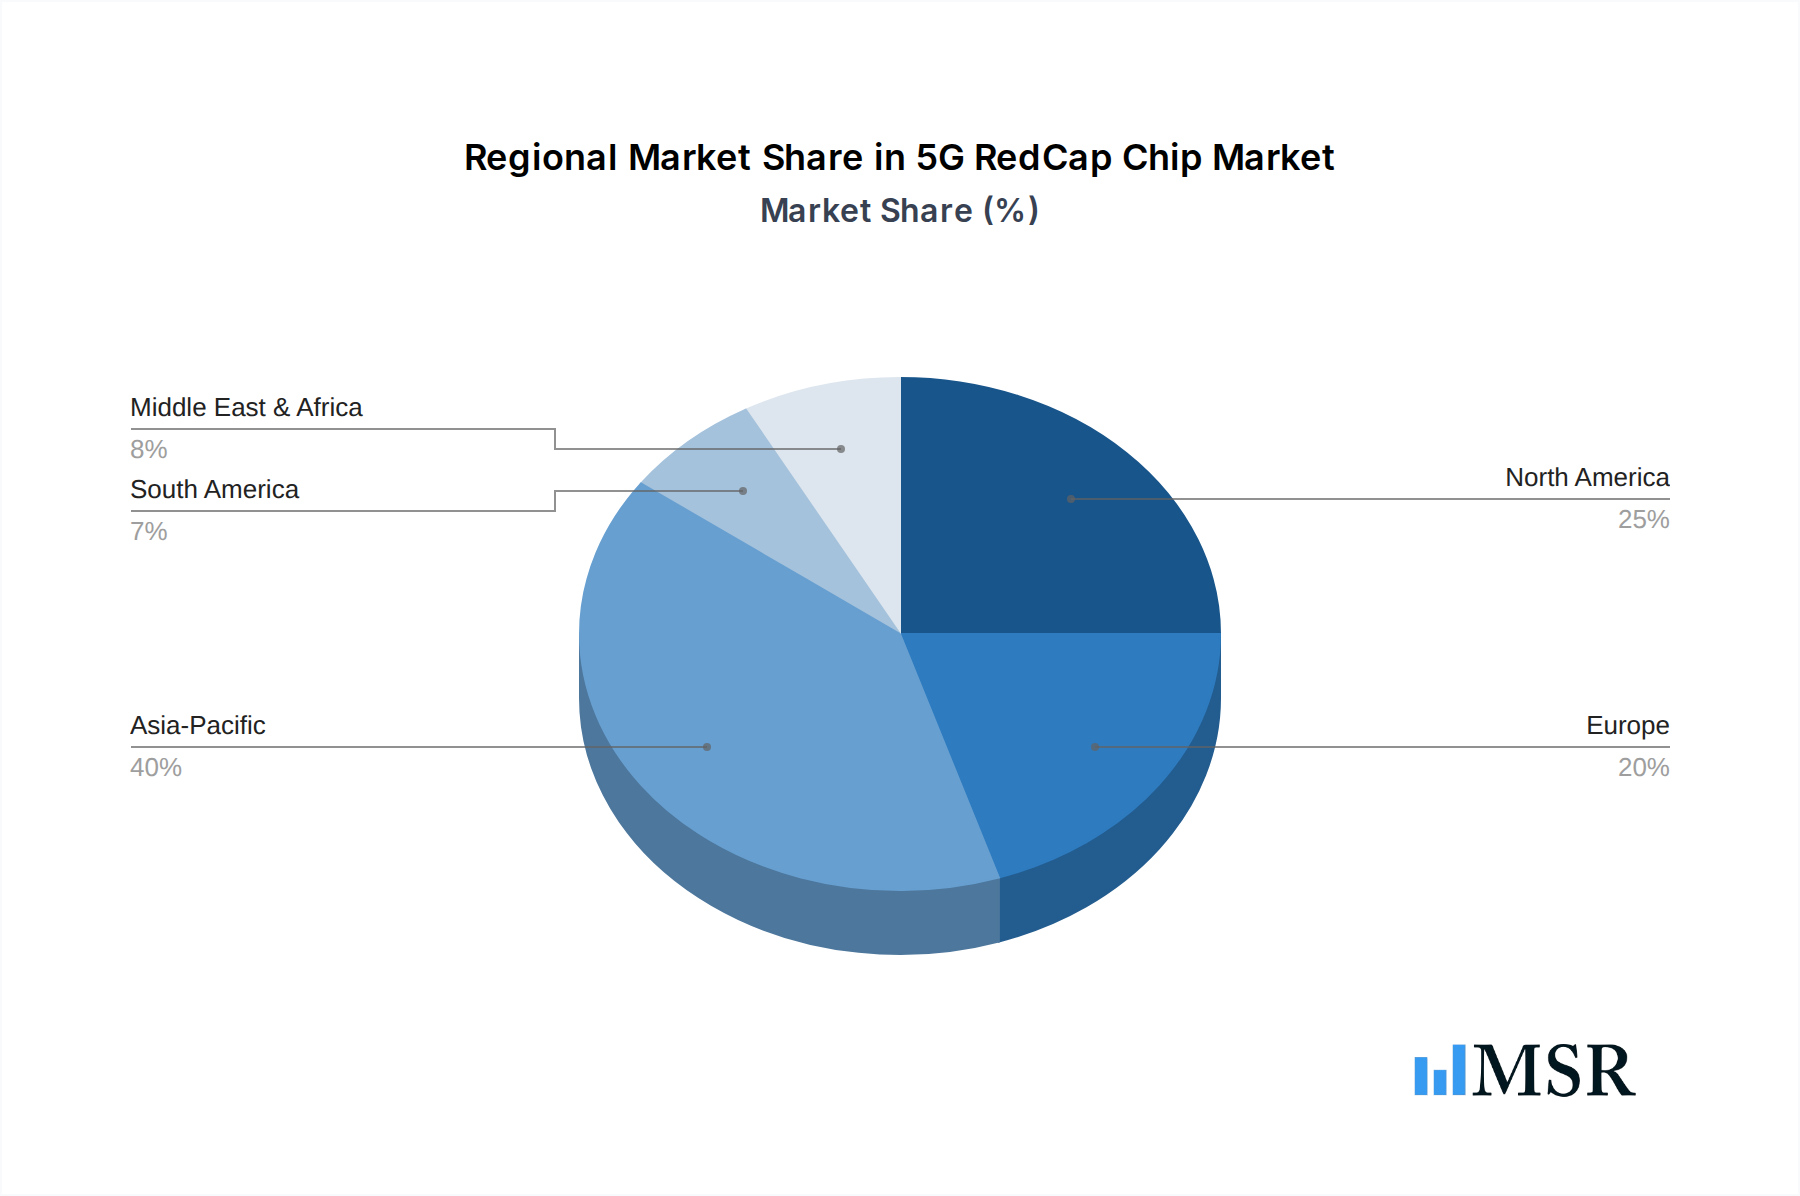
5G RedCap Chip Regional Market Share
Customer Segmentation & Buying Behavior in 5G RedCap Chip Market
The customer base for the 5G RedCap Chip Market is highly diversified, spanning across several key end-user industries including Consumer Electronics, Telecommunications, Manufacturing, Automotive & Transportation, Healthcare, Energy & Utilities, and Retail. Each segment exhibits distinct purchasing criteria and buying behaviors. For Consumer Electronics (e.g., the Wearable Devices Market), primary criteria include ultra-low power consumption to extend battery life, compact form factors for sleek designs, and cost-effectiveness for mass-market appeal. Telecommunications operators and infrastructure providers prioritize high reliability, network compatibility, and robust security features to ensure seamless integration and long-term network performance. The Manufacturing sector, central to Industry 4.0, focuses on low latency for real-time control, extended temperature ranges for harsh environments, and predictable performance for critical applications. In the Automotive & Transportation Market, specifically the Automotive Telematics Market, safety, ultra-reliable low-latency communication (URLLC) capabilities, and secure data handling are paramount. Healthcare emphasizes data privacy, regulatory compliance, and consistent connectivity for remote monitoring and diagnostics. Energy & Utilities, particularly for the Smart Metering Market, demand extreme longevity, robust security against tampering, and deep indoor coverage for devices installed in challenging locations. Across all segments, price sensitivity varies: while consumer devices are highly cost-sensitive, industrial and automotive applications prioritize reliability and performance over initial chip cost. Procurement channels typically involve direct sales for large OEMs, while smaller integrators often procure through specialized distributors and wholesalers. A notable shift in buyer preference is the increasing demand for comprehensive, pre-integrated solutions (chip + module + software stack) that simplify development and accelerate time-to-market, rather than just raw silicon. Furthermore, there's a growing inclination towards vendors offering robust technical support and a clear roadmap for future RedCap iterations, especially for Single Mode Chip Market and Dual Mode Chip Market solutions.
Pricing Dynamics & Margin Pressure in 5G RedCap Chip Market
The pricing dynamics within the 5G RedCap Chip Market are characterized by an initial phase of premium pricing, followed by a trajectory towards commoditization as the market matures and competition intensifies. The Average Selling Price (ASP) of RedCap chipsets is currently influenced by their nascent status, the specialized R&D invested, and the early adopter premium. However, it is expected to decline steadily over the forecast period as production scales, manufacturing efficiencies improve, and more players enter the Semiconductor Foundry Market with competing solutions. Margin structures across the value chain reflect this. Chip designers and IP holders like Qualcomm Technologies, Inc. may command higher initial margins due to their intellectual property and early mover advantage. However, as technologies mature and become more standardized, margin pressure will increase, particularly for those focusing solely on silicon manufacturing. Key cost levers include wafer fabrication costs, which are a direct output of the Semiconductor Foundry Market's technological advancements and capacity utilization. R&D intensity for new generations of RedCap chipsets, software stack development for easier integration, and licensing fees for essential patents also contribute significantly to the overall cost base. The burgeoning competitive intensity, with players like MediaTek Inc., UNISOC Communications Inc., and ASR Microelectronics Co., Ltd. vying for market share, will exert downward pressure on prices. This competition is particularly evident in the drive to offer cost-effective solutions for the IoT Devices Market and the LPWAN Devices Market. Commodity cycles for raw materials used in semiconductor manufacturing, such as silicon and rare earth elements, can also introduce volatility into the cost structure, impacting overall profitability. Manufacturers will increasingly focus on economies of scale, vertical integration, and value-added services (like software optimization and platform support) to maintain healthy margins amidst a rapidly evolving and price-sensitive market.
5G RedCap Chip Segmentation
-
1. Product Type
- 1.1. Single Mode Chip
- 1.2. Dual Mode Chip
-
2. Frequency Band
- 2.1. Sub-6 GHz (FR1)
- 2.2. mmWave (FR2)
-
3. Application
- 3.1. Routers & Gateways
- 3.2. Cameras
- 3.3. Customer Premises Equipment (CPE)
- 3.4. Telematics & Automotive
- 3.5. Wearables
- 3.6. Smart Metering
- 3.7. Others
-
4. Distribution Channel
- 4.1. Direct Sales
- 4.2. Distributors and Wholesalers
- 4.3. Online
-
5. End User Industry
- 5.1. Consumer Electronics
- 5.2. Telecommunications
- 5.3. Manufacturing
- 5.4. Automotive & Transportation
- 5.5. Healthcare
- 5.6. Energy & Utilities
- 5.7. Retail
- 5.8. Others
5G RedCap Chip Segmentation By Geography
-
1. North America
- 1.1. United States
- 1.2. Canada
- 1.3. Mexico
-
2. South America
- 2.1. Brazil
- 2.2. Argentina
- 2.3. Rest of South America
-
3. Europe
- 3.1. United Kingdom
- 3.2. Germany
- 3.3. France
- 3.4. Italy
- 3.5. Spain
- 3.6. Russia
- 3.7. Benelux
- 3.8. Nordics
- 3.9. Rest of Europe
-
4. Middle East & Africa
- 4.1. Turkey
- 4.2. Israel
- 4.3. GCC
- 4.4. North Africa
- 4.5. South Africa
- 4.6. Rest of Middle East & Africa
-
5. Asia Pacific
- 5.1. China
- 5.2. India
- 5.3. Japan
- 5.4. South Korea
- 5.5. ASEAN
- 5.6. Oceania
- 5.7. Rest of Asia Pacific
5G RedCap Chip Regional Market Share
Geographic Coverage of 5G RedCap Chip
5G RedCap Chip REPORT HIGHLIGHTS
| Aspects | Details |
|---|---|
| Study Period | 2020-2034 |
| Base Year | 2025 |
| Estimated Year | 2026 |
| Forecast Period | 2026-2034 |
| Historical Period | 2020-2025 |
| Growth Rate | CAGR of 35% from 2020-2034 |
| Segmentation |
|
Table of Contents
- 1. Introduction
- 1.1. Research Scope
- 1.2. Market Segmentation
- 1.3. Research Objective
- 1.4. Definitions and Assumptions
- 2. Executive Summary
- 2.1. Market Snapshot
- 3. Market Dynamics
- 3.1. Market Drivers
- 3.2. Market Restrains
- 3.3. Market Trends
- 3.4. Market Opportunities
- 4. Market Factor Analysis
- 4.1. Porters Five Forces
- 4.1.1. Bargaining Power of Suppliers
- 4.1.2. Bargaining Power of Buyers
- 4.1.3. Threat of New Entrants
- 4.1.4. Threat of Substitutes
- 4.1.5. Competitive Rivalry
- 4.2. PESTEL analysis
- 4.3. BCG Analysis
- 4.3.1. Stars (High Growth, High Market Share)
- 4.3.2. Cash Cows (Low Growth, High Market Share)
- 4.3.3. Question Mark (High Growth, Low Market Share)
- 4.3.4. Dogs (Low Growth, Low Market Share)
- 4.4. Ansoff Matrix Analysis
- 4.5. Supply Chain Analysis
- 4.6. Regulatory Landscape
- 4.7. Current Market Potential and Opportunity Assessment (TAM–SAM–SOM Framework)
- 4.8. MSR Analyst Note
- 4.1. Porters Five Forces
- 5. Market Analysis, Insights and Forecast 2021-2033
- 5.1. Market Analysis, Insights and Forecast - by Product Type
- 5.1.1. Single Mode Chip
- 5.1.2. Dual Mode Chip
- 5.2. Market Analysis, Insights and Forecast - by Frequency Band
- 5.2.1. Sub-6 GHz (FR1)
- 5.2.2. mmWave (FR2)
- 5.3. Market Analysis, Insights and Forecast - by Application
- 5.3.1. Routers & Gateways
- 5.3.2. Cameras
- 5.3.3. Customer Premises Equipment (CPE)
- 5.3.4. Telematics & Automotive
- 5.3.5. Wearables
- 5.3.6. Smart Metering
- 5.3.7. Others
- 5.4. Market Analysis, Insights and Forecast - by Distribution Channel
- 5.4.1. Direct Sales
- 5.4.2. Distributors and Wholesalers
- 5.4.3. Online
- 5.5. Market Analysis, Insights and Forecast - by End User Industry
- 5.5.1. Consumer Electronics
- 5.5.2. Telecommunications
- 5.5.3. Manufacturing
- 5.5.4. Automotive & Transportation
- 5.5.5. Healthcare
- 5.5.6. Energy & Utilities
- 5.5.7. Retail
- 5.5.8. Others
- 5.6. Market Analysis, Insights and Forecast - by Region
- 5.6.1. North America
- 5.6.2. South America
- 5.6.3. Europe
- 5.6.4. Middle East & Africa
- 5.6.5. Asia Pacific
- 5.1. Market Analysis, Insights and Forecast - by Product Type
- 6. Global 5G RedCap Chip Analysis, Insights and Forecast, 2021-2033
- 6.1. Market Analysis, Insights and Forecast - by Product Type
- 6.1.1. Single Mode Chip
- 6.1.2. Dual Mode Chip
- 6.2. Market Analysis, Insights and Forecast - by Frequency Band
- 6.2.1. Sub-6 GHz (FR1)
- 6.2.2. mmWave (FR2)
- 6.3. Market Analysis, Insights and Forecast - by Application
- 6.3.1. Routers & Gateways
- 6.3.2. Cameras
- 6.3.3. Customer Premises Equipment (CPE)
- 6.3.4. Telematics & Automotive
- 6.3.5. Wearables
- 6.3.6. Smart Metering
- 6.3.7. Others
- 6.4. Market Analysis, Insights and Forecast - by Distribution Channel
- 6.4.1. Direct Sales
- 6.4.2. Distributors and Wholesalers
- 6.4.3. Online
- 6.5. Market Analysis, Insights and Forecast - by End User Industry
- 6.5.1. Consumer Electronics
- 6.5.2. Telecommunications
- 6.5.3. Manufacturing
- 6.5.4. Automotive & Transportation
- 6.5.5. Healthcare
- 6.5.6. Energy & Utilities
- 6.5.7. Retail
- 6.5.8. Others
- 6.1. Market Analysis, Insights and Forecast - by Product Type
- 7. North America 5G RedCap Chip Analysis, Insights and Forecast, 2020-2032
- 7.1. Market Analysis, Insights and Forecast - by Product Type
- 7.1.1. Single Mode Chip
- 7.1.2. Dual Mode Chip
- 7.2. Market Analysis, Insights and Forecast - by Frequency Band
- 7.2.1. Sub-6 GHz (FR1)
- 7.2.2. mmWave (FR2)
- 7.3. Market Analysis, Insights and Forecast - by Application
- 7.3.1. Routers & Gateways
- 7.3.2. Cameras
- 7.3.3. Customer Premises Equipment (CPE)
- 7.3.4. Telematics & Automotive
- 7.3.5. Wearables
- 7.3.6. Smart Metering
- 7.3.7. Others
- 7.4. Market Analysis, Insights and Forecast - by Distribution Channel
- 7.4.1. Direct Sales
- 7.4.2. Distributors and Wholesalers
- 7.4.3. Online
- 7.5. Market Analysis, Insights and Forecast - by End User Industry
- 7.5.1. Consumer Electronics
- 7.5.2. Telecommunications
- 7.5.3. Manufacturing
- 7.5.4. Automotive & Transportation
- 7.5.5. Healthcare
- 7.5.6. Energy & Utilities
- 7.5.7. Retail
- 7.5.8. Others
- 7.1. Market Analysis, Insights and Forecast - by Product Type
- 8. South America 5G RedCap Chip Analysis, Insights and Forecast, 2020-2032
- 8.1. Market Analysis, Insights and Forecast - by Product Type
- 8.1.1. Single Mode Chip
- 8.1.2. Dual Mode Chip
- 8.2. Market Analysis, Insights and Forecast - by Frequency Band
- 8.2.1. Sub-6 GHz (FR1)
- 8.2.2. mmWave (FR2)
- 8.3. Market Analysis, Insights and Forecast - by Application
- 8.3.1. Routers & Gateways
- 8.3.2. Cameras
- 8.3.3. Customer Premises Equipment (CPE)
- 8.3.4. Telematics & Automotive
- 8.3.5. Wearables
- 8.3.6. Smart Metering
- 8.3.7. Others
- 8.4. Market Analysis, Insights and Forecast - by Distribution Channel
- 8.4.1. Direct Sales
- 8.4.2. Distributors and Wholesalers
- 8.4.3. Online
- 8.5. Market Analysis, Insights and Forecast - by End User Industry
- 8.5.1. Consumer Electronics
- 8.5.2. Telecommunications
- 8.5.3. Manufacturing
- 8.5.4. Automotive & Transportation
- 8.5.5. Healthcare
- 8.5.6. Energy & Utilities
- 8.5.7. Retail
- 8.5.8. Others
- 8.1. Market Analysis, Insights and Forecast - by Product Type
- 9. Europe 5G RedCap Chip Analysis, Insights and Forecast, 2020-2032
- 9.1. Market Analysis, Insights and Forecast - by Product Type
- 9.1.1. Single Mode Chip
- 9.1.2. Dual Mode Chip
- 9.2. Market Analysis, Insights and Forecast - by Frequency Band
- 9.2.1. Sub-6 GHz (FR1)
- 9.2.2. mmWave (FR2)
- 9.3. Market Analysis, Insights and Forecast - by Application
- 9.3.1. Routers & Gateways
- 9.3.2. Cameras
- 9.3.3. Customer Premises Equipment (CPE)
- 9.3.4. Telematics & Automotive
- 9.3.5. Wearables
- 9.3.6. Smart Metering
- 9.3.7. Others
- 9.4. Market Analysis, Insights and Forecast - by Distribution Channel
- 9.4.1. Direct Sales
- 9.4.2. Distributors and Wholesalers
- 9.4.3. Online
- 9.5. Market Analysis, Insights and Forecast - by End User Industry
- 9.5.1. Consumer Electronics
- 9.5.2. Telecommunications
- 9.5.3. Manufacturing
- 9.5.4. Automotive & Transportation
- 9.5.5. Healthcare
- 9.5.6. Energy & Utilities
- 9.5.7. Retail
- 9.5.8. Others
- 9.1. Market Analysis, Insights and Forecast - by Product Type
- 10. Middle East & Africa 5G RedCap Chip Analysis, Insights and Forecast, 2020-2032
- 10.1. Market Analysis, Insights and Forecast - by Product Type
- 10.1.1. Single Mode Chip
- 10.1.2. Dual Mode Chip
- 10.2. Market Analysis, Insights and Forecast - by Frequency Band
- 10.2.1. Sub-6 GHz (FR1)
- 10.2.2. mmWave (FR2)
- 10.3. Market Analysis, Insights and Forecast - by Application
- 10.3.1. Routers & Gateways
- 10.3.2. Cameras
- 10.3.3. Customer Premises Equipment (CPE)
- 10.3.4. Telematics & Automotive
- 10.3.5. Wearables
- 10.3.6. Smart Metering
- 10.3.7. Others
- 10.4. Market Analysis, Insights and Forecast - by Distribution Channel
- 10.4.1. Direct Sales
- 10.4.2. Distributors and Wholesalers
- 10.4.3. Online
- 10.5. Market Analysis, Insights and Forecast - by End User Industry
- 10.5.1. Consumer Electronics
- 10.5.2. Telecommunications
- 10.5.3. Manufacturing
- 10.5.4. Automotive & Transportation
- 10.5.5. Healthcare
- 10.5.6. Energy & Utilities
- 10.5.7. Retail
- 10.5.8. Others
- 10.1. Market Analysis, Insights and Forecast - by Product Type
- 11. Asia Pacific 5G RedCap Chip Analysis, Insights and Forecast, 2020-2032
- 11.1. Market Analysis, Insights and Forecast - by Product Type
- 11.1.1. Single Mode Chip
- 11.1.2. Dual Mode Chip
- 11.2. Market Analysis, Insights and Forecast - by Frequency Band
- 11.2.1. Sub-6 GHz (FR1)
- 11.2.2. mmWave (FR2)
- 11.3. Market Analysis, Insights and Forecast - by Application
- 11.3.1. Routers & Gateways
- 11.3.2. Cameras
- 11.3.3. Customer Premises Equipment (CPE)
- 11.3.4. Telematics & Automotive
- 11.3.5. Wearables
- 11.3.6. Smart Metering
- 11.3.7. Others
- 11.4. Market Analysis, Insights and Forecast - by Distribution Channel
- 11.4.1. Direct Sales
- 11.4.2. Distributors and Wholesalers
- 11.4.3. Online
- 11.5. Market Analysis, Insights and Forecast - by End User Industry
- 11.5.1. Consumer Electronics
- 11.5.2. Telecommunications
- 11.5.3. Manufacturing
- 11.5.4. Automotive & Transportation
- 11.5.5. Healthcare
- 11.5.6. Energy & Utilities
- 11.5.7. Retail
- 11.5.8. Others
- 11.1. Market Analysis, Insights and Forecast - by Product Type
- 12. Competitive Analysis
- 12.1. Company Profiles
- 12.1.1 Qualcomm Technologies Inc.
- 12.1.1.1. Company Overview
- 12.1.1.2. Products
- 12.1.1.3. Company Financials
- 12.1.1.4. SWOT Analysis
- 12.1.2 MediaTek Inc.
- 12.1.2.1. Company Overview
- 12.1.2.2. Products
- 12.1.2.3. Company Financials
- 12.1.2.4. SWOT Analysis
- 12.1.3 Samsung Electronics Co. Ltd.
- 12.1.3.1. Company Overview
- 12.1.3.2. Products
- 12.1.3.3. Company Financials
- 12.1.3.4. SWOT Analysis
- 12.1.4 UNISOC Communications Inc.
- 12.1.4.1. Company Overview
- 12.1.4.2. Products
- 12.1.4.3. Company Financials
- 12.1.4.4. SWOT Analysis
- 12.1.5 Sequans Communications S.A.
- 12.1.5.1. Company Overview
- 12.1.5.2. Products
- 12.1.5.3. Company Financials
- 12.1.5.4. SWOT Analysis
- 12.1.6 ASR Microelectronics Co. Ltd.
- 12.1.6.1. Company Overview
- 12.1.6.2. Products
- 12.1.6.3. Company Financials
- 12.1.6.4. SWOT Analysis
- 12.1.7 Huawei Technologies Co. Ltd.
- 12.1.7.1. Company Overview
- 12.1.7.2. Products
- 12.1.7.3. Company Financials
- 12.1.7.4. SWOT Analysis
- 12.1.8 Intel Corporation
- 12.1.8.1. Company Overview
- 12.1.8.2. Products
- 12.1.8.3. Company Financials
- 12.1.8.4. SWOT Analysis
- 12.1.9 Nokia Corporation
- 12.1.9.1. Company Overview
- 12.1.9.2. Products
- 12.1.9.3. Company Financials
- 12.1.9.4. SWOT Analysis
- 12.1.10 Telefonaktiebolaget LM Ericsson
- 12.1.10.1. Company Overview
- 12.1.10.2. Products
- 12.1.10.3. Company Financials
- 12.1.10.4. SWOT Analysis
- 12.1.11 Others
- 12.1.11.1. Company Overview
- 12.1.11.2. Products
- 12.1.11.3. Company Financials
- 12.1.11.4. SWOT Analysis
- 12.1.1 Qualcomm Technologies Inc.
- 12.2. Market Entropy
- 12.2.1 Company's Key Areas Served
- 12.2.2 Recent Developments
- 12.3. Company Market Share Analysis 2025
- 12.3.1 Top 5 Companies Market Share Analysis
- 12.3.2 Top 3 Companies Market Share Analysis
- 12.4. List of Potential Customers
- 13. Research Methodology
List of Figures
- Figure 1: Global 5G RedCap Chip Revenue Breakdown (million, %) by Region 2025 & 2033
- Figure 2: Global 5G RedCap Chip Volume Breakdown (K, %) by Region 2025 & 2033
- Figure 3: North America 5G RedCap Chip Revenue (million), by Product Type 2025 & 2033
- Figure 4: North America 5G RedCap Chip Volume (K), by Product Type 2025 & 2033
- Figure 5: North America 5G RedCap Chip Revenue Share (%), by Product Type 2025 & 2033
- Figure 6: North America 5G RedCap Chip Volume Share (%), by Product Type 2025 & 2033
- Figure 7: North America 5G RedCap Chip Revenue (million), by Frequency Band 2025 & 2033
- Figure 8: North America 5G RedCap Chip Volume (K), by Frequency Band 2025 & 2033
- Figure 9: North America 5G RedCap Chip Revenue Share (%), by Frequency Band 2025 & 2033
- Figure 10: North America 5G RedCap Chip Volume Share (%), by Frequency Band 2025 & 2033
- Figure 11: North America 5G RedCap Chip Revenue (million), by Application 2025 & 2033
- Figure 12: North America 5G RedCap Chip Volume (K), by Application 2025 & 2033
- Figure 13: North America 5G RedCap Chip Revenue Share (%), by Application 2025 & 2033
- Figure 14: North America 5G RedCap Chip Volume Share (%), by Application 2025 & 2033
- Figure 15: North America 5G RedCap Chip Revenue (million), by Distribution Channel 2025 & 2033
- Figure 16: North America 5G RedCap Chip Volume (K), by Distribution Channel 2025 & 2033
- Figure 17: North America 5G RedCap Chip Revenue Share (%), by Distribution Channel 2025 & 2033
- Figure 18: North America 5G RedCap Chip Volume Share (%), by Distribution Channel 2025 & 2033
- Figure 19: North America 5G RedCap Chip Revenue (million), by End User Industry 2025 & 2033
- Figure 20: North America 5G RedCap Chip Volume (K), by End User Industry 2025 & 2033
- Figure 21: North America 5G RedCap Chip Revenue Share (%), by End User Industry 2025 & 2033
- Figure 22: North America 5G RedCap Chip Volume Share (%), by End User Industry 2025 & 2033
- Figure 23: North America 5G RedCap Chip Revenue (million), by Country 2025 & 2033
- Figure 24: North America 5G RedCap Chip Volume (K), by Country 2025 & 2033
- Figure 25: North America 5G RedCap Chip Revenue Share (%), by Country 2025 & 2033
- Figure 26: North America 5G RedCap Chip Volume Share (%), by Country 2025 & 2033
- Figure 27: South America 5G RedCap Chip Revenue (million), by Product Type 2025 & 2033
- Figure 28: South America 5G RedCap Chip Volume (K), by Product Type 2025 & 2033
- Figure 29: South America 5G RedCap Chip Revenue Share (%), by Product Type 2025 & 2033
- Figure 30: South America 5G RedCap Chip Volume Share (%), by Product Type 2025 & 2033
- Figure 31: South America 5G RedCap Chip Revenue (million), by Frequency Band 2025 & 2033
- Figure 32: South America 5G RedCap Chip Volume (K), by Frequency Band 2025 & 2033
- Figure 33: South America 5G RedCap Chip Revenue Share (%), by Frequency Band 2025 & 2033
- Figure 34: South America 5G RedCap Chip Volume Share (%), by Frequency Band 2025 & 2033
- Figure 35: South America 5G RedCap Chip Revenue (million), by Application 2025 & 2033
- Figure 36: South America 5G RedCap Chip Volume (K), by Application 2025 & 2033
- Figure 37: South America 5G RedCap Chip Revenue Share (%), by Application 2025 & 2033
- Figure 38: South America 5G RedCap Chip Volume Share (%), by Application 2025 & 2033
- Figure 39: South America 5G RedCap Chip Revenue (million), by Distribution Channel 2025 & 2033
- Figure 40: South America 5G RedCap Chip Volume (K), by Distribution Channel 2025 & 2033
- Figure 41: South America 5G RedCap Chip Revenue Share (%), by Distribution Channel 2025 & 2033
- Figure 42: South America 5G RedCap Chip Volume Share (%), by Distribution Channel 2025 & 2033
- Figure 43: South America 5G RedCap Chip Revenue (million), by End User Industry 2025 & 2033
- Figure 44: South America 5G RedCap Chip Volume (K), by End User Industry 2025 & 2033
- Figure 45: South America 5G RedCap Chip Revenue Share (%), by End User Industry 2025 & 2033
- Figure 46: South America 5G RedCap Chip Volume Share (%), by End User Industry 2025 & 2033
- Figure 47: South America 5G RedCap Chip Revenue (million), by Country 2025 & 2033
- Figure 48: South America 5G RedCap Chip Volume (K), by Country 2025 & 2033
- Figure 49: South America 5G RedCap Chip Revenue Share (%), by Country 2025 & 2033
- Figure 50: South America 5G RedCap Chip Volume Share (%), by Country 2025 & 2033
- Figure 51: Europe 5G RedCap Chip Revenue (million), by Product Type 2025 & 2033
- Figure 52: Europe 5G RedCap Chip Volume (K), by Product Type 2025 & 2033
- Figure 53: Europe 5G RedCap Chip Revenue Share (%), by Product Type 2025 & 2033
- Figure 54: Europe 5G RedCap Chip Volume Share (%), by Product Type 2025 & 2033
- Figure 55: Europe 5G RedCap Chip Revenue (million), by Frequency Band 2025 & 2033
- Figure 56: Europe 5G RedCap Chip Volume (K), by Frequency Band 2025 & 2033
- Figure 57: Europe 5G RedCap Chip Revenue Share (%), by Frequency Band 2025 & 2033
- Figure 58: Europe 5G RedCap Chip Volume Share (%), by Frequency Band 2025 & 2033
- Figure 59: Europe 5G RedCap Chip Revenue (million), by Application 2025 & 2033
- Figure 60: Europe 5G RedCap Chip Volume (K), by Application 2025 & 2033
- Figure 61: Europe 5G RedCap Chip Revenue Share (%), by Application 2025 & 2033
- Figure 62: Europe 5G RedCap Chip Volume Share (%), by Application 2025 & 2033
- Figure 63: Europe 5G RedCap Chip Revenue (million), by Distribution Channel 2025 & 2033
- Figure 64: Europe 5G RedCap Chip Volume (K), by Distribution Channel 2025 & 2033
- Figure 65: Europe 5G RedCap Chip Revenue Share (%), by Distribution Channel 2025 & 2033
- Figure 66: Europe 5G RedCap Chip Volume Share (%), by Distribution Channel 2025 & 2033
- Figure 67: Europe 5G RedCap Chip Revenue (million), by End User Industry 2025 & 2033
- Figure 68: Europe 5G RedCap Chip Volume (K), by End User Industry 2025 & 2033
- Figure 69: Europe 5G RedCap Chip Revenue Share (%), by End User Industry 2025 & 2033
- Figure 70: Europe 5G RedCap Chip Volume Share (%), by End User Industry 2025 & 2033
- Figure 71: Europe 5G RedCap Chip Revenue (million), by Country 2025 & 2033
- Figure 72: Europe 5G RedCap Chip Volume (K), by Country 2025 & 2033
- Figure 73: Europe 5G RedCap Chip Revenue Share (%), by Country 2025 & 2033
- Figure 74: Europe 5G RedCap Chip Volume Share (%), by Country 2025 & 2033
- Figure 75: Middle East & Africa 5G RedCap Chip Revenue (million), by Product Type 2025 & 2033
- Figure 76: Middle East & Africa 5G RedCap Chip Volume (K), by Product Type 2025 & 2033
- Figure 77: Middle East & Africa 5G RedCap Chip Revenue Share (%), by Product Type 2025 & 2033
- Figure 78: Middle East & Africa 5G RedCap Chip Volume Share (%), by Product Type 2025 & 2033
- Figure 79: Middle East & Africa 5G RedCap Chip Revenue (million), by Frequency Band 2025 & 2033
- Figure 80: Middle East & Africa 5G RedCap Chip Volume (K), by Frequency Band 2025 & 2033
- Figure 81: Middle East & Africa 5G RedCap Chip Revenue Share (%), by Frequency Band 2025 & 2033
- Figure 82: Middle East & Africa 5G RedCap Chip Volume Share (%), by Frequency Band 2025 & 2033
- Figure 83: Middle East & Africa 5G RedCap Chip Revenue (million), by Application 2025 & 2033
- Figure 84: Middle East & Africa 5G RedCap Chip Volume (K), by Application 2025 & 2033
- Figure 85: Middle East & Africa 5G RedCap Chip Revenue Share (%), by Application 2025 & 2033
- Figure 86: Middle East & Africa 5G RedCap Chip Volume Share (%), by Application 2025 & 2033
- Figure 87: Middle East & Africa 5G RedCap Chip Revenue (million), by Distribution Channel 2025 & 2033
- Figure 88: Middle East & Africa 5G RedCap Chip Volume (K), by Distribution Channel 2025 & 2033
- Figure 89: Middle East & Africa 5G RedCap Chip Revenue Share (%), by Distribution Channel 2025 & 2033
- Figure 90: Middle East & Africa 5G RedCap Chip Volume Share (%), by Distribution Channel 2025 & 2033
- Figure 91: Middle East & Africa 5G RedCap Chip Revenue (million), by End User Industry 2025 & 2033
- Figure 92: Middle East & Africa 5G RedCap Chip Volume (K), by End User Industry 2025 & 2033
- Figure 93: Middle East & Africa 5G RedCap Chip Revenue Share (%), by End User Industry 2025 & 2033
- Figure 94: Middle East & Africa 5G RedCap Chip Volume Share (%), by End User Industry 2025 & 2033
- Figure 95: Middle East & Africa 5G RedCap Chip Revenue (million), by Country 2025 & 2033
- Figure 96: Middle East & Africa 5G RedCap Chip Volume (K), by Country 2025 & 2033
- Figure 97: Middle East & Africa 5G RedCap Chip Revenue Share (%), by Country 2025 & 2033
- Figure 98: Middle East & Africa 5G RedCap Chip Volume Share (%), by Country 2025 & 2033
- Figure 99: Asia Pacific 5G RedCap Chip Revenue (million), by Product Type 2025 & 2033
- Figure 100: Asia Pacific 5G RedCap Chip Volume (K), by Product Type 2025 & 2033
- Figure 101: Asia Pacific 5G RedCap Chip Revenue Share (%), by Product Type 2025 & 2033
- Figure 102: Asia Pacific 5G RedCap Chip Volume Share (%), by Product Type 2025 & 2033
- Figure 103: Asia Pacific 5G RedCap Chip Revenue (million), by Frequency Band 2025 & 2033
- Figure 104: Asia Pacific 5G RedCap Chip Volume (K), by Frequency Band 2025 & 2033
- Figure 105: Asia Pacific 5G RedCap Chip Revenue Share (%), by Frequency Band 2025 & 2033
- Figure 106: Asia Pacific 5G RedCap Chip Volume Share (%), by Frequency Band 2025 & 2033
- Figure 107: Asia Pacific 5G RedCap Chip Revenue (million), by Application 2025 & 2033
- Figure 108: Asia Pacific 5G RedCap Chip Volume (K), by Application 2025 & 2033
- Figure 109: Asia Pacific 5G RedCap Chip Revenue Share (%), by Application 2025 & 2033
- Figure 110: Asia Pacific 5G RedCap Chip Volume Share (%), by Application 2025 & 2033
- Figure 111: Asia Pacific 5G RedCap Chip Revenue (million), by Distribution Channel 2025 & 2033
- Figure 112: Asia Pacific 5G RedCap Chip Volume (K), by Distribution Channel 2025 & 2033
- Figure 113: Asia Pacific 5G RedCap Chip Revenue Share (%), by Distribution Channel 2025 & 2033
- Figure 114: Asia Pacific 5G RedCap Chip Volume Share (%), by Distribution Channel 2025 & 2033
- Figure 115: Asia Pacific 5G RedCap Chip Revenue (million), by End User Industry 2025 & 2033
- Figure 116: Asia Pacific 5G RedCap Chip Volume (K), by End User Industry 2025 & 2033
- Figure 117: Asia Pacific 5G RedCap Chip Revenue Share (%), by End User Industry 2025 & 2033
- Figure 118: Asia Pacific 5G RedCap Chip Volume Share (%), by End User Industry 2025 & 2033
- Figure 119: Asia Pacific 5G RedCap Chip Revenue (million), by Country 2025 & 2033
- Figure 120: Asia Pacific 5G RedCap Chip Volume (K), by Country 2025 & 2033
- Figure 121: Asia Pacific 5G RedCap Chip Revenue Share (%), by Country 2025 & 2033
- Figure 122: Asia Pacific 5G RedCap Chip Volume Share (%), by Country 2025 & 2033
List of Tables
- Table 1: Global 5G RedCap Chip Revenue million Forecast, by Product Type 2020 & 2033
- Table 2: Global 5G RedCap Chip Volume K Forecast, by Product Type 2020 & 2033
- Table 3: Global 5G RedCap Chip Revenue million Forecast, by Frequency Band 2020 & 2033
- Table 4: Global 5G RedCap Chip Volume K Forecast, by Frequency Band 2020 & 2033
- Table 5: Global 5G RedCap Chip Revenue million Forecast, by Application 2020 & 2033
- Table 6: Global 5G RedCap Chip Volume K Forecast, by Application 2020 & 2033
- Table 7: Global 5G RedCap Chip Revenue million Forecast, by Distribution Channel 2020 & 2033
- Table 8: Global 5G RedCap Chip Volume K Forecast, by Distribution Channel 2020 & 2033
- Table 9: Global 5G RedCap Chip Revenue million Forecast, by End User Industry 2020 & 2033
- Table 10: Global 5G RedCap Chip Volume K Forecast, by End User Industry 2020 & 2033
- Table 11: Global 5G RedCap Chip Revenue million Forecast, by Region 2020 & 2033
- Table 12: Global 5G RedCap Chip Volume K Forecast, by Region 2020 & 2033
- Table 13: Global 5G RedCap Chip Revenue million Forecast, by Product Type 2020 & 2033
- Table 14: Global 5G RedCap Chip Volume K Forecast, by Product Type 2020 & 2033
- Table 15: Global 5G RedCap Chip Revenue million Forecast, by Frequency Band 2020 & 2033
- Table 16: Global 5G RedCap Chip Volume K Forecast, by Frequency Band 2020 & 2033
- Table 17: Global 5G RedCap Chip Revenue million Forecast, by Application 2020 & 2033
- Table 18: Global 5G RedCap Chip Volume K Forecast, by Application 2020 & 2033
- Table 19: Global 5G RedCap Chip Revenue million Forecast, by Distribution Channel 2020 & 2033
- Table 20: Global 5G RedCap Chip Volume K Forecast, by Distribution Channel 2020 & 2033
- Table 21: Global 5G RedCap Chip Revenue million Forecast, by End User Industry 2020 & 2033
- Table 22: Global 5G RedCap Chip Volume K Forecast, by End User Industry 2020 & 2033
- Table 23: Global 5G RedCap Chip Revenue million Forecast, by Country 2020 & 2033
- Table 24: Global 5G RedCap Chip Volume K Forecast, by Country 2020 & 2033
- Table 25: United States 5G RedCap Chip Revenue (million) Forecast, by Application 2020 & 2033
- Table 26: United States 5G RedCap Chip Volume (K) Forecast, by Application 2020 & 2033
- Table 27: Canada 5G RedCap Chip Revenue (million) Forecast, by Application 2020 & 2033
- Table 28: Canada 5G RedCap Chip Volume (K) Forecast, by Application 2020 & 2033
- Table 29: Mexico 5G RedCap Chip Revenue (million) Forecast, by Application 2020 & 2033
- Table 30: Mexico 5G RedCap Chip Volume (K) Forecast, by Application 2020 & 2033
- Table 31: Global 5G RedCap Chip Revenue million Forecast, by Product Type 2020 & 2033
- Table 32: Global 5G RedCap Chip Volume K Forecast, by Product Type 2020 & 2033
- Table 33: Global 5G RedCap Chip Revenue million Forecast, by Frequency Band 2020 & 2033
- Table 34: Global 5G RedCap Chip Volume K Forecast, by Frequency Band 2020 & 2033
- Table 35: Global 5G RedCap Chip Revenue million Forecast, by Application 2020 & 2033
- Table 36: Global 5G RedCap Chip Volume K Forecast, by Application 2020 & 2033
- Table 37: Global 5G RedCap Chip Revenue million Forecast, by Distribution Channel 2020 & 2033
- Table 38: Global 5G RedCap Chip Volume K Forecast, by Distribution Channel 2020 & 2033
- Table 39: Global 5G RedCap Chip Revenue million Forecast, by End User Industry 2020 & 2033
- Table 40: Global 5G RedCap Chip Volume K Forecast, by End User Industry 2020 & 2033
- Table 41: Global 5G RedCap Chip Revenue million Forecast, by Country 2020 & 2033
- Table 42: Global 5G RedCap Chip Volume K Forecast, by Country 2020 & 2033
- Table 43: Brazil 5G RedCap Chip Revenue (million) Forecast, by Application 2020 & 2033
- Table 44: Brazil 5G RedCap Chip Volume (K) Forecast, by Application 2020 & 2033
- Table 45: Argentina 5G RedCap Chip Revenue (million) Forecast, by Application 2020 & 2033
- Table 46: Argentina 5G RedCap Chip Volume (K) Forecast, by Application 2020 & 2033
- Table 47: Rest of South America 5G RedCap Chip Revenue (million) Forecast, by Application 2020 & 2033
- Table 48: Rest of South America 5G RedCap Chip Volume (K) Forecast, by Application 2020 & 2033
- Table 49: Global 5G RedCap Chip Revenue million Forecast, by Product Type 2020 & 2033
- Table 50: Global 5G RedCap Chip Volume K Forecast, by Product Type 2020 & 2033
- Table 51: Global 5G RedCap Chip Revenue million Forecast, by Frequency Band 2020 & 2033
- Table 52: Global 5G RedCap Chip Volume K Forecast, by Frequency Band 2020 & 2033
- Table 53: Global 5G RedCap Chip Revenue million Forecast, by Application 2020 & 2033
- Table 54: Global 5G RedCap Chip Volume K Forecast, by Application 2020 & 2033
- Table 55: Global 5G RedCap Chip Revenue million Forecast, by Distribution Channel 2020 & 2033
- Table 56: Global 5G RedCap Chip Volume K Forecast, by Distribution Channel 2020 & 2033
- Table 57: Global 5G RedCap Chip Revenue million Forecast, by End User Industry 2020 & 2033
- Table 58: Global 5G RedCap Chip Volume K Forecast, by End User Industry 2020 & 2033
- Table 59: Global 5G RedCap Chip Revenue million Forecast, by Country 2020 & 2033
- Table 60: Global 5G RedCap Chip Volume K Forecast, by Country 2020 & 2033
- Table 61: United Kingdom 5G RedCap Chip Revenue (million) Forecast, by Application 2020 & 2033
- Table 62: United Kingdom 5G RedCap Chip Volume (K) Forecast, by Application 2020 & 2033
- Table 63: Germany 5G RedCap Chip Revenue (million) Forecast, by Application 2020 & 2033
- Table 64: Germany 5G RedCap Chip Volume (K) Forecast, by Application 2020 & 2033
- Table 65: France 5G RedCap Chip Revenue (million) Forecast, by Application 2020 & 2033
- Table 66: France 5G RedCap Chip Volume (K) Forecast, by Application 2020 & 2033
- Table 67: Italy 5G RedCap Chip Revenue (million) Forecast, by Application 2020 & 2033
- Table 68: Italy 5G RedCap Chip Volume (K) Forecast, by Application 2020 & 2033
- Table 69: Spain 5G RedCap Chip Revenue (million) Forecast, by Application 2020 & 2033
- Table 70: Spain 5G RedCap Chip Volume (K) Forecast, by Application 2020 & 2033
- Table 71: Russia 5G RedCap Chip Revenue (million) Forecast, by Application 2020 & 2033
- Table 72: Russia 5G RedCap Chip Volume (K) Forecast, by Application 2020 & 2033
- Table 73: Benelux 5G RedCap Chip Revenue (million) Forecast, by Application 2020 & 2033
- Table 74: Benelux 5G RedCap Chip Volume (K) Forecast, by Application 2020 & 2033
- Table 75: Nordics 5G RedCap Chip Revenue (million) Forecast, by Application 2020 & 2033
- Table 76: Nordics 5G RedCap Chip Volume (K) Forecast, by Application 2020 & 2033
- Table 77: Rest of Europe 5G RedCap Chip Revenue (million) Forecast, by Application 2020 & 2033
- Table 78: Rest of Europe 5G RedCap Chip Volume (K) Forecast, by Application 2020 & 2033
- Table 79: Global 5G RedCap Chip Revenue million Forecast, by Product Type 2020 & 2033
- Table 80: Global 5G RedCap Chip Volume K Forecast, by Product Type 2020 & 2033
- Table 81: Global 5G RedCap Chip Revenue million Forecast, by Frequency Band 2020 & 2033
- Table 82: Global 5G RedCap Chip Volume K Forecast, by Frequency Band 2020 & 2033
- Table 83: Global 5G RedCap Chip Revenue million Forecast, by Application 2020 & 2033
- Table 84: Global 5G RedCap Chip Volume K Forecast, by Application 2020 & 2033
- Table 85: Global 5G RedCap Chip Revenue million Forecast, by Distribution Channel 2020 & 2033
- Table 86: Global 5G RedCap Chip Volume K Forecast, by Distribution Channel 2020 & 2033
- Table 87: Global 5G RedCap Chip Revenue million Forecast, by End User Industry 2020 & 2033
- Table 88: Global 5G RedCap Chip Volume K Forecast, by End User Industry 2020 & 2033
- Table 89: Global 5G RedCap Chip Revenue million Forecast, by Country 2020 & 2033
- Table 90: Global 5G RedCap Chip Volume K Forecast, by Country 2020 & 2033
- Table 91: Turkey 5G RedCap Chip Revenue (million) Forecast, by Application 2020 & 2033
- Table 92: Turkey 5G RedCap Chip Volume (K) Forecast, by Application 2020 & 2033
- Table 93: Israel 5G RedCap Chip Revenue (million) Forecast, by Application 2020 & 2033
- Table 94: Israel 5G RedCap Chip Volume (K) Forecast, by Application 2020 & 2033
- Table 95: GCC 5G RedCap Chip Revenue (million) Forecast, by Application 2020 & 2033
- Table 96: GCC 5G RedCap Chip Volume (K) Forecast, by Application 2020 & 2033
- Table 97: North Africa 5G RedCap Chip Revenue (million) Forecast, by Application 2020 & 2033
- Table 98: North Africa 5G RedCap Chip Volume (K) Forecast, by Application 2020 & 2033
- Table 99: South Africa 5G RedCap Chip Revenue (million) Forecast, by Application 2020 & 2033
- Table 100: South Africa 5G RedCap Chip Volume (K) Forecast, by Application 2020 & 2033
- Table 101: Rest of Middle East & Africa 5G RedCap Chip Revenue (million) Forecast, by Application 2020 & 2033
- Table 102: Rest of Middle East & Africa 5G RedCap Chip Volume (K) Forecast, by Application 2020 & 2033
- Table 103: Global 5G RedCap Chip Revenue million Forecast, by Product Type 2020 & 2033
- Table 104: Global 5G RedCap Chip Volume K Forecast, by Product Type 2020 & 2033
- Table 105: Global 5G RedCap Chip Revenue million Forecast, by Frequency Band 2020 & 2033
- Table 106: Global 5G RedCap Chip Volume K Forecast, by Frequency Band 2020 & 2033
- Table 107: Global 5G RedCap Chip Revenue million Forecast, by Application 2020 & 2033
- Table 108: Global 5G RedCap Chip Volume K Forecast, by Application 2020 & 2033
- Table 109: Global 5G RedCap Chip Revenue million Forecast, by Distribution Channel 2020 & 2033
- Table 110: Global 5G RedCap Chip Volume K Forecast, by Distribution Channel 2020 & 2033
- Table 111: Global 5G RedCap Chip Revenue million Forecast, by End User Industry 2020 & 2033
- Table 112: Global 5G RedCap Chip Volume K Forecast, by End User Industry 2020 & 2033
- Table 113: Global 5G RedCap Chip Revenue million Forecast, by Country 2020 & 2033
- Table 114: Global 5G RedCap Chip Volume K Forecast, by Country 2020 & 2033
- Table 115: China 5G RedCap Chip Revenue (million) Forecast, by Application 2020 & 2033
- Table 116: China 5G RedCap Chip Volume (K) Forecast, by Application 2020 & 2033
- Table 117: India 5G RedCap Chip Revenue (million) Forecast, by Application 2020 & 2033
- Table 118: India 5G RedCap Chip Volume (K) Forecast, by Application 2020 & 2033
- Table 119: Japan 5G RedCap Chip Revenue (million) Forecast, by Application 2020 & 2033
- Table 120: Japan 5G RedCap Chip Volume (K) Forecast, by Application 2020 & 2033
- Table 121: South Korea 5G RedCap Chip Revenue (million) Forecast, by Application 2020 & 2033
- Table 122: South Korea 5G RedCap Chip Volume (K) Forecast, by Application 2020 & 2033
- Table 123: ASEAN 5G RedCap Chip Revenue (million) Forecast, by Application 2020 & 2033
- Table 124: ASEAN 5G RedCap Chip Volume (K) Forecast, by Application 2020 & 2033
- Table 125: Oceania 5G RedCap Chip Revenue (million) Forecast, by Application 2020 & 2033
- Table 126: Oceania 5G RedCap Chip Volume (K) Forecast, by Application 2020 & 2033
- Table 127: Rest of Asia Pacific 5G RedCap Chip Revenue (million) Forecast, by Application 2020 & 2033
- Table 128: Rest of Asia Pacific 5G RedCap Chip Volume (K) Forecast, by Application 2020 & 2033
Frequently Asked Questions
1. What is the projected Compound Annual Growth Rate (CAGR) of the 5G RedCap Chip?
The projected CAGR is approximately 35%.
2. Which companies are prominent players in the 5G RedCap Chip?
Key companies in the market include Qualcomm Technologies, Inc., MediaTek Inc., Samsung Electronics Co., Ltd., UNISOC Communications Inc., Sequans Communications S.A., ASR Microelectronics Co., Ltd., Huawei Technologies Co., Ltd., Intel Corporation, Nokia Corporation, Telefonaktiebolaget LM Ericsson, Others.
3. What are the main segments of the 5G RedCap Chip?
The market segments include Product Type, Frequency Band, Application, Distribution Channel, End User Industry.
4. Can you provide details about the market size?
The market size is estimated to be USD 500 million as of 2022.
5. What are some drivers contributing to market growth?
N/A
6. What are the notable trends driving market growth?
N/A
7. Are there any restraints impacting market growth?
N/A
8. Can you provide examples of recent developments in the market?
N/A
9. What pricing options are available for accessing the report?
Pricing options include single-user, multi-user, and enterprise licenses priced at USD 3950.00, USD 5925.00, and USD 7900.00 respectively.
10. Is the market size provided in terms of value or volume?
The market size is provided in terms of value, measured in million and volume, measured in K.
11. Are there any specific market keywords associated with the report?
Yes, the market keyword associated with the report is "5G RedCap Chip," which aids in identifying and referencing the specific market segment covered.
12. How do I determine which pricing option suits my needs best?
The pricing options vary based on user requirements and access needs. Individual users may opt for single-user licenses, while businesses requiring broader access may choose multi-user or enterprise licenses for cost-effective access to the report.
13. Are there any additional resources or data provided in the 5G RedCap Chip report?
While the report offers comprehensive insights, it's advisable to review the specific contents or supplementary materials provided to ascertain if additional resources or data are available.
14. How can I stay updated on further developments or reports in the 5G RedCap Chip?
To stay informed about further developments, trends, and reports in the 5G RedCap Chip, consider subscribing to industry newsletters, following relevant companies and organizations, or regularly checking reputable industry news sources and publications.
Methodology
Step 1 - Identification of Relevant Samples Size from Population Database


Step 2 - Approaches for Defining Global Market Size (Value, Volume* & Price*)

Note*: In applicable scenarios
Step 3 - Data Sources
Primary Research
- Web Analytics
- Survey Reports
- Research Institute
- Latest Research Reports
- Opinion Leaders
Secondary Research
- Annual Reports
- White Paper
- Latest Press Release
- Industry Association
- Paid Database
- Investor Presentations

Step 4 - Data Triangulation
Involves using different sources of information in order to increase the validity of a study
These sources are likely to be stakeholders in a program - participants, other researchers, program staff, other community members, and so on.
Then we put all data in single framework & apply various statistical tools to find out the dynamic on the market.
During the analysis stage, feedback from the stakeholder groups would be compared to determine areas of agreement as well as areas of divergence