

Key Insights
The Sales Enablement market is poised for significant expansion, projected to reach $3.50 Million in 2025 and experiencing a robust CAGR of 20.23% during the forecast period of 2025-2033. This impressive growth is fueled by several critical drivers, primarily the escalating need for sales teams to enhance their effectiveness and efficiency through technology-driven solutions. As businesses increasingly prioritize a seamless buyer journey and demand data-backed insights into sales performance, sales enablement platforms have become indispensable. The platform segment, encompassing content management, analytics, and training modules, is expected to lead this growth, closely followed by integration and consulting services. The shift towards cloud-based deployments is accelerating, offering greater scalability, accessibility, and cost-effectiveness, which are particularly attractive to Small and Medium-Sized Enterprises (SMEs) looking to compete with larger organizations.
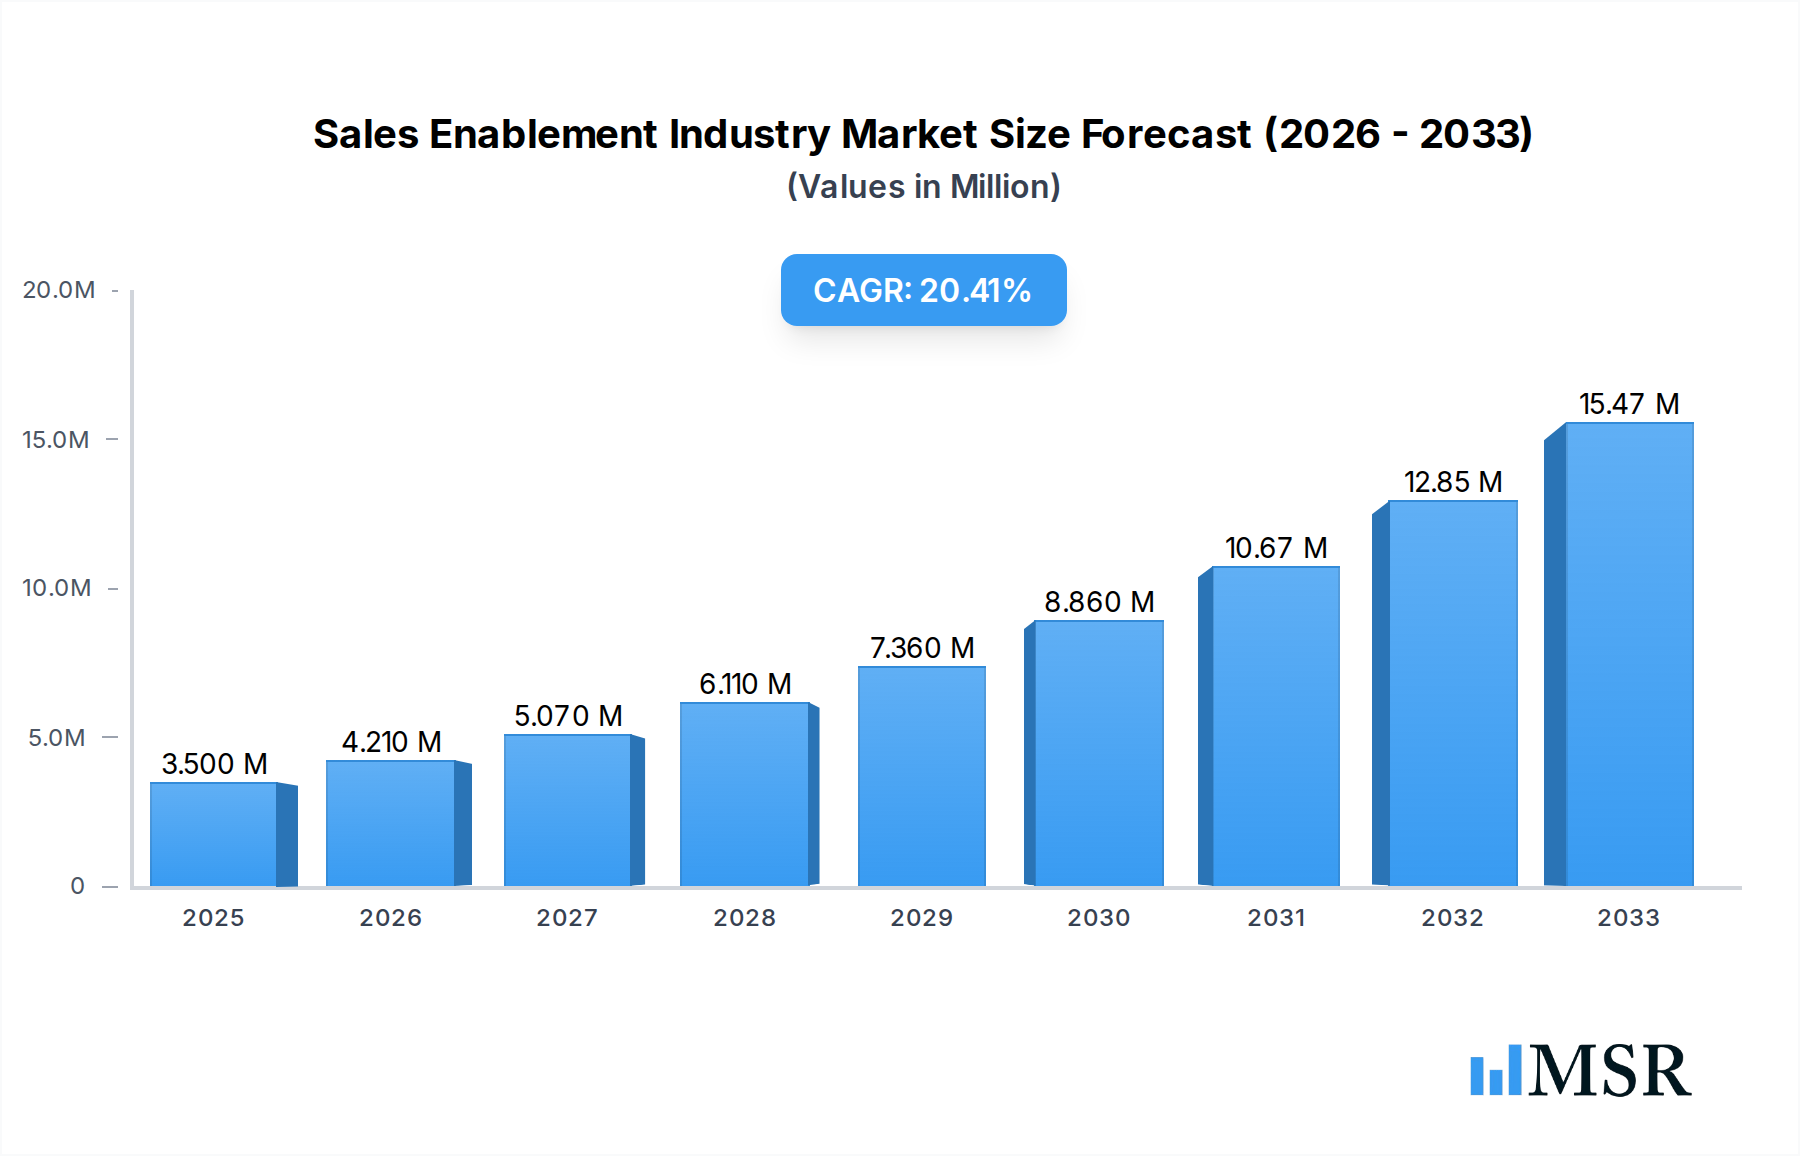
Sales Enablement Industry Market Size (In Million)
The adoption of sales enablement solutions is also being propelled by the evolving landscape of B2B sales, where personalized customer interactions and rapid response times are paramount. Key end-user industries such as BFSI, IT and Telecom, and Healthcare and Life Sciences are at the forefront of this adoption, recognizing the direct impact of effective sales enablement on revenue generation and customer loyalty. While the market benefits from strong growth drivers, it also faces certain restraints, including the initial cost of implementation and the potential challenges in user adoption and integration with existing CRM systems. However, the overwhelming benefits of improved sales productivity, reduced sales cycle times, and enhanced customer engagement are expected to outweigh these challenges, ensuring sustained and dynamic market growth across all major geographical regions, with North America and Europe likely to dominate in the near term due to early adoption and technological maturity.

Sales Enablement Industry Company Market Share
This comprehensive report offers an in-depth analysis of the Sales Enablement Industry, a critical sector driving revenue growth and sales team efficiency across diverse markets. Covering the period from 2019 to 2033, with a base and estimated year of 2025, this study provides unparalleled insights into market dynamics, key trends, emerging opportunities, and the strategic landscape for stakeholders.
Sales Enablement Industry Market Concentration & Dynamics
The Sales Enablement Industry exhibits a moderate to high level of market concentration, with a dynamic interplay of established players and emerging innovators. The sales enablement platform segment, in particular, is witnessing intense competition and a surge in innovation ecosystems. Regulatory frameworks primarily revolve around data privacy (e.g., GDPR, CCPA), impacting how sales enablement tools handle customer information and personalization. Substitute products, such as generic CRM functionalities or manual sales processes, are gradually being outperformed by specialized sales enablement software. End-user trends indicate a strong demand for integrated solutions that enhance sales productivity and content management. Mergers and acquisitions (M&A) are a significant driver of market concentration, with an estimated 15 M&A deals in the historical period (2019-2024) as companies consolidate to offer comprehensive sales enablement solutions. Market share is increasingly being captured by vendors offering advanced analytics and AI-powered insights.
- Market Concentration: Moderate to High
- Innovation Ecosystems: Flourishing, particularly in AI and personalization
- Regulatory Frameworks: Data privacy compliance is paramount
- Substitute Products: Generic CRM, manual processes (declining relevance)
- End-User Trends: Demand for integrated, efficient, and data-driven solutions
- M&A Activities: Active, with an estimated 15 deals in the historical period
- Key M&A Drivers: Market consolidation, acquisition of niche technologies, expansion of product portfolios
Sales Enablement Industry Industry Insights & Trends
The Sales Enablement Industry is projected to experience robust growth, with a projected market size of approximately $15 Billion in 2025, driven by a Compound Annual Growth Rate (CAGR) of 18% from 2025 to 2033. This expansion is fueled by several key factors. Firstly, the increasing complexity of sales cycles and the need for highly informed sales representatives are propelling the adoption of advanced sales enablement tools. Companies are realizing the direct correlation between effective enablement and revenue uplift. Secondly, technological disruptions, including the integration of Artificial Intelligence (AI) and Machine Learning (ML), are transforming the capabilities of sales enablement platforms. AI-powered content recommendation engines, predictive analytics for deal forecasting, and automated coaching modules are becoming standard. Furthermore, evolving consumer behaviors, characterized by a preference for personalized interactions and self-service options, necessitate sales teams equipped with the right content and insights at the right time. The shift towards remote and hybrid work models has also accelerated the demand for cloud-based sales enablement solutions that facilitate collaboration and access to resources from anywhere. Sales enablement services, including training and consulting, are also experiencing significant growth as organizations seek expert guidance in implementing and optimizing their enablement strategies. The growing emphasis on measuring the ROI of sales enablement initiatives further underscores its importance.
Key Markets & Segments Leading Sales Enablement Industry
The Sales Enablement Industry is witnessing significant traction across various segments, with the Platform component leading the market, followed closely by Services.
Component Dominance:
- Platform: The sales enablement platform segment is the largest revenue generator, accounting for an estimated 70% of the market share. This is driven by the comprehensive functionalities offered, including content management, training modules, analytics, and engagement tracking.
- Drivers: Need for centralized sales content, desire for consistent sales messaging, demand for performance analytics, increasing complexity of sales processes.
- Services: Sales enablement services, encompassing consulting, implementation, and training, represent approximately 30% of the market.
- Drivers: Need for expert guidance in strategy development, challenges in integrating new technologies, demand for tailored enablement programs, focus on optimizing user adoption.
- Platform: The sales enablement platform segment is the largest revenue generator, accounting for an estimated 70% of the market share. This is driven by the comprehensive functionalities offered, including content management, training modules, analytics, and engagement tracking.
Organization Size:
- Large Enterprises: This segment dominates, constituting an estimated 65% of the market. Large enterprises have complex sales structures, extensive sales teams, and a greater need for standardized, scalable enablement solutions to drive consistent performance across geographies.
- Drivers: Extensive sales forces, need for centralized control and reporting, significant budget allocation for sales technology, global sales operations.
- Small and Medium-Sized Enterprises (SMEs): SMEs represent a growing segment, accounting for 35% of the market, and are increasingly adopting sales enablement solutions to compete with larger players.
- Drivers: Growing realization of the impact of structured enablement on growth, cost-effective cloud-based solutions, need to professionalize sales processes, desire for competitive advantage.
- Large Enterprises: This segment dominates, constituting an estimated 65% of the market. Large enterprises have complex sales structures, extensive sales teams, and a greater need for standardized, scalable enablement solutions to drive consistent performance across geographies.
Deployment Mode:
- Cloud-based: The cloud-based deployment mode is the undisputed leader, capturing an estimated 85% of the market share. This is due to its scalability, accessibility, cost-effectiveness, and ease of integration, aligning perfectly with the needs of modern businesses.
- Drivers: Flexibility, remote accessibility, lower upfront costs, automatic updates and maintenance, faster deployment times.
- On-premises: The on-premises deployment mode accounts for approximately 15% of the market, primarily used by organizations with stringent data security requirements or legacy IT infrastructure.
- Drivers: Strict data control and security, compliance with specific industry regulations, existing on-premises infrastructure investments.
- Cloud-based: The cloud-based deployment mode is the undisputed leader, capturing an estimated 85% of the market share. This is due to its scalability, accessibility, cost-effectiveness, and ease of integration, aligning perfectly with the needs of modern businesses.
End-user Industry:
- BFSI: The Banking, Financial Services, and Insurance (BFSI) sector is a major adopter, representing approximately 25% of the market. The complex product portfolios, regulatory environments, and need for consistent customer engagement make sales enablement crucial.
- Drivers: Highly regulated environment, complex financial products, need for sophisticated sales training, focus on customer relationship management.
- IT and Telecom: This sector accounts for an estimated 20% of the market. The rapid pace of technological change and competitive landscape necessitate continuous upskilling of sales teams.
- Drivers: Rapid product innovation, competitive market, need for technical sales expertise, strong focus on solution selling.
- Healthcare and Life Sciences: This industry is a significant contributor, estimated at 18%, due to the specialized nature of products, stringent regulatory requirements, and the need for accurate and compliant sales messaging.
- Drivers: Highly regulated industry, complex scientific information, need for compliance and accuracy, focus on ethical sales practices.
- Consumer Goods and Retail: Estimated at 15%, this sector benefits from improved channel partner enablement and data-driven sales strategies.
- Drivers: High-volume sales, need for efficient channel management, demand for market insights, focus on consumer trends.
- Manufacturing: An estimated 12% of the market is driven by manufacturing, where complex product offerings and long sales cycles require robust enablement.
- Drivers: Complex B2B sales, need for technical sales support, long sales cycles, emphasis on relationship selling.
- Media and Entertainment: Estimated at 10%, this sector utilizes sales enablement for efficient campaign management and audience engagement strategies.
- Drivers: Dynamic market, need for creative content, focus on audience engagement, competitive advertising landscape.
- Other End-user Industries: Comprising the remaining percentage, these include sectors like education, government, and non-profits, all seeking to improve sales effectiveness.
- BFSI: The Banking, Financial Services, and Insurance (BFSI) sector is a major adopter, representing approximately 25% of the market. The complex product portfolios, regulatory environments, and need for consistent customer engagement make sales enablement crucial.
Sales Enablement Industry Product Developments
The Sales Enablement Industry is characterized by continuous product innovation. Key advancements include the integration of AI for personalized content recommendations and sales coaching, enhanced analytics for measuring sales performance, and the development of mobile-first solutions for field sales teams. Companies like Highspot and Showpad are leading the charge in creating unified platforms that seamlessly integrate with CRM and marketing automation tools. Interactive content capabilities, powered by platforms like Ceros, are becoming more prevalent, enabling richer and more engaging sales presentations. The focus is shifting towards creating intuitive user experiences that reduce friction for sales reps and maximize adoption rates.
Challenges in the Sales Enablement Industry Market
Despite its rapid growth, the Sales Enablement Industry faces several challenges. Low user adoption rates due to poor user experience or lack of adequate training remain a significant hurdle, impacting the perceived ROI of sales enablement solutions. The complexity of integrating new sales enablement platforms with existing CRM and other sales technology stacks can be a barrier for many organizations. Furthermore, the ever-evolving sales landscape and the need for continuous content updates require significant ongoing effort. The challenge of accurately measuring the ROI of sales enablement initiatives continues to be a concern for some businesses, requiring robust analytics and reporting capabilities.
- Low User Adoption: Poor UX, inadequate training.
- Integration Complexity: Difficulty in connecting with existing sales tech stacks.
- Content Management Burden: Constant need for updates and relevance.
- ROI Measurement: Demonstrating tangible business impact.
Forces Driving Sales Enablement Industry Growth
Several powerful forces are propelling the growth of the Sales Enablement Industry. The increasing demand for personalized customer experiences necessitates equipping sales teams with the right content and insights at the right moment. Technological advancements, particularly in AI and machine learning, are enabling more intelligent and automated sales enablement solutions. The shift towards remote and hybrid work models has underscored the need for accessible, cloud-based tools that facilitate seamless collaboration and knowledge sharing among distributed sales teams. Moreover, the competitive pressure to increase sales productivity and shorten sales cycles is a primary driver for organizations to invest in effective sales enablement strategies.
Challenges in the Sales Enablement Industry Market
Long-term growth catalysts for the Sales Enablement Industry lie in continued innovation and strategic expansion. The integration of generative AI for content creation and sales coaching holds immense potential to further revolutionize the market. Strategic partnerships, such as the one between Ceros, Highspot, and Showpad, are crucial for creating comprehensive, integrated ecosystems that offer end-to-end sales and marketing solutions. Market expansion into emerging economies and untapped industry verticals will also contribute to sustained growth. The increasing maturity of the market will also see a greater emphasis on specialized sales enablement solutions tailored to specific industries and roles.
Emerging Opportunities in Sales Enablement Industry
Emerging opportunities within the Sales Enablement Industry are abundant. The rise of revenue intelligence platforms, which combine sales enablement with deeper analytics and forecasting, presents a significant growth avenue. The demand for hyper-personalization in sales interactions, driven by advanced data analytics and AI, will fuel the development of more sophisticated enablement tools. The growing importance of sales coaching and continuous learning within sales organizations will create a market for specialized AI-driven coaching platforms. Furthermore, the integration of sales enablement with broader customer experience (CX) strategies offers a significant opportunity for vendors to become central to a company's overall growth engine.
Leading Players in the Sales Enablement Industry Sector
- Showpad
- Qorus Software Ltd
- ClearSlide
- Mediafly
- MindTickle
- Rallyware Inc
- Accent Technologies
- Seismic Software Inc
- Highspot Inc
- Quark
- DocSend Inc
- Upland Software
- GetAccept Inc
- Pitcher
- Brainshark
- Bigtincan Holdings
- Qstream Inc
- Outreach
Key Milestones in Sales Enablement Industry Industry
- March 2022: Ceros, the cloud-based, no-code design platform for interactive content, announced its partnership with Highspot and Showpad, sales enablement vendors. These partnerships will provide Ceros the ability to achieve its mission to create an innovative integrated suite for all designers and marketers, from enterprise clients to citizen creators.
- February 2022: Semrush, an online visibility management SaaS platform, announced its plan to acquire Kompyte, a competitive intelligence automation and sales enablement platform. The acquisition will enable Semrush's capability to competitive intelligence automation and provide a robust sales enablement platform, considering 88% of Kompyte's total user base falls within sales organizations.
Strategic Outlook for Sales Enablement Industry Market
The strategic outlook for the Sales Enablement Industry market is exceptionally bright, driven by a confluence of technological advancements, evolving sales methodologies, and a persistent focus on revenue growth. Future market potential lies in the deeper integration of AI and machine learning to automate complex sales tasks, personalize sales outreach at scale, and provide predictive insights. Strategic opportunities include the development of end-to-end revenue enablement solutions that bridge the gap between sales and marketing, and the expansion of specialized enablement offerings for niche industries and roles. Partnerships and acquisitions will continue to shape the landscape, creating comprehensive platforms that address the entire sales lifecycle, thereby solidifying the indispensable role of sales enablement in modern business success.
Sales Enablement Industry Segmentation
-
1. Component
- 1.1. Platform
- 1.2. Services
-
2. Organization Size
- 2.1. Large Enterprises
- 2.2. Small and Medium-Sized Enterprises
-
3. Deployment Mode
- 3.1. Cloud-based
- 3.2. On-premises
-
4. End-user Industry
- 4.1. BFSI
- 4.2. Consumer Goods and Retail
- 4.3. IT and Telecom
- 4.4. Media and Entertainment
- 4.5. Healthcare and Life Sciences
- 4.6. Manufacturing
- 4.7. Other End-user Industries
Sales Enablement Industry Segmentation By Geography
- 1. North America
- 2. Europe
- 3. Asia Pacific
- 4. Latin America
- 5. Middle East and Africa

Sales Enablement Industry Regional Market Share
Geographic Coverage of Sales Enablement Industry
Sales Enablement Industry REPORT HIGHLIGHTS
| Aspects | Details |
|---|---|
| Study Period | 2020-2034 |
| Base Year | 2025 |
| Estimated Year | 2026 |
| Forecast Period | 2026-2034 |
| Historical Period | 2020-2025 |
| Growth Rate | CAGR of 20.23% from 2020-2034 |
| Segmentation |
|
Table of Contents
- 1. Introduction
- 1.1. Research Scope
- 1.2. Market Segmentation
- 1.3. Research Objective
- 1.4. Definitions and Assumptions
- 2. Executive Summary
- 2.1. Market Snapshot
- 3. Market Dynamics
- 3.1. Market Drivers
- 3.2. Market Restrains
- 3.3. Market Trends
- 3.4. Market Opportunities
- 4. Market Factor Analysis
- 4.1. Porters Five Forces
- 4.1.1. Bargaining Power of Suppliers
- 4.1.2. Bargaining Power of Buyers
- 4.1.3. Threat of New Entrants
- 4.1.4. Threat of Substitutes
- 4.1.5. Competitive Rivalry
- 4.2. PESTEL analysis
- 4.3. BCG Analysis
- 4.3.1. Stars (High Growth, High Market Share)
- 4.3.2. Cash Cows (Low Growth, High Market Share)
- 4.3.3. Question Mark (High Growth, Low Market Share)
- 4.3.4. Dogs (Low Growth, Low Market Share)
- 4.4. Ansoff Matrix Analysis
- 4.5. Supply Chain Analysis
- 4.6. Regulatory Landscape
- 4.7. Current Market Potential and Opportunity Assessment (TAM–SAM–SOM Framework)
- 4.8. MSR Analyst Note
- 4.1. Porters Five Forces
- 5. Market Analysis, Insights and Forecast 2021-2033
- 5.1. Market Analysis, Insights and Forecast - by Component
- 5.1.1. Platform
- 5.1.2. Services
- 5.2. Market Analysis, Insights and Forecast - by Organization Size
- 5.2.1. Large Enterprises
- 5.2.2. Small and Medium-Sized Enterprises
- 5.3. Market Analysis, Insights and Forecast - by Deployment Mode
- 5.3.1. Cloud-based
- 5.3.2. On-premises
- 5.4. Market Analysis, Insights and Forecast - by End-user Industry
- 5.4.1. BFSI
- 5.4.2. Consumer Goods and Retail
- 5.4.3. IT and Telecom
- 5.4.4. Media and Entertainment
- 5.4.5. Healthcare and Life Sciences
- 5.4.6. Manufacturing
- 5.4.7. Other End-user Industries
- 5.5. Market Analysis, Insights and Forecast - by Region
- 5.5.1. North America
- 5.5.2. Europe
- 5.5.3. Asia Pacific
- 5.5.4. Latin America
- 5.5.5. Middle East and Africa
- 5.1. Market Analysis, Insights and Forecast - by Component
- 6. Global Sales Enablement Industry Analysis, Insights and Forecast, 2021-2033
- 6.1. Market Analysis, Insights and Forecast - by Component
- 6.1.1. Platform
- 6.1.2. Services
- 6.2. Market Analysis, Insights and Forecast - by Organization Size
- 6.2.1. Large Enterprises
- 6.2.2. Small and Medium-Sized Enterprises
- 6.3. Market Analysis, Insights and Forecast - by Deployment Mode
- 6.3.1. Cloud-based
- 6.3.2. On-premises
- 6.4. Market Analysis, Insights and Forecast - by End-user Industry
- 6.4.1. BFSI
- 6.4.2. Consumer Goods and Retail
- 6.4.3. IT and Telecom
- 6.4.4. Media and Entertainment
- 6.4.5. Healthcare and Life Sciences
- 6.4.6. Manufacturing
- 6.4.7. Other End-user Industries
- 6.1. Market Analysis, Insights and Forecast - by Component
- 7. North America Sales Enablement Industry Analysis, Insights and Forecast, 2020-2032
- 7.1. Market Analysis, Insights and Forecast - by Component
- 7.1.1. Platform
- 7.1.2. Services
- 7.2. Market Analysis, Insights and Forecast - by Organization Size
- 7.2.1. Large Enterprises
- 7.2.2. Small and Medium-Sized Enterprises
- 7.3. Market Analysis, Insights and Forecast - by Deployment Mode
- 7.3.1. Cloud-based
- 7.3.2. On-premises
- 7.4. Market Analysis, Insights and Forecast - by End-user Industry
- 7.4.1. BFSI
- 7.4.2. Consumer Goods and Retail
- 7.4.3. IT and Telecom
- 7.4.4. Media and Entertainment
- 7.4.5. Healthcare and Life Sciences
- 7.4.6. Manufacturing
- 7.4.7. Other End-user Industries
- 7.1. Market Analysis, Insights and Forecast - by Component
- 8. Europe Sales Enablement Industry Analysis, Insights and Forecast, 2020-2032
- 8.1. Market Analysis, Insights and Forecast - by Component
- 8.1.1. Platform
- 8.1.2. Services
- 8.2. Market Analysis, Insights and Forecast - by Organization Size
- 8.2.1. Large Enterprises
- 8.2.2. Small and Medium-Sized Enterprises
- 8.3. Market Analysis, Insights and Forecast - by Deployment Mode
- 8.3.1. Cloud-based
- 8.3.2. On-premises
- 8.4. Market Analysis, Insights and Forecast - by End-user Industry
- 8.4.1. BFSI
- 8.4.2. Consumer Goods and Retail
- 8.4.3. IT and Telecom
- 8.4.4. Media and Entertainment
- 8.4.5. Healthcare and Life Sciences
- 8.4.6. Manufacturing
- 8.4.7. Other End-user Industries
- 8.1. Market Analysis, Insights and Forecast - by Component
- 9. Asia Pacific Sales Enablement Industry Analysis, Insights and Forecast, 2020-2032
- 9.1. Market Analysis, Insights and Forecast - by Component
- 9.1.1. Platform
- 9.1.2. Services
- 9.2. Market Analysis, Insights and Forecast - by Organization Size
- 9.2.1. Large Enterprises
- 9.2.2. Small and Medium-Sized Enterprises
- 9.3. Market Analysis, Insights and Forecast - by Deployment Mode
- 9.3.1. Cloud-based
- 9.3.2. On-premises
- 9.4. Market Analysis, Insights and Forecast - by End-user Industry
- 9.4.1. BFSI
- 9.4.2. Consumer Goods and Retail
- 9.4.3. IT and Telecom
- 9.4.4. Media and Entertainment
- 9.4.5. Healthcare and Life Sciences
- 9.4.6. Manufacturing
- 9.4.7. Other End-user Industries
- 9.1. Market Analysis, Insights and Forecast - by Component
- 10. Latin America Sales Enablement Industry Analysis, Insights and Forecast, 2020-2032
- 10.1. Market Analysis, Insights and Forecast - by Component
- 10.1.1. Platform
- 10.1.2. Services
- 10.2. Market Analysis, Insights and Forecast - by Organization Size
- 10.2.1. Large Enterprises
- 10.2.2. Small and Medium-Sized Enterprises
- 10.3. Market Analysis, Insights and Forecast - by Deployment Mode
- 10.3.1. Cloud-based
- 10.3.2. On-premises
- 10.4. Market Analysis, Insights and Forecast - by End-user Industry
- 10.4.1. BFSI
- 10.4.2. Consumer Goods and Retail
- 10.4.3. IT and Telecom
- 10.4.4. Media and Entertainment
- 10.4.5. Healthcare and Life Sciences
- 10.4.6. Manufacturing
- 10.4.7. Other End-user Industries
- 10.1. Market Analysis, Insights and Forecast - by Component
- 11. Middle East and Africa Sales Enablement Industry Analysis, Insights and Forecast, 2020-2032
- 11.1. Market Analysis, Insights and Forecast - by Component
- 11.1.1. Platform
- 11.1.2. Services
- 11.2. Market Analysis, Insights and Forecast - by Organization Size
- 11.2.1. Large Enterprises
- 11.2.2. Small and Medium-Sized Enterprises
- 11.3. Market Analysis, Insights and Forecast - by Deployment Mode
- 11.3.1. Cloud-based
- 11.3.2. On-premises
- 11.4. Market Analysis, Insights and Forecast - by End-user Industry
- 11.4.1. BFSI
- 11.4.2. Consumer Goods and Retail
- 11.4.3. IT and Telecom
- 11.4.4. Media and Entertainment
- 11.4.5. Healthcare and Life Sciences
- 11.4.6. Manufacturing
- 11.4.7. Other End-user Industries
- 11.1. Market Analysis, Insights and Forecast - by Component
- 12. Competitive Analysis
- 12.1. Company Profiles
- 12.1.1 Showpad
- 12.1.1.1. Company Overview
- 12.1.1.2. Products
- 12.1.1.3. Company Financials
- 12.1.1.4. SWOT Analysis
- 12.1.2 Qorus Software Ltd
- 12.1.2.1. Company Overview
- 12.1.2.2. Products
- 12.1.2.3. Company Financials
- 12.1.2.4. SWOT Analysis
- 12.1.3 ClearSlide
- 12.1.3.1. Company Overview
- 12.1.3.2. Products
- 12.1.3.3. Company Financials
- 12.1.3.4. SWOT Analysis
- 12.1.4 Mediafly
- 12.1.4.1. Company Overview
- 12.1.4.2. Products
- 12.1.4.3. Company Financials
- 12.1.4.4. SWOT Analysis
- 12.1.5 MindTickle
- 12.1.5.1. Company Overview
- 12.1.5.2. Products
- 12.1.5.3. Company Financials
- 12.1.5.4. SWOT Analysis
- 12.1.6 Rallyware Inc
- 12.1.6.1. Company Overview
- 12.1.6.2. Products
- 12.1.6.3. Company Financials
- 12.1.6.4. SWOT Analysis
- 12.1.7 Accent Technologies
- 12.1.7.1. Company Overview
- 12.1.7.2. Products
- 12.1.7.3. Company Financials
- 12.1.7.4. SWOT Analysis
- 12.1.8 Seismic Software Inc
- 12.1.8.1. Company Overview
- 12.1.8.2. Products
- 12.1.8.3. Company Financials
- 12.1.8.4. SWOT Analysis
- 12.1.9 Highspot Inc
- 12.1.9.1. Company Overview
- 12.1.9.2. Products
- 12.1.9.3. Company Financials
- 12.1.9.4. SWOT Analysis
- 12.1.10 Quark
- 12.1.10.1. Company Overview
- 12.1.10.2. Products
- 12.1.10.3. Company Financials
- 12.1.10.4. SWOT Analysis
- 12.1.11 DocSend Inc
- 12.1.11.1. Company Overview
- 12.1.11.2. Products
- 12.1.11.3. Company Financials
- 12.1.11.4. SWOT Analysis
- 12.1.12 Upland Software
- 12.1.12.1. Company Overview
- 12.1.12.2. Products
- 12.1.12.3. Company Financials
- 12.1.12.4. SWOT Analysis
- 12.1.13 GetAccept Inc
- 12.1.13.1. Company Overview
- 12.1.13.2. Products
- 12.1.13.3. Company Financials
- 12.1.13.4. SWOT Analysis
- 12.1.14 Pitcher
- 12.1.14.1. Company Overview
- 12.1.14.2. Products
- 12.1.14.3. Company Financials
- 12.1.14.4. SWOT Analysis
- 12.1.15 Brainshark
- 12.1.15.1. Company Overview
- 12.1.15.2. Products
- 12.1.15.3. Company Financials
- 12.1.15.4. SWOT Analysis
- 12.1.16 Bigtincan Holdings
- 12.1.16.1. Company Overview
- 12.1.16.2. Products
- 12.1.16.3. Company Financials
- 12.1.16.4. SWOT Analysis
- 12.1.17 Qstream Inc
- 12.1.17.1. Company Overview
- 12.1.17.2. Products
- 12.1.17.3. Company Financials
- 12.1.17.4. SWOT Analysis
- 12.1.18 Outreach
- 12.1.18.1. Company Overview
- 12.1.18.2. Products
- 12.1.18.3. Company Financials
- 12.1.18.4. SWOT Analysis
- 12.1.1 Showpad
- 12.2. Market Entropy
- 12.2.1 Company's Key Areas Served
- 12.2.2 Recent Developments
- 12.3. Company Market Share Analysis 2025
- 12.3.1 Top 5 Companies Market Share Analysis
- 12.3.2 Top 3 Companies Market Share Analysis
- 12.4. List of Potential Customers
- 13. Research Methodology
List of Figures
- Figure 1: Global Sales Enablement Industry Revenue Breakdown (Million, %) by Region 2025 & 2033
- Figure 2: North America Sales Enablement Industry Revenue (Million), by Component 2025 & 2033
- Figure 3: North America Sales Enablement Industry Revenue Share (%), by Component 2025 & 2033
- Figure 4: North America Sales Enablement Industry Revenue (Million), by Organization Size 2025 & 2033
- Figure 5: North America Sales Enablement Industry Revenue Share (%), by Organization Size 2025 & 2033
- Figure 6: North America Sales Enablement Industry Revenue (Million), by Deployment Mode 2025 & 2033
- Figure 7: North America Sales Enablement Industry Revenue Share (%), by Deployment Mode 2025 & 2033
- Figure 8: North America Sales Enablement Industry Revenue (Million), by End-user Industry 2025 & 2033
- Figure 9: North America Sales Enablement Industry Revenue Share (%), by End-user Industry 2025 & 2033
- Figure 10: North America Sales Enablement Industry Revenue (Million), by Country 2025 & 2033
- Figure 11: North America Sales Enablement Industry Revenue Share (%), by Country 2025 & 2033
- Figure 12: Europe Sales Enablement Industry Revenue (Million), by Component 2025 & 2033
- Figure 13: Europe Sales Enablement Industry Revenue Share (%), by Component 2025 & 2033
- Figure 14: Europe Sales Enablement Industry Revenue (Million), by Organization Size 2025 & 2033
- Figure 15: Europe Sales Enablement Industry Revenue Share (%), by Organization Size 2025 & 2033
- Figure 16: Europe Sales Enablement Industry Revenue (Million), by Deployment Mode 2025 & 2033
- Figure 17: Europe Sales Enablement Industry Revenue Share (%), by Deployment Mode 2025 & 2033
- Figure 18: Europe Sales Enablement Industry Revenue (Million), by End-user Industry 2025 & 2033
- Figure 19: Europe Sales Enablement Industry Revenue Share (%), by End-user Industry 2025 & 2033
- Figure 20: Europe Sales Enablement Industry Revenue (Million), by Country 2025 & 2033
- Figure 21: Europe Sales Enablement Industry Revenue Share (%), by Country 2025 & 2033
- Figure 22: Asia Pacific Sales Enablement Industry Revenue (Million), by Component 2025 & 2033
- Figure 23: Asia Pacific Sales Enablement Industry Revenue Share (%), by Component 2025 & 2033
- Figure 24: Asia Pacific Sales Enablement Industry Revenue (Million), by Organization Size 2025 & 2033
- Figure 25: Asia Pacific Sales Enablement Industry Revenue Share (%), by Organization Size 2025 & 2033
- Figure 26: Asia Pacific Sales Enablement Industry Revenue (Million), by Deployment Mode 2025 & 2033
- Figure 27: Asia Pacific Sales Enablement Industry Revenue Share (%), by Deployment Mode 2025 & 2033
- Figure 28: Asia Pacific Sales Enablement Industry Revenue (Million), by End-user Industry 2025 & 2033
- Figure 29: Asia Pacific Sales Enablement Industry Revenue Share (%), by End-user Industry 2025 & 2033
- Figure 30: Asia Pacific Sales Enablement Industry Revenue (Million), by Country 2025 & 2033
- Figure 31: Asia Pacific Sales Enablement Industry Revenue Share (%), by Country 2025 & 2033
- Figure 32: Latin America Sales Enablement Industry Revenue (Million), by Component 2025 & 2033
- Figure 33: Latin America Sales Enablement Industry Revenue Share (%), by Component 2025 & 2033
- Figure 34: Latin America Sales Enablement Industry Revenue (Million), by Organization Size 2025 & 2033
- Figure 35: Latin America Sales Enablement Industry Revenue Share (%), by Organization Size 2025 & 2033
- Figure 36: Latin America Sales Enablement Industry Revenue (Million), by Deployment Mode 2025 & 2033
- Figure 37: Latin America Sales Enablement Industry Revenue Share (%), by Deployment Mode 2025 & 2033
- Figure 38: Latin America Sales Enablement Industry Revenue (Million), by End-user Industry 2025 & 2033
- Figure 39: Latin America Sales Enablement Industry Revenue Share (%), by End-user Industry 2025 & 2033
- Figure 40: Latin America Sales Enablement Industry Revenue (Million), by Country 2025 & 2033
- Figure 41: Latin America Sales Enablement Industry Revenue Share (%), by Country 2025 & 2033
- Figure 42: Middle East and Africa Sales Enablement Industry Revenue (Million), by Component 2025 & 2033
- Figure 43: Middle East and Africa Sales Enablement Industry Revenue Share (%), by Component 2025 & 2033
- Figure 44: Middle East and Africa Sales Enablement Industry Revenue (Million), by Organization Size 2025 & 2033
- Figure 45: Middle East and Africa Sales Enablement Industry Revenue Share (%), by Organization Size 2025 & 2033
- Figure 46: Middle East and Africa Sales Enablement Industry Revenue (Million), by Deployment Mode 2025 & 2033
- Figure 47: Middle East and Africa Sales Enablement Industry Revenue Share (%), by Deployment Mode 2025 & 2033
- Figure 48: Middle East and Africa Sales Enablement Industry Revenue (Million), by End-user Industry 2025 & 2033
- Figure 49: Middle East and Africa Sales Enablement Industry Revenue Share (%), by End-user Industry 2025 & 2033
- Figure 50: Middle East and Africa Sales Enablement Industry Revenue (Million), by Country 2025 & 2033
- Figure 51: Middle East and Africa Sales Enablement Industry Revenue Share (%), by Country 2025 & 2033
List of Tables
- Table 1: Global Sales Enablement Industry Revenue Million Forecast, by Component 2020 & 2033
- Table 2: Global Sales Enablement Industry Revenue Million Forecast, by Organization Size 2020 & 2033
- Table 3: Global Sales Enablement Industry Revenue Million Forecast, by Deployment Mode 2020 & 2033
- Table 4: Global Sales Enablement Industry Revenue Million Forecast, by End-user Industry 2020 & 2033
- Table 5: Global Sales Enablement Industry Revenue Million Forecast, by Region 2020 & 2033
- Table 6: Global Sales Enablement Industry Revenue Million Forecast, by Component 2020 & 2033
- Table 7: Global Sales Enablement Industry Revenue Million Forecast, by Organization Size 2020 & 2033
- Table 8: Global Sales Enablement Industry Revenue Million Forecast, by Deployment Mode 2020 & 2033
- Table 9: Global Sales Enablement Industry Revenue Million Forecast, by End-user Industry 2020 & 2033
- Table 10: Global Sales Enablement Industry Revenue Million Forecast, by Country 2020 & 2033
- Table 11: Global Sales Enablement Industry Revenue Million Forecast, by Component 2020 & 2033
- Table 12: Global Sales Enablement Industry Revenue Million Forecast, by Organization Size 2020 & 2033
- Table 13: Global Sales Enablement Industry Revenue Million Forecast, by Deployment Mode 2020 & 2033
- Table 14: Global Sales Enablement Industry Revenue Million Forecast, by End-user Industry 2020 & 2033
- Table 15: Global Sales Enablement Industry Revenue Million Forecast, by Country 2020 & 2033
- Table 16: Global Sales Enablement Industry Revenue Million Forecast, by Component 2020 & 2033
- Table 17: Global Sales Enablement Industry Revenue Million Forecast, by Organization Size 2020 & 2033
- Table 18: Global Sales Enablement Industry Revenue Million Forecast, by Deployment Mode 2020 & 2033
- Table 19: Global Sales Enablement Industry Revenue Million Forecast, by End-user Industry 2020 & 2033
- Table 20: Global Sales Enablement Industry Revenue Million Forecast, by Country 2020 & 2033
- Table 21: Global Sales Enablement Industry Revenue Million Forecast, by Component 2020 & 2033
- Table 22: Global Sales Enablement Industry Revenue Million Forecast, by Organization Size 2020 & 2033
- Table 23: Global Sales Enablement Industry Revenue Million Forecast, by Deployment Mode 2020 & 2033
- Table 24: Global Sales Enablement Industry Revenue Million Forecast, by End-user Industry 2020 & 2033
- Table 25: Global Sales Enablement Industry Revenue Million Forecast, by Country 2020 & 2033
- Table 26: Global Sales Enablement Industry Revenue Million Forecast, by Component 2020 & 2033
- Table 27: Global Sales Enablement Industry Revenue Million Forecast, by Organization Size 2020 & 2033
- Table 28: Global Sales Enablement Industry Revenue Million Forecast, by Deployment Mode 2020 & 2033
- Table 29: Global Sales Enablement Industry Revenue Million Forecast, by End-user Industry 2020 & 2033
- Table 30: Global Sales Enablement Industry Revenue Million Forecast, by Country 2020 & 2033
Frequently Asked Questions
1. What is the projected Compound Annual Growth Rate (CAGR) of the Sales Enablement Industry?
The projected CAGR is approximately 20.23%.
2. Which companies are prominent players in the Sales Enablement Industry?
Key companies in the market include Showpad, Qorus Software Ltd, ClearSlide, Mediafly, MindTickle, Rallyware Inc, Accent Technologies, Seismic Software Inc, Highspot Inc, Quark, DocSend Inc, Upland Software, GetAccept Inc, Pitcher, Brainshark, Bigtincan Holdings, Qstream Inc, Outreach.
3. What are the main segments of the Sales Enablement Industry?
The market segments include Component, Organization Size, Deployment Mode, End-user Industry.
4. Can you provide details about the market size?
The market size is estimated to be USD 3.50 Million as of 2022.
5. What are some drivers contributing to market growth?
Rising Need to Improve the Internal Business Process; Scaling Sales Efforts With the Help of Advanced Technology.
6. What are the notable trends driving market growth?
Consumer Goods and Retail Industry to Exhibit Significant Growth.
7. Are there any restraints impacting market growth?
Inconsistent User Experience Across Various Access Channels.
8. Can you provide examples of recent developments in the market?
March 2022 - Ceros, the cloud-based, no-code design platform for interactive content, today announced its partnership with Highspot and Showpad, sales enablement vendors. These partnerships will provide the company achieve its mission to create an innovative integrated suite for all designers and marketers, from enterprise clients to citizen creators.
9. What pricing options are available for accessing the report?
Pricing options include single-user, multi-user, and enterprise licenses priced at USD 4750, USD 5250, and USD 8750 respectively.
10. Is the market size provided in terms of value or volume?
The market size is provided in terms of value, measured in Million.
11. Are there any specific market keywords associated with the report?
Yes, the market keyword associated with the report is "Sales Enablement Industry," which aids in identifying and referencing the specific market segment covered.
12. How do I determine which pricing option suits my needs best?
The pricing options vary based on user requirements and access needs. Individual users may opt for single-user licenses, while businesses requiring broader access may choose multi-user or enterprise licenses for cost-effective access to the report.
13. Are there any additional resources or data provided in the Sales Enablement Industry report?
While the report offers comprehensive insights, it's advisable to review the specific contents or supplementary materials provided to ascertain if additional resources or data are available.
14. How can I stay updated on further developments or reports in the Sales Enablement Industry?
To stay informed about further developments, trends, and reports in the Sales Enablement Industry, consider subscribing to industry newsletters, following relevant companies and organizations, or regularly checking reputable industry news sources and publications.
Methodology
Step 1 - Identification of Relevant Samples Size from Population Database


Step 2 - Approaches for Defining Global Market Size (Value, Volume* & Price*)

Note*: In applicable scenarios
Step 3 - Data Sources
Primary Research
- Web Analytics
- Survey Reports
- Research Institute
- Latest Research Reports
- Opinion Leaders
Secondary Research
- Annual Reports
- White Paper
- Latest Press Release
- Industry Association
- Paid Database
- Investor Presentations

Step 4 - Data Triangulation
Involves using different sources of information in order to increase the validity of a study
These sources are likely to be stakeholders in a program - participants, other researchers, program staff, other community members, and so on.
Then we put all data in single framework & apply various statistical tools to find out the dynamic on the market.
During the analysis stage, feedback from the stakeholder groups would be compared to determine areas of agreement as well as areas of divergence