

Key Insights
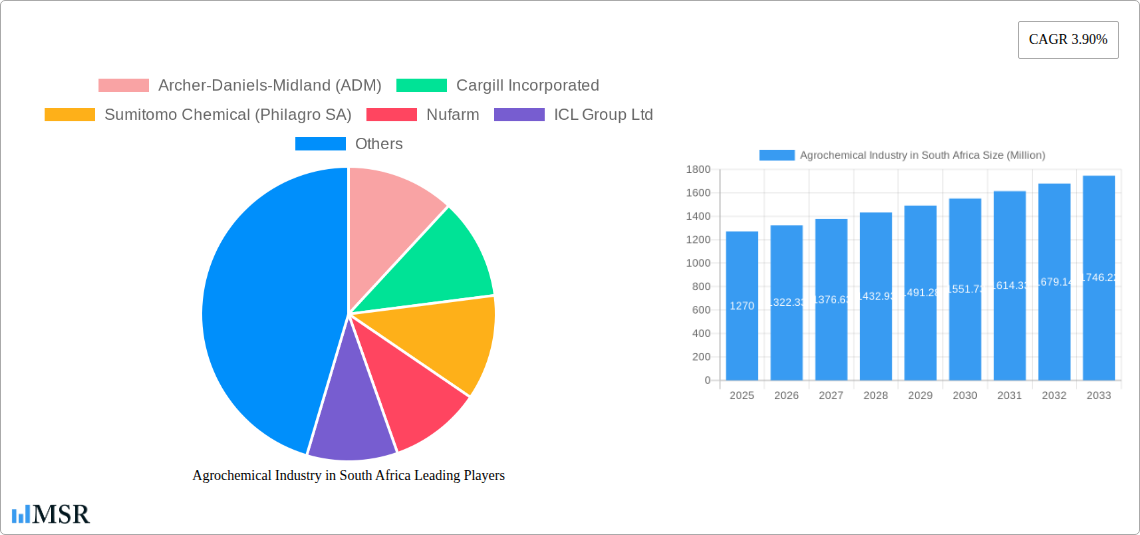
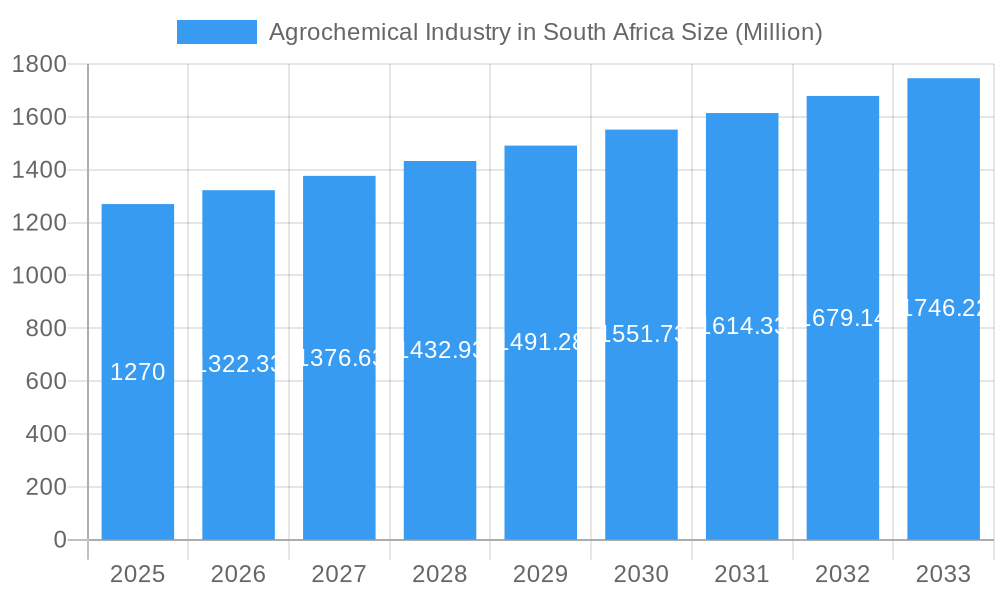
The South African agrochemical market, valued at approximately $1.27 billion in 2025, is projected to experience steady growth, driven by increasing agricultural production, the adoption of modern farming techniques, and government initiatives promoting food security. The market's Compound Annual Growth Rate (CAGR) of 3.90% from 2025 to 2033 indicates a consistent expansion, although challenges remain. Key growth drivers include the rising demand for high-yielding crops to meet domestic consumption and export needs, coupled with a growing awareness of pest and disease management. The market is segmented by product type (fertilizers, pesticides, adjuvants, plant growth regulators) and application (crop-based, fruits and vegetables, turf and ornamental grass, other major crops). While the crop-based segment dominates, the fruits and vegetables segment is anticipated to exhibit faster growth due to increasing consumer demand for fresh produce. However, constraints such as water scarcity, climate change impacting crop yields, and fluctuating raw material prices pose significant challenges to sustained market expansion. Furthermore, regulations concerning pesticide usage and environmental concerns will continue to shape market dynamics. Competition within the sector is intense, with both international and domestic players vying for market share. Major companies operating in South Africa include multinational corporations such as Bayer CropScience, Syngenta, and BASF, alongside regional and local distributors. The market's future growth trajectory will depend on the successful mitigation of these constraints and the continued adoption of sustainable agricultural practices.
Agrochemical Industry in South Africa Market Size (In Billion)
The South African agrochemical market presents lucrative opportunities for investors, particularly in developing innovative and environmentally friendly products. The increasing focus on precision agriculture, including technologies such as drones and sensor-based monitoring systems, is expected to enhance efficiency and optimize resource utilization. Further growth opportunities exist in the development of specialized agrochemicals targeting specific crops and pest management solutions. This will involve collaborations between research institutions, agrochemical companies, and farmers to tailor products to the unique needs of the South African agricultural landscape. Government policies supporting agricultural modernization and sustainability will further shape the market trajectory. Growth in the non-crop segment, like turf and ornamental grasses, will also contribute to overall market expansion, driven by increasing urbanization and landscaping demands. A key success factor for businesses will be to develop robust distribution networks that effectively reach farmers across the diverse agricultural regions of South Africa.
Agrochemical Industry in South Africa Company Market Share
This in-depth report provides a comprehensive analysis of the South African agrochemical industry, covering market dynamics, key segments, leading players, and future growth prospects. The study period spans 2019-2033, with a base year of 2025 and a forecast period of 2025-2033. This report is essential for industry stakeholders, investors, and businesses seeking to understand and capitalize on the opportunities within this dynamic market. The South African agrochemical market, valued at approximately R xx Million in 2025, is projected to experience significant growth in the coming years, driven by factors such as increasing agricultural production, technological advancements, and government initiatives.
Agrochemical Industry in South Africa Market Concentration & Dynamics
The South African agrochemical market is characterized by a moderate level of concentration. A core group of influential multinational corporations commands a substantial portion of the market share. However, this landscape is complemented by a dynamic array of smaller, specialized companies that contribute significantly to innovation and cater to specific needs within the sector. The industry's forward momentum is propelled by a continuous drive for innovation, focused on elevating crop yields, fostering environmentally responsible and sustainable farming methodologies, and developing more effective solutions for pest and disease management. While the regulatory framework is continuously evolving, it plays a pivotal role in shaping product registration processes and dictating usage guidelines. Although substitute products, particularly the rapidly advancing field of biopesticides, are gaining considerable traction and consumer acceptance, traditional agrochemicals continue to maintain their dominant position. End-user trends highlight an increasingly strong preference for the adoption of integrated pest management (IPM) strategies, emphasizing a holistic approach to crop protection. Mergers and acquisitions (M&A) activity within the sector has remained at a moderate pace. Between 2019 and 2024, approximately [Insert Number] deals were recorded, with a primary focus on consolidating market positions and strategically expanding into emerging or underserved segments.
- Market Share: The top 5 players collectively hold approximately [Insert Percentage]% of the market share as of 2025.
- M&A Activity: [Insert Number] deals were recorded in the agrochemical sector between 2019 and 2024.
- Regulatory Landscape: The industry operates under stringent regulations that govern the registration, approval, and responsible usage of agrochemical products.
- Substitute Products: While biopesticides are experiencing a notable surge in adoption and market penetration, conventional chemical agrochemicals still represent the primary market segment.
Agrochemical Industry in South Africa Industry Insights & Trends
The South African agrochemical market is experiencing robust growth, driven by the country's substantial agricultural sector and increasing demand for food security. The market size reached approximately R xx Million in 2025 and is projected to reach R xx Million by 2033, exhibiting a Compound Annual Growth Rate (CAGR) of xx%. Technological disruptions, such as precision agriculture and the development of novel agrochemical formulations, are significantly influencing market dynamics. Evolving consumer behaviors, emphasizing sustainability and environmental responsibility, are pushing the industry towards adopting more environmentally friendly practices. Government initiatives promoting sustainable agriculture further contribute to the market's growth trajectory.
Key Markets & Segments Leading Agrochemical Industry in South Africa
The South African agrochemical market is significantly influenced by the crop-based application segment. This dominance is largely attributed to the substantial scale of production for staple crops such as maize, wheat, and sugarcane, which represent significant demand centers for agrochemical inputs. Within the product categories, the fertilizers segment commands the largest market share. This underscores the critical importance of effective nutrient management strategies in maximizing and sustaining crop productivity across the diverse agricultural landscape of South Africa.
Key Growth Drivers:
- Economic Growth: A robust and expanding economy directly translates to increased investment in agricultural ventures and the adoption of advanced farming practices, thereby stimulating demand for agrochemicals.
- Infrastructure Development: Enhancements in agricultural infrastructure, including the expansion of irrigation systems and the improvement of storage facilities, contribute to greater operational efficiency and a higher demand for crop protection and enhancement solutions.
- Government Support: Proactive government policies that champion sustainable agriculture, promote food security initiatives, and offer incentives for modern farming techniques serve as powerful catalysts for market growth.
Dominance Analysis:
The preeminence of crop-based applications is a direct consequence of South Africa's vast and productive agricultural sector. The large-scale cultivation of major crops inherently requires substantial agrochemical inputs to ensure optimal yields and quality. Similarly, the commanding market share of fertilizers is a testament to their indispensable role in providing essential nutrients for robust crop development. While fruits and vegetables, non-crop-based applications, and the turf and ornamental segments represent smaller market shares, they are identified as dynamic and increasingly important niche markets exhibiting significant growth potential.
Agrochemical Industry in South Africa Product Developments
Significant product innovations are emerging, emphasizing biopesticides, precision application technologies, and formulations that minimize environmental impact. These advancements provide competitive edges for companies focused on sustainable and effective crop protection. The focus is increasingly on products offering improved efficacy, reduced environmental footprint and targeted delivery systems. This translates to better crop yields with minimized environmental risk.
Challenges in the Agrochemical Industry in South Africa Market
Looking towards the long term, several key growth catalysts are poised to shape the agrochemical industry in South Africa. The continuous development and introduction of innovative agrochemical solutions, designed to be more effective and environmentally benign, are paramount. Strategic partnerships that facilitate technology transfer and open up new market avenues are crucial for sustained growth. Additionally, an escalating emphasis on and adoption of sustainable agricultural practices across the farming community is creating a demand for eco-friendly products and approaches, thereby fostering a more resilient and future-proof industry.
Forces Driving Agrochemical Industry in South Africa Growth
Several powerful forces are actively propelling the growth of the agrochemical industry in South Africa. Technological advancements, particularly in areas like precision agriculture and the integration of drone technology for application and monitoring, are revolutionizing farming practices. Favorable economic conditions, exemplified by growing agricultural investment and increased farmer confidence, create a fertile ground for market expansion. Moreover, supportive government policies that actively encourage the adoption of sustainable farming practices and bolster national food security strategies provide a strong impetus for the industry's upward trajectory. These converging factors collectively contribute to an optimistic and robust outlook for the South African agrochemical market.
Challenges in the Agrochemical Industry in South Africa Market
Looking towards the long term, several key growth catalysts are poised to shape the agrochemical industry in South Africa. The continuous development and introduction of innovative agrochemical solutions, designed to be more effective and environmentally benign, are paramount. Strategic partnerships that facilitate technology transfer and open up new market avenues are crucial for sustained growth. Additionally, an escalating emphasis on and adoption of sustainable agricultural practices across the farming community is creating a demand for eco-friendly products and approaches, thereby fostering a more resilient and future-proof industry.
Emerging Opportunities in Agrochemical Industry in South Africa
The South African agrochemical market is ripe with emerging opportunities. The burgeoning sector of biopesticides presents a significant avenue for growth, driven by increasing consumer and regulatory demand for sustainable pest management solutions. Precision agriculture technologies, offering data-driven insights and targeted applications, are transforming crop management and creating new market niches. Furthermore, specialized agrochemicals tailored for niche crops and non-crop applications, such as urban farming and forestry, are gaining prominence. The overarching global and local demand for sustainable practices creates a fertile ground for the innovation and commercialization of environmentally friendly and biodegradable agrochemical products.
Leading Players in the Agrochemical Industry in South Africa Sector
- Archer-Daniels-Midland (ADM)
- Cargill Incorporated
- Sumitomo Chemical (Philagro SA)
- Nufarm
- ICL Group Ltd
- UPL Limited
- BASF SE
- FMC Corporation
- Sociedad Química y Minera de Chile (SQM)
- Belaruskali
- Sasol Limited
- K+S AG
- ADAMA Ltd
- Uralkal
- CF Industries Holdings
- OCP Group
- Land O' Lakes (Villa Crop Protection (Pty) Ltd)
- Yara International ASA
- Syngenta AG
- Nutrien Ltd
- Corteva Agriscience
- Bayer CropScience AG
Key Milestones in Agrochemical Industry in South Africa Industry
- 2020: Launch of a new biopesticide by Company X.
- 2022: Merger between Company Y and Company Z, expanding market reach.
- 2023: Introduction of new regulations impacting product registration.
- 2024: Significant investment in precision agriculture technologies by Company A.
Strategic Outlook for Agrochemical Industry in South Africa Market
The South African agrochemical market is poised for continued growth, driven by technological innovation, supportive government policies, and the increasing demand for sustainable agricultural practices. Strategic opportunities exist for companies focusing on biopesticides, precision agriculture, and sustainable solutions. Expansion into niche markets and strategic partnerships will be crucial for success in this competitive landscape.
Agrochemical Industry in South Africa Segmentation
- 1. Production Analysis
- 2. Consumption Analysis
- 3. Import Market Analysis (Value & Volume)
- 4. Export Market Analysis (Value & Volume)
- 5. Price Trend Analysis
Agrochemical Industry in South Africa Segmentation By Geography
-
1. North America
- 1.1. United States
- 1.2. Canada
- 1.3. Mexico
-
2. South America
- 2.1. Brazil
- 2.2. Argentina
- 2.3. Rest of South America
-
3. Europe
- 3.1. United Kingdom
- 3.2. Germany
- 3.3. France
- 3.4. Italy
- 3.5. Spain
- 3.6. Russia
- 3.7. Benelux
- 3.8. Nordics
- 3.9. Rest of Europe
-
4. Middle East & Africa
- 4.1. Turkey
- 4.2. Israel
- 4.3. GCC
- 4.4. North Africa
- 4.5. South Africa
- 4.6. Rest of Middle East & Africa
-
5. Asia Pacific
- 5.1. China
- 5.2. India
- 5.3. Japan
- 5.4. South Korea
- 5.5. ASEAN
- 5.6. Oceania
- 5.7. Rest of Asia Pacific
Agrochemical Industry in South Africa Regional Market Share
Geographic Coverage of Agrochemical Industry in South Africa
Agrochemical Industry in South Africa REPORT HIGHLIGHTS
| Aspects | Details |
|---|---|
| Study Period | 2020-2034 |
| Base Year | 2025 |
| Estimated Year | 2026 |
| Forecast Period | 2026-2034 |
| Historical Period | 2020-2025 |
| Growth Rate | CAGR of 3.90% from 2020-2034 |
| Segmentation |
|
Table of Contents
- 1. Introduction
- 1.1. Research Scope
- 1.2. Market Segmentation
- 1.3. Research Objective
- 1.4. Definitions and Assumptions
- 2. Executive Summary
- 2.1. Market Snapshot
- 3. Market Dynamics
- 3.1. Market Drivers
- 3.2. Market Restrains
- 3.3. Market Trends
- 3.4. Market Opportunities
- 4. Market Factor Analysis
- 4.1. Porters Five Forces
- 4.1.1. Bargaining Power of Suppliers
- 4.1.2. Bargaining Power of Buyers
- 4.1.3. Threat of New Entrants
- 4.1.4. Threat of Substitutes
- 4.1.5. Competitive Rivalry
- 4.2. PESTEL analysis
- 4.3. BCG Analysis
- 4.3.1. Stars (High Growth, High Market Share)
- 4.3.2. Cash Cows (Low Growth, High Market Share)
- 4.3.3. Question Mark (High Growth, Low Market Share)
- 4.3.4. Dogs (Low Growth, Low Market Share)
- 4.4. Ansoff Matrix Analysis
- 4.5. Supply Chain Analysis
- 4.6. Regulatory Landscape
- 4.7. Current Market Potential and Opportunity Assessment (TAM–SAM–SOM Framework)
- 4.8. MSR Analyst Note
- 4.1. Porters Five Forces
- 5. Market Analysis, Insights and Forecast 2021-2033
- 5.1. Market Analysis, Insights and Forecast - by Production Analysis
- 5.2. Market Analysis, Insights and Forecast - by Consumption Analysis
- 5.3. Market Analysis, Insights and Forecast - by Import Market Analysis (Value & Volume)
- 5.4. Market Analysis, Insights and Forecast - by Export Market Analysis (Value & Volume)
- 5.5. Market Analysis, Insights and Forecast - by Price Trend Analysis
- 5.6. Market Analysis, Insights and Forecast - by Region
- 5.6.1. North America
- 5.6.2. South America
- 5.6.3. Europe
- 5.6.4. Middle East & Africa
- 5.6.5. Asia Pacific
- 6. Global Agrochemical Industry in South Africa Analysis, Insights and Forecast, 2021-2033
- 6.1. Market Analysis, Insights and Forecast - by Production Analysis
- 6.2. Market Analysis, Insights and Forecast - by Consumption Analysis
- 6.3. Market Analysis, Insights and Forecast - by Import Market Analysis (Value & Volume)
- 6.4. Market Analysis, Insights and Forecast - by Export Market Analysis (Value & Volume)
- 6.5. Market Analysis, Insights and Forecast - by Price Trend Analysis
- 7. North America Agrochemical Industry in South Africa Analysis, Insights and Forecast, 2020-2032
- 7.1. Market Analysis, Insights and Forecast - by Production Analysis
- 7.2. Market Analysis, Insights and Forecast - by Consumption Analysis
- 7.3. Market Analysis, Insights and Forecast - by Import Market Analysis (Value & Volume)
- 7.4. Market Analysis, Insights and Forecast - by Export Market Analysis (Value & Volume)
- 7.5. Market Analysis, Insights and Forecast - by Price Trend Analysis
- 8. South America Agrochemical Industry in South Africa Analysis, Insights and Forecast, 2020-2032
- 8.1. Market Analysis, Insights and Forecast - by Production Analysis
- 8.2. Market Analysis, Insights and Forecast - by Consumption Analysis
- 8.3. Market Analysis, Insights and Forecast - by Import Market Analysis (Value & Volume)
- 8.4. Market Analysis, Insights and Forecast - by Export Market Analysis (Value & Volume)
- 8.5. Market Analysis, Insights and Forecast - by Price Trend Analysis
- 9. Europe Agrochemical Industry in South Africa Analysis, Insights and Forecast, 2020-2032
- 9.1. Market Analysis, Insights and Forecast - by Production Analysis
- 9.2. Market Analysis, Insights and Forecast - by Consumption Analysis
- 9.3. Market Analysis, Insights and Forecast - by Import Market Analysis (Value & Volume)
- 9.4. Market Analysis, Insights and Forecast - by Export Market Analysis (Value & Volume)
- 9.5. Market Analysis, Insights and Forecast - by Price Trend Analysis
- 10. Middle East & Africa Agrochemical Industry in South Africa Analysis, Insights and Forecast, 2020-2032
- 10.1. Market Analysis, Insights and Forecast - by Production Analysis
- 10.2. Market Analysis, Insights and Forecast - by Consumption Analysis
- 10.3. Market Analysis, Insights and Forecast - by Import Market Analysis (Value & Volume)
- 10.4. Market Analysis, Insights and Forecast - by Export Market Analysis (Value & Volume)
- 10.5. Market Analysis, Insights and Forecast - by Price Trend Analysis
- 11. Asia Pacific Agrochemical Industry in South Africa Analysis, Insights and Forecast, 2020-2032
- 11.1. Market Analysis, Insights and Forecast - by Production Analysis
- 11.2. Market Analysis, Insights and Forecast - by Consumption Analysis
- 11.3. Market Analysis, Insights and Forecast - by Import Market Analysis (Value & Volume)
- 11.4. Market Analysis, Insights and Forecast - by Export Market Analysis (Value & Volume)
- 11.5. Market Analysis, Insights and Forecast - by Price Trend Analysis
- 12. Competitive Analysis
- 12.1. Company Profiles
- 12.1.1 Archer-Daniels-Midland (ADM)
- 12.1.1.1. Company Overview
- 12.1.1.2. Products
- 12.1.1.3. Company Financials
- 12.1.1.4. SWOT Analysis
- 12.1.2 Cargill Incorporated
- 12.1.2.1. Company Overview
- 12.1.2.2. Products
- 12.1.2.3. Company Financials
- 12.1.2.4. SWOT Analysis
- 12.1.3 Sumitomo Chemical (Philagro SA)
- 12.1.3.1. Company Overview
- 12.1.3.2. Products
- 12.1.3.3. Company Financials
- 12.1.3.4. SWOT Analysis
- 12.1.4 Nufarm
- 12.1.4.1. Company Overview
- 12.1.4.2. Products
- 12.1.4.3. Company Financials
- 12.1.4.4. SWOT Analysis
- 12.1.5 ICL Group Ltd
- 12.1.5.1. Company Overview
- 12.1.5.2. Products
- 12.1.5.3. Company Financials
- 12.1.5.4. SWOT Analysis
- 12.1.6 UPL Limited
- 12.1.6.1. Company Overview
- 12.1.6.2. Products
- 12.1.6.3. Company Financials
- 12.1.6.4. SWOT Analysis
- 12.1.7 BASF SE
- 12.1.7.1. Company Overview
- 12.1.7.2. Products
- 12.1.7.3. Company Financials
- 12.1.7.4. SWOT Analysis
- 12.1.8 FMC Corporation
- 12.1.8.1. Company Overview
- 12.1.8.2. Products
- 12.1.8.3. Company Financials
- 12.1.8.4. SWOT Analysis
- 12.1.9 Sociedad Química y Minera de Chile (SQM)
- 12.1.9.1. Company Overview
- 12.1.9.2. Products
- 12.1.9.3. Company Financials
- 12.1.9.4. SWOT Analysis
- 12.1.10 Belaruskali
- 12.1.10.1. Company Overview
- 12.1.10.2. Products
- 12.1.10.3. Company Financials
- 12.1.10.4. SWOT Analysis
- 12.1.11 Sasol Limited
- 12.1.11.1. Company Overview
- 12.1.11.2. Products
- 12.1.11.3. Company Financials
- 12.1.11.4. SWOT Analysis
- 12.1.12 K+S AG
- 12.1.12.1. Company Overview
- 12.1.12.2. Products
- 12.1.12.3. Company Financials
- 12.1.12.4. SWOT Analysis
- 12.1.13 ADAMA Ltd
- 12.1.13.1. Company Overview
- 12.1.13.2. Products
- 12.1.13.3. Company Financials
- 12.1.13.4. SWOT Analysis
- 12.1.14 Uralkal
- 12.1.14.1. Company Overview
- 12.1.14.2. Products
- 12.1.14.3. Company Financials
- 12.1.14.4. SWOT Analysis
- 12.1.15 CF Industries Holdings
- 12.1.15.1. Company Overview
- 12.1.15.2. Products
- 12.1.15.3. Company Financials
- 12.1.15.4. SWOT Analysis
- 12.1.16 OCP Group
- 12.1.16.1. Company Overview
- 12.1.16.2. Products
- 12.1.16.3. Company Financials
- 12.1.16.4. SWOT Analysis
- 12.1.17 Land O' Lakes (Villa Crop Protection (Pty) Ltd
- 12.1.17.1. Company Overview
- 12.1.17.2. Products
- 12.1.17.3. Company Financials
- 12.1.17.4. SWOT Analysis
- 12.1.18 Yara International ASA
- 12.1.18.1. Company Overview
- 12.1.18.2. Products
- 12.1.18.3. Company Financials
- 12.1.18.4. SWOT Analysis
- 12.1.19 Syngenta AG
- 12.1.19.1. Company Overview
- 12.1.19.2. Products
- 12.1.19.3. Company Financials
- 12.1.19.4. SWOT Analysis
- 12.1.20 Nutrien Ltd
- 12.1.20.1. Company Overview
- 12.1.20.2. Products
- 12.1.20.3. Company Financials
- 12.1.20.4. SWOT Analysis
- 12.1.21 Corteva Agriscience
- 12.1.21.1. Company Overview
- 12.1.21.2. Products
- 12.1.21.3. Company Financials
- 12.1.21.4. SWOT Analysis
- 12.1.22 Bayer CropScience AG
- 12.1.22.1. Company Overview
- 12.1.22.2. Products
- 12.1.22.3. Company Financials
- 12.1.22.4. SWOT Analysis
- 12.1.1 Archer-Daniels-Midland (ADM)
- 12.2. Market Entropy
- 12.2.1 Company's Key Areas Served
- 12.2.2 Recent Developments
- 12.3. Company Market Share Analysis 2025
- 12.3.1 Top 5 Companies Market Share Analysis
- 12.3.2 Top 3 Companies Market Share Analysis
- 12.4. List of Potential Customers
- 13. Research Methodology
List of Figures
- Figure 1: Global Agrochemical Industry in South Africa Revenue Breakdown (Million, %) by Region 2025 & 2033
- Figure 2: North America Agrochemical Industry in South Africa Revenue (Million), by Production Analysis 2025 & 2033
- Figure 3: North America Agrochemical Industry in South Africa Revenue Share (%), by Production Analysis 2025 & 2033
- Figure 4: North America Agrochemical Industry in South Africa Revenue (Million), by Consumption Analysis 2025 & 2033
- Figure 5: North America Agrochemical Industry in South Africa Revenue Share (%), by Consumption Analysis 2025 & 2033
- Figure 6: North America Agrochemical Industry in South Africa Revenue (Million), by Import Market Analysis (Value & Volume) 2025 & 2033
- Figure 7: North America Agrochemical Industry in South Africa Revenue Share (%), by Import Market Analysis (Value & Volume) 2025 & 2033
- Figure 8: North America Agrochemical Industry in South Africa Revenue (Million), by Export Market Analysis (Value & Volume) 2025 & 2033
- Figure 9: North America Agrochemical Industry in South Africa Revenue Share (%), by Export Market Analysis (Value & Volume) 2025 & 2033
- Figure 10: North America Agrochemical Industry in South Africa Revenue (Million), by Price Trend Analysis 2025 & 2033
- Figure 11: North America Agrochemical Industry in South Africa Revenue Share (%), by Price Trend Analysis 2025 & 2033
- Figure 12: North America Agrochemical Industry in South Africa Revenue (Million), by Country 2025 & 2033
- Figure 13: North America Agrochemical Industry in South Africa Revenue Share (%), by Country 2025 & 2033
- Figure 14: South America Agrochemical Industry in South Africa Revenue (Million), by Production Analysis 2025 & 2033
- Figure 15: South America Agrochemical Industry in South Africa Revenue Share (%), by Production Analysis 2025 & 2033
- Figure 16: South America Agrochemical Industry in South Africa Revenue (Million), by Consumption Analysis 2025 & 2033
- Figure 17: South America Agrochemical Industry in South Africa Revenue Share (%), by Consumption Analysis 2025 & 2033
- Figure 18: South America Agrochemical Industry in South Africa Revenue (Million), by Import Market Analysis (Value & Volume) 2025 & 2033
- Figure 19: South America Agrochemical Industry in South Africa Revenue Share (%), by Import Market Analysis (Value & Volume) 2025 & 2033
- Figure 20: South America Agrochemical Industry in South Africa Revenue (Million), by Export Market Analysis (Value & Volume) 2025 & 2033
- Figure 21: South America Agrochemical Industry in South Africa Revenue Share (%), by Export Market Analysis (Value & Volume) 2025 & 2033
- Figure 22: South America Agrochemical Industry in South Africa Revenue (Million), by Price Trend Analysis 2025 & 2033
- Figure 23: South America Agrochemical Industry in South Africa Revenue Share (%), by Price Trend Analysis 2025 & 2033
- Figure 24: South America Agrochemical Industry in South Africa Revenue (Million), by Country 2025 & 2033
- Figure 25: South America Agrochemical Industry in South Africa Revenue Share (%), by Country 2025 & 2033
- Figure 26: Europe Agrochemical Industry in South Africa Revenue (Million), by Production Analysis 2025 & 2033
- Figure 27: Europe Agrochemical Industry in South Africa Revenue Share (%), by Production Analysis 2025 & 2033
- Figure 28: Europe Agrochemical Industry in South Africa Revenue (Million), by Consumption Analysis 2025 & 2033
- Figure 29: Europe Agrochemical Industry in South Africa Revenue Share (%), by Consumption Analysis 2025 & 2033
- Figure 30: Europe Agrochemical Industry in South Africa Revenue (Million), by Import Market Analysis (Value & Volume) 2025 & 2033
- Figure 31: Europe Agrochemical Industry in South Africa Revenue Share (%), by Import Market Analysis (Value & Volume) 2025 & 2033
- Figure 32: Europe Agrochemical Industry in South Africa Revenue (Million), by Export Market Analysis (Value & Volume) 2025 & 2033
- Figure 33: Europe Agrochemical Industry in South Africa Revenue Share (%), by Export Market Analysis (Value & Volume) 2025 & 2033
- Figure 34: Europe Agrochemical Industry in South Africa Revenue (Million), by Price Trend Analysis 2025 & 2033
- Figure 35: Europe Agrochemical Industry in South Africa Revenue Share (%), by Price Trend Analysis 2025 & 2033
- Figure 36: Europe Agrochemical Industry in South Africa Revenue (Million), by Country 2025 & 2033
- Figure 37: Europe Agrochemical Industry in South Africa Revenue Share (%), by Country 2025 & 2033
- Figure 38: Middle East & Africa Agrochemical Industry in South Africa Revenue (Million), by Production Analysis 2025 & 2033
- Figure 39: Middle East & Africa Agrochemical Industry in South Africa Revenue Share (%), by Production Analysis 2025 & 2033
- Figure 40: Middle East & Africa Agrochemical Industry in South Africa Revenue (Million), by Consumption Analysis 2025 & 2033
- Figure 41: Middle East & Africa Agrochemical Industry in South Africa Revenue Share (%), by Consumption Analysis 2025 & 2033
- Figure 42: Middle East & Africa Agrochemical Industry in South Africa Revenue (Million), by Import Market Analysis (Value & Volume) 2025 & 2033
- Figure 43: Middle East & Africa Agrochemical Industry in South Africa Revenue Share (%), by Import Market Analysis (Value & Volume) 2025 & 2033
- Figure 44: Middle East & Africa Agrochemical Industry in South Africa Revenue (Million), by Export Market Analysis (Value & Volume) 2025 & 2033
- Figure 45: Middle East & Africa Agrochemical Industry in South Africa Revenue Share (%), by Export Market Analysis (Value & Volume) 2025 & 2033
- Figure 46: Middle East & Africa Agrochemical Industry in South Africa Revenue (Million), by Price Trend Analysis 2025 & 2033
- Figure 47: Middle East & Africa Agrochemical Industry in South Africa Revenue Share (%), by Price Trend Analysis 2025 & 2033
- Figure 48: Middle East & Africa Agrochemical Industry in South Africa Revenue (Million), by Country 2025 & 2033
- Figure 49: Middle East & Africa Agrochemical Industry in South Africa Revenue Share (%), by Country 2025 & 2033
- Figure 50: Asia Pacific Agrochemical Industry in South Africa Revenue (Million), by Production Analysis 2025 & 2033
- Figure 51: Asia Pacific Agrochemical Industry in South Africa Revenue Share (%), by Production Analysis 2025 & 2033
- Figure 52: Asia Pacific Agrochemical Industry in South Africa Revenue (Million), by Consumption Analysis 2025 & 2033
- Figure 53: Asia Pacific Agrochemical Industry in South Africa Revenue Share (%), by Consumption Analysis 2025 & 2033
- Figure 54: Asia Pacific Agrochemical Industry in South Africa Revenue (Million), by Import Market Analysis (Value & Volume) 2025 & 2033
- Figure 55: Asia Pacific Agrochemical Industry in South Africa Revenue Share (%), by Import Market Analysis (Value & Volume) 2025 & 2033
- Figure 56: Asia Pacific Agrochemical Industry in South Africa Revenue (Million), by Export Market Analysis (Value & Volume) 2025 & 2033
- Figure 57: Asia Pacific Agrochemical Industry in South Africa Revenue Share (%), by Export Market Analysis (Value & Volume) 2025 & 2033
- Figure 58: Asia Pacific Agrochemical Industry in South Africa Revenue (Million), by Price Trend Analysis 2025 & 2033
- Figure 59: Asia Pacific Agrochemical Industry in South Africa Revenue Share (%), by Price Trend Analysis 2025 & 2033
- Figure 60: Asia Pacific Agrochemical Industry in South Africa Revenue (Million), by Country 2025 & 2033
- Figure 61: Asia Pacific Agrochemical Industry in South Africa Revenue Share (%), by Country 2025 & 2033
List of Tables
- Table 1: Global Agrochemical Industry in South Africa Revenue Million Forecast, by Production Analysis 2020 & 2033
- Table 2: Global Agrochemical Industry in South Africa Revenue Million Forecast, by Consumption Analysis 2020 & 2033
- Table 3: Global Agrochemical Industry in South Africa Revenue Million Forecast, by Import Market Analysis (Value & Volume) 2020 & 2033
- Table 4: Global Agrochemical Industry in South Africa Revenue Million Forecast, by Export Market Analysis (Value & Volume) 2020 & 2033
- Table 5: Global Agrochemical Industry in South Africa Revenue Million Forecast, by Price Trend Analysis 2020 & 2033
- Table 6: Global Agrochemical Industry in South Africa Revenue Million Forecast, by Region 2020 & 2033
- Table 7: Global Agrochemical Industry in South Africa Revenue Million Forecast, by Production Analysis 2020 & 2033
- Table 8: Global Agrochemical Industry in South Africa Revenue Million Forecast, by Consumption Analysis 2020 & 2033
- Table 9: Global Agrochemical Industry in South Africa Revenue Million Forecast, by Import Market Analysis (Value & Volume) 2020 & 2033
- Table 10: Global Agrochemical Industry in South Africa Revenue Million Forecast, by Export Market Analysis (Value & Volume) 2020 & 2033
- Table 11: Global Agrochemical Industry in South Africa Revenue Million Forecast, by Price Trend Analysis 2020 & 2033
- Table 12: Global Agrochemical Industry in South Africa Revenue Million Forecast, by Country 2020 & 2033
- Table 13: United States Agrochemical Industry in South Africa Revenue (Million) Forecast, by Application 2020 & 2033
- Table 14: Canada Agrochemical Industry in South Africa Revenue (Million) Forecast, by Application 2020 & 2033
- Table 15: Mexico Agrochemical Industry in South Africa Revenue (Million) Forecast, by Application 2020 & 2033
- Table 16: Global Agrochemical Industry in South Africa Revenue Million Forecast, by Production Analysis 2020 & 2033
- Table 17: Global Agrochemical Industry in South Africa Revenue Million Forecast, by Consumption Analysis 2020 & 2033
- Table 18: Global Agrochemical Industry in South Africa Revenue Million Forecast, by Import Market Analysis (Value & Volume) 2020 & 2033
- Table 19: Global Agrochemical Industry in South Africa Revenue Million Forecast, by Export Market Analysis (Value & Volume) 2020 & 2033
- Table 20: Global Agrochemical Industry in South Africa Revenue Million Forecast, by Price Trend Analysis 2020 & 2033
- Table 21: Global Agrochemical Industry in South Africa Revenue Million Forecast, by Country 2020 & 2033
- Table 22: Brazil Agrochemical Industry in South Africa Revenue (Million) Forecast, by Application 2020 & 2033
- Table 23: Argentina Agrochemical Industry in South Africa Revenue (Million) Forecast, by Application 2020 & 2033
- Table 24: Rest of South America Agrochemical Industry in South Africa Revenue (Million) Forecast, by Application 2020 & 2033
- Table 25: Global Agrochemical Industry in South Africa Revenue Million Forecast, by Production Analysis 2020 & 2033
- Table 26: Global Agrochemical Industry in South Africa Revenue Million Forecast, by Consumption Analysis 2020 & 2033
- Table 27: Global Agrochemical Industry in South Africa Revenue Million Forecast, by Import Market Analysis (Value & Volume) 2020 & 2033
- Table 28: Global Agrochemical Industry in South Africa Revenue Million Forecast, by Export Market Analysis (Value & Volume) 2020 & 2033
- Table 29: Global Agrochemical Industry in South Africa Revenue Million Forecast, by Price Trend Analysis 2020 & 2033
- Table 30: Global Agrochemical Industry in South Africa Revenue Million Forecast, by Country 2020 & 2033
- Table 31: United Kingdom Agrochemical Industry in South Africa Revenue (Million) Forecast, by Application 2020 & 2033
- Table 32: Germany Agrochemical Industry in South Africa Revenue (Million) Forecast, by Application 2020 & 2033
- Table 33: France Agrochemical Industry in South Africa Revenue (Million) Forecast, by Application 2020 & 2033
- Table 34: Italy Agrochemical Industry in South Africa Revenue (Million) Forecast, by Application 2020 & 2033
- Table 35: Spain Agrochemical Industry in South Africa Revenue (Million) Forecast, by Application 2020 & 2033
- Table 36: Russia Agrochemical Industry in South Africa Revenue (Million) Forecast, by Application 2020 & 2033
- Table 37: Benelux Agrochemical Industry in South Africa Revenue (Million) Forecast, by Application 2020 & 2033
- Table 38: Nordics Agrochemical Industry in South Africa Revenue (Million) Forecast, by Application 2020 & 2033
- Table 39: Rest of Europe Agrochemical Industry in South Africa Revenue (Million) Forecast, by Application 2020 & 2033
- Table 40: Global Agrochemical Industry in South Africa Revenue Million Forecast, by Production Analysis 2020 & 2033
- Table 41: Global Agrochemical Industry in South Africa Revenue Million Forecast, by Consumption Analysis 2020 & 2033
- Table 42: Global Agrochemical Industry in South Africa Revenue Million Forecast, by Import Market Analysis (Value & Volume) 2020 & 2033
- Table 43: Global Agrochemical Industry in South Africa Revenue Million Forecast, by Export Market Analysis (Value & Volume) 2020 & 2033
- Table 44: Global Agrochemical Industry in South Africa Revenue Million Forecast, by Price Trend Analysis 2020 & 2033
- Table 45: Global Agrochemical Industry in South Africa Revenue Million Forecast, by Country 2020 & 2033
- Table 46: Turkey Agrochemical Industry in South Africa Revenue (Million) Forecast, by Application 2020 & 2033
- Table 47: Israel Agrochemical Industry in South Africa Revenue (Million) Forecast, by Application 2020 & 2033
- Table 48: GCC Agrochemical Industry in South Africa Revenue (Million) Forecast, by Application 2020 & 2033
- Table 49: North Africa Agrochemical Industry in South Africa Revenue (Million) Forecast, by Application 2020 & 2033
- Table 50: South Africa Agrochemical Industry in South Africa Revenue (Million) Forecast, by Application 2020 & 2033
- Table 51: Rest of Middle East & Africa Agrochemical Industry in South Africa Revenue (Million) Forecast, by Application 2020 & 2033
- Table 52: Global Agrochemical Industry in South Africa Revenue Million Forecast, by Production Analysis 2020 & 2033
- Table 53: Global Agrochemical Industry in South Africa Revenue Million Forecast, by Consumption Analysis 2020 & 2033
- Table 54: Global Agrochemical Industry in South Africa Revenue Million Forecast, by Import Market Analysis (Value & Volume) 2020 & 2033
- Table 55: Global Agrochemical Industry in South Africa Revenue Million Forecast, by Export Market Analysis (Value & Volume) 2020 & 2033
- Table 56: Global Agrochemical Industry in South Africa Revenue Million Forecast, by Price Trend Analysis 2020 & 2033
- Table 57: Global Agrochemical Industry in South Africa Revenue Million Forecast, by Country 2020 & 2033
- Table 58: China Agrochemical Industry in South Africa Revenue (Million) Forecast, by Application 2020 & 2033
- Table 59: India Agrochemical Industry in South Africa Revenue (Million) Forecast, by Application 2020 & 2033
- Table 60: Japan Agrochemical Industry in South Africa Revenue (Million) Forecast, by Application 2020 & 2033
- Table 61: South Korea Agrochemical Industry in South Africa Revenue (Million) Forecast, by Application 2020 & 2033
- Table 62: ASEAN Agrochemical Industry in South Africa Revenue (Million) Forecast, by Application 2020 & 2033
- Table 63: Oceania Agrochemical Industry in South Africa Revenue (Million) Forecast, by Application 2020 & 2033
- Table 64: Rest of Asia Pacific Agrochemical Industry in South Africa Revenue (Million) Forecast, by Application 2020 & 2033
Frequently Asked Questions
1. What is the projected Compound Annual Growth Rate (CAGR) of the Agrochemical Industry in South Africa?
The projected CAGR is approximately 3.90%.
2. Which companies are prominent players in the Agrochemical Industry in South Africa?
Key companies in the market include Archer-Daniels-Midland (ADM), Cargill Incorporated, Sumitomo Chemical (Philagro SA), Nufarm, ICL Group Ltd, UPL Limited, BASF SE, FMC Corporation, Sociedad Química y Minera de Chile (SQM), Belaruskali, Sasol Limited, K+S AG, ADAMA Ltd, Uralkal, CF Industries Holdings, OCP Group, Land O' Lakes (Villa Crop Protection (Pty) Ltd, Yara International ASA, Syngenta AG, Nutrien Ltd, Corteva Agriscience, Bayer CropScience AG.
3. What are the main segments of the Agrochemical Industry in South Africa?
The market segments include Production Analysis, Consumption Analysis, Import Market Analysis (Value & Volume), Export Market Analysis (Value & Volume), Price Trend Analysis.
4. Can you provide details about the market size?
The market size is estimated to be USD 1.27 Million as of 2022.
5. What are some drivers contributing to market growth?
Adoption of Organic and Eco-friendly Farming Practices; Declining Area of Arable Land and Rising Food Security Concerns.
6. What are the notable trends driving market growth?
Increasing Adoption of Bio-based Agrochemicals.
7. Are there any restraints impacting market growth?
High Demand for Conventional and Synthetic Products; Lack of Awareness and Other Factors Limiting the Adoption of Agricultural Inoculants.
8. Can you provide examples of recent developments in the market?
N/A
9. What pricing options are available for accessing the report?
Pricing options include single-user, multi-user, and enterprise licenses priced at USD 3800, USD 4500, and USD 5800 respectively.
10. Is the market size provided in terms of value or volume?
The market size is provided in terms of value, measured in Million.
11. Are there any specific market keywords associated with the report?
Yes, the market keyword associated with the report is "Agrochemical Industry in South Africa," which aids in identifying and referencing the specific market segment covered.
12. How do I determine which pricing option suits my needs best?
The pricing options vary based on user requirements and access needs. Individual users may opt for single-user licenses, while businesses requiring broader access may choose multi-user or enterprise licenses for cost-effective access to the report.
13. Are there any additional resources or data provided in the Agrochemical Industry in South Africa report?
While the report offers comprehensive insights, it's advisable to review the specific contents or supplementary materials provided to ascertain if additional resources or data are available.
14. How can I stay updated on further developments or reports in the Agrochemical Industry in South Africa?
To stay informed about further developments, trends, and reports in the Agrochemical Industry in South Africa, consider subscribing to industry newsletters, following relevant companies and organizations, or regularly checking reputable industry news sources and publications.
Methodology
Step 1 - Identification of Relevant Samples Size from Population Database


Step 2 - Approaches for Defining Global Market Size (Value, Volume* & Price*)

Note*: In applicable scenarios
Step 3 - Data Sources
Primary Research
- Web Analytics
- Survey Reports
- Research Institute
- Latest Research Reports
- Opinion Leaders
Secondary Research
- Annual Reports
- White Paper
- Latest Press Release
- Industry Association
- Paid Database
- Investor Presentations

Step 4 - Data Triangulation
Involves using different sources of information in order to increase the validity of a study
These sources are likely to be stakeholders in a program - participants, other researchers, program staff, other community members, and so on.
Then we put all data in single framework & apply various statistical tools to find out the dynamic on the market.
During the analysis stage, feedback from the stakeholder groups would be compared to determine areas of agreement as well as areas of divergence