

Key Insights
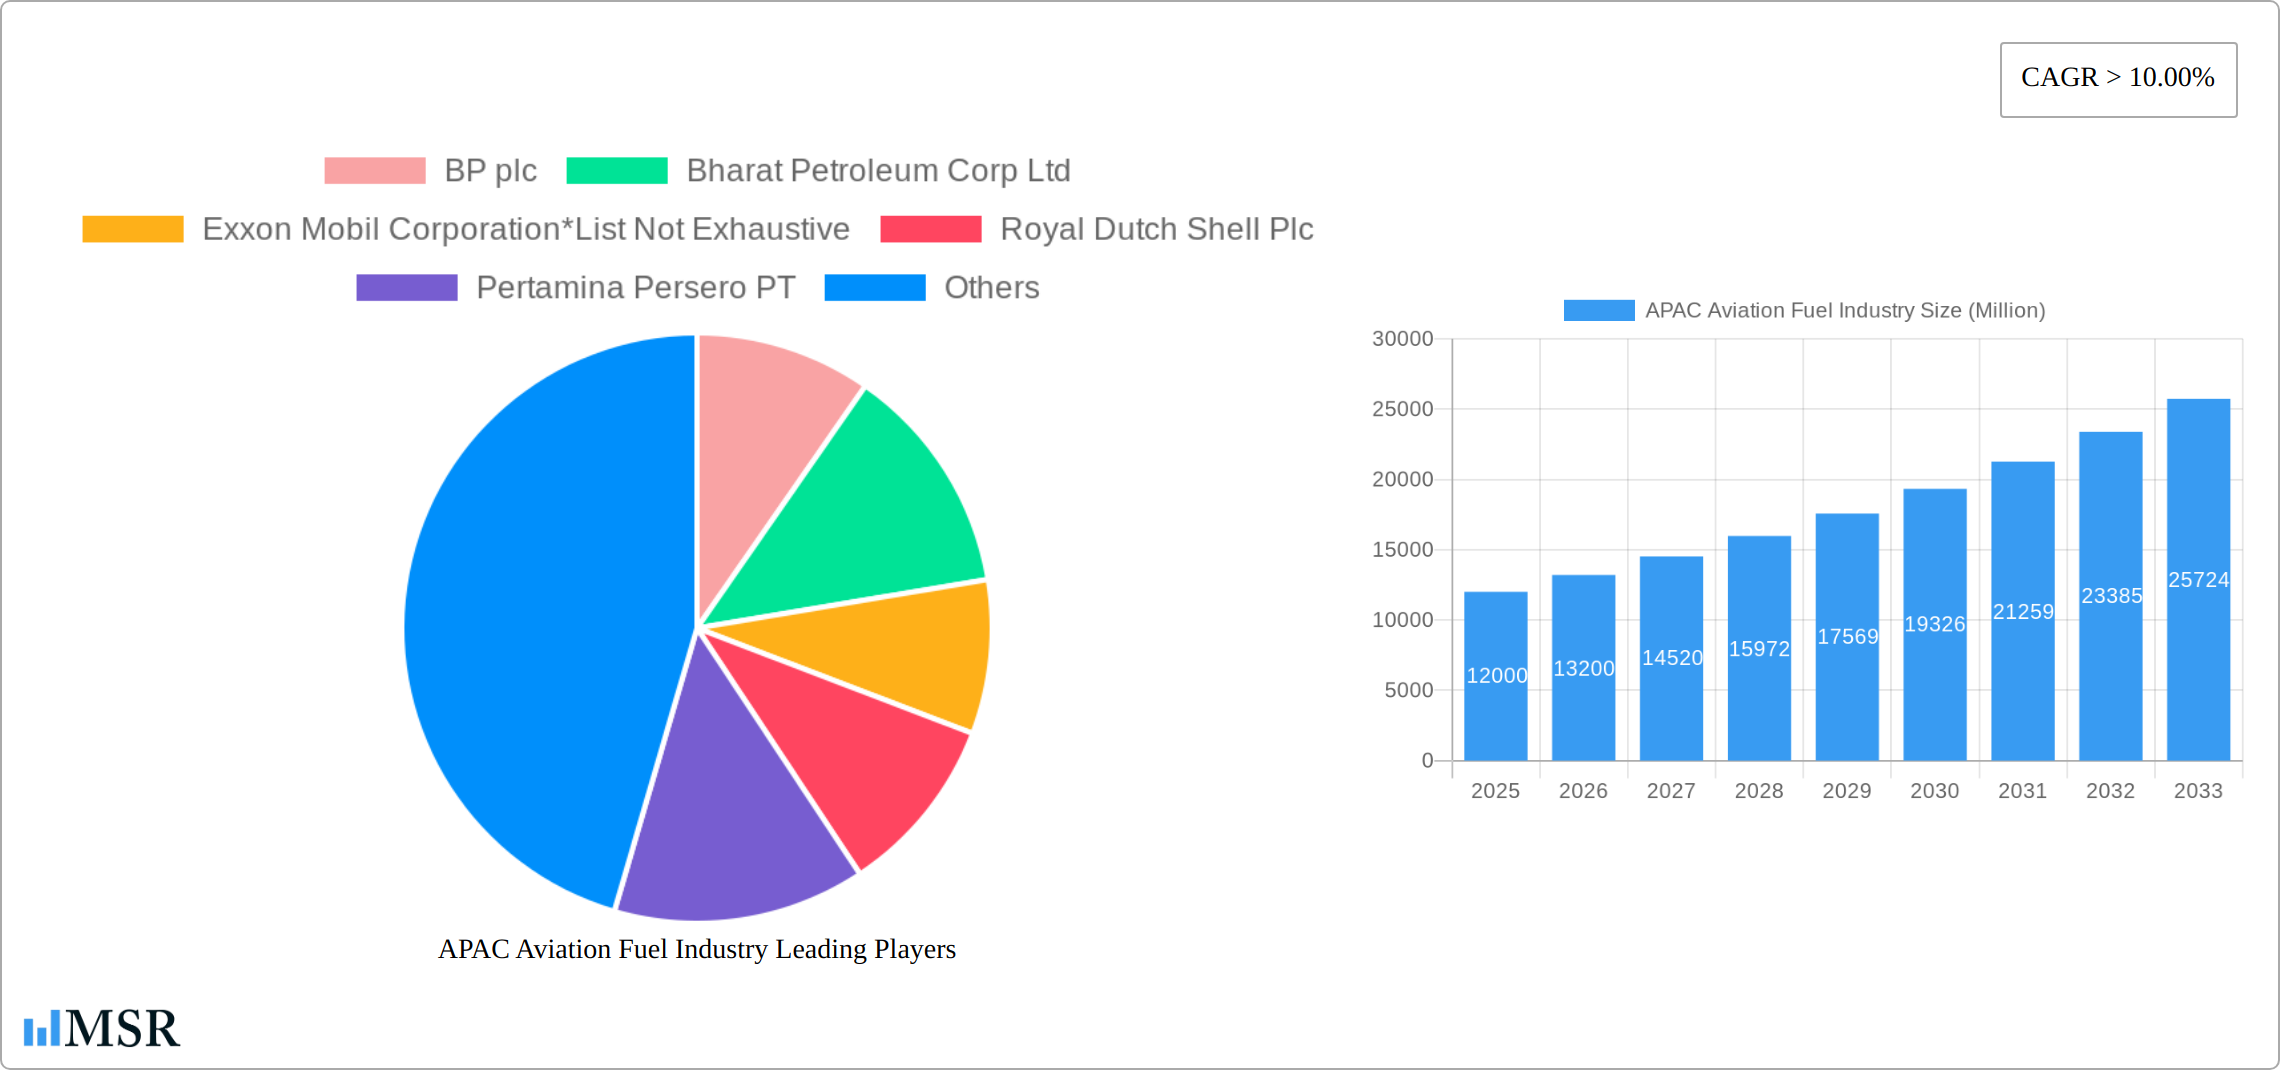
The Asia-Pacific (APAC) aviation fuel market is experiencing robust growth, driven by the region's burgeoning air travel sector and expanding economies. A compound annual growth rate (CAGR) exceeding 10% suggests a significant market expansion from 2025 to 2033. Key drivers include increasing disposable incomes fueling leisure travel, the rise of low-cost carriers expanding air connectivity within and beyond APAC, and the growth of e-commerce and related air freight. While the transition to sustainable aviation fuel (SAF) is still nascent, it presents a significant long-term opportunity. China, India, Japan, and Southeast Asia are major contributors to this growth, fueled by their expanding middle classes and increasing international trade. However, challenges exist, including fluctuating crude oil prices which directly impact fuel costs, government regulations regarding emissions, and potential disruptions from geopolitical events. The market segmentation reveals a strong dominance of ATF (Air Turbine Fuel) currently, but the increasing adoption of aviation biofuel is anticipated to capture a growing share in the coming years. This shift towards biofuels will be heavily influenced by government policies promoting sustainability and reducing carbon emissions within the aviation sector. The competitive landscape is intense, with both international majors like BP and Shell, and regional players like Petronas and China Aviation Oil Corporation vying for market share, leading to price competition and innovation in fuel supply and logistics.
The forecast for APAC’s aviation fuel market anticipates continued strong growth throughout the forecast period (2025-2033). The expansion of airport infrastructure, particularly in rapidly developing Southeast Asian nations, will provide further impetus to market growth. However, the industry must grapple with the inherent volatility of crude oil prices, and strategize to mitigate the risks associated with supply chain disruptions. The successful integration of SAF into the industry's supply chain will be crucial for sustainable long-term growth, necessitating significant investment in biofuel production and distribution infrastructure. This investment will be a key factor in determining the sector's ability to meet the growing demand while minimizing its environmental impact. Increased collaboration between governments, aviation companies, and fuel suppliers will be essential to navigate these challenges and ensure the sustainable development of the APAC aviation fuel market.
APAC Aviation Fuel Industry: A Comprehensive Market Report (2019-2033)
This in-depth report provides a comprehensive analysis of the Asia-Pacific (APAC) aviation fuel industry, covering market dynamics, key segments, leading players, and future growth prospects. The study period spans from 2019 to 2033, with a focus on the estimated year 2025 and a forecast period of 2025-2033. This report is essential for industry stakeholders, investors, and strategic decision-makers seeking actionable insights into this dynamic market. The report uses Millions (M) for all values.
APAC Aviation Fuel Industry Market Concentration & Dynamics
The APAC aviation fuel market exhibits a moderately concentrated landscape, dominated by multinational energy giants like BP plc, Exxon Mobil Corporation, Royal Dutch Shell Plc, and Chevron Corporation, alongside significant regional players such as Bharat Petroleum Corp Ltd, Pertamina Persero PT, Petronas Aviation Sdn Bhd, and China Aviation Oil Corporation Ltd. These companies collectively hold approximately xx% of the market share in 2025. The market is characterized by intense competition, driven by pricing strategies, supply chain efficiency, and strategic partnerships.
Market concentration is further influenced by:
- Innovation Ecosystems: Significant investments in research and development focused on sustainable aviation fuels (SAFs) and technological advancements in fuel storage and distribution.
- Regulatory Frameworks: Government policies related to emissions reduction, fuel quality standards, and airport infrastructure development significantly impact market dynamics.
- Substitute Products: The emergence of alternative fuels like biofuels and hydrogen presents both opportunities and challenges for traditional ATF suppliers.
- End-User Trends: The growth of low-cost carriers (LCCs) and the increasing demand for air travel, particularly in rapidly developing economies, are key drivers.
- M&A Activities: The past five years have witnessed xx M&A deals in the APAC aviation fuel sector, with a focus on expanding market reach and securing supply chains. These transactions have primarily involved smaller players being acquired by larger corporations.
APAC Aviation Fuel Industry Industry Insights & Trends
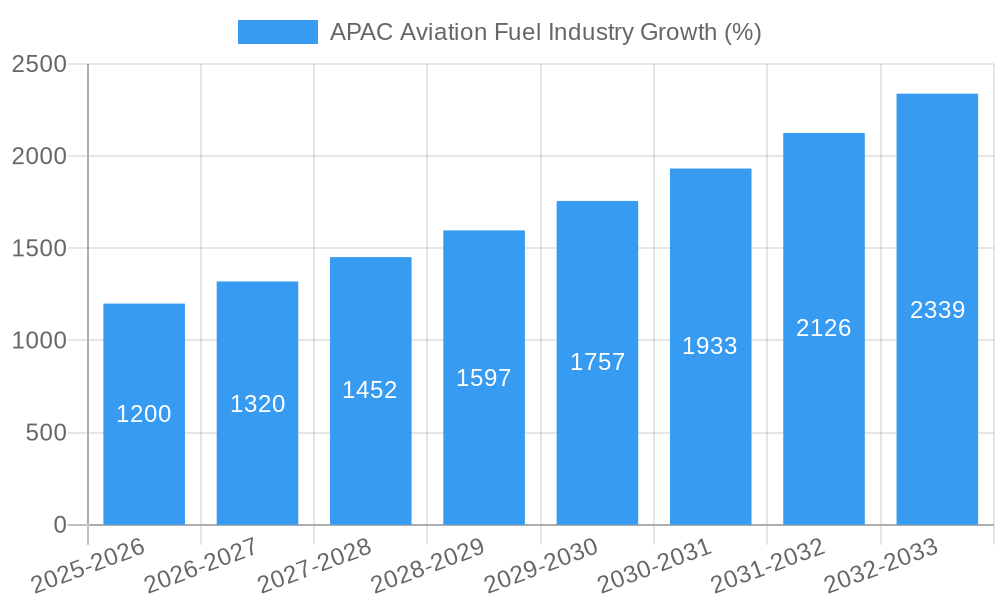
The APAC aviation fuel market is projected to experience substantial growth, with a Compound Annual Growth Rate (CAGR) of xx% during the forecast period (2025-2033). The market size is estimated at $xx Million in 2025 and is expected to reach $xx Million by 2033. This growth is primarily fueled by the burgeoning air passenger traffic within the region, driven by economic expansion, rising disposable incomes, and increasing tourism.
Several key trends are shaping the industry:
- Technological Disruptions: The adoption of advanced technologies in fuel logistics, blending, and distribution is enhancing operational efficiency and reducing environmental impact.
- Evolving Consumer Behaviors: Growing awareness of environmental concerns is driving demand for sustainable aviation fuels, placing pressure on industry players to reduce carbon emissions.
- Market Growth Drivers: The rapid growth of air travel, particularly in Southeast Asia and India, is the most significant driver. Supporting factors include increased investments in airport infrastructure and government initiatives promoting air connectivity.
Key Markets & Segments Leading APAP Aviation Fuel Industry
Within APAC, China and India are the leading markets for aviation fuel, driven by robust economic growth, expanding air travel infrastructure, and the significant presence of major airlines. Southeast Asia is another high-growth region, fueled by increasing tourism and the expansion of LCCs.
Dominant Segments:
- Fuel Type: Air Turbine Fuel (ATF) constitutes the largest segment, holding approximately xx% market share. Aviation biofuel is witnessing significant growth, driven by sustainability initiatives.
- Application: Commercial aviation accounts for the largest share, followed by military aircraft and general aviation.
Key Market Drivers:
- Economic Growth: Rapid economic growth in several APAC countries directly correlates with increased air passenger traffic.
- Infrastructure Development: Investments in new airports, runways, and improved air navigation systems are supporting the industry's expansion.
- Tourism Growth: The burgeoning tourism sector in many APAC nations significantly contributes to the demand for air travel.
APAP Aviation Fuel Industry Product Developments
Recent product innovations focus on enhancing fuel efficiency, reducing emissions, and improving safety. The development and adoption of sustainable aviation fuels (SAFs), including biofuels and synthetic fuels, are gaining significant traction. These advancements offer airlines a pathway to meet environmental regulations and reduce their carbon footprint, offering a substantial competitive edge in the market.
Challenges in the APAC Aviation Fuel Industry Market
The APAC aviation fuel market navigates a complex landscape of challenges impacting its growth trajectory. These include:
- Regulatory Complexity and Harmonization: Inconsistent fuel quality standards across the diverse APAC nations create significant supply chain complexities, increasing operational costs and necessitating meticulous cross-border compliance strategies. This fragmentation hinders efficient fuel sourcing and distribution.
- Supply Chain Volatility and Geopolitical Risks: The region's vulnerability to geopolitical instability and global oil market fluctuations presents significant risks to fuel availability and pricing. Disruptions in crude oil supply, sanctions, or regional conflicts can lead to price spikes and shortages, impacting airlines' operational budgets and profitability.
- Intense Competition and Market Consolidation: The APAC aviation fuel market is characterized by intense competition among established international players and regional distributors. This necessitates a focus on operational efficiency, strategic partnerships, and innovative cost-management strategies for sustained success. The pressure to maintain competitive pricing while ensuring supply security significantly constrains market growth.
- Sustainability Concerns and Environmental Regulations: Growing environmental awareness and increasingly stringent carbon emission regulations are placing pressure on the industry to adopt sustainable practices and reduce its carbon footprint. This necessitates significant investment in sustainable aviation fuels (SAFs) and the development of greener aviation technologies.
Forces Driving APAC Aviation Fuel Industry Growth
Despite the challenges, several powerful factors are driving substantial growth within the APAC aviation fuel industry:
- Technological Advancements in Sustainable Aviation Fuels (SAFs): The burgeoning development and adoption of SAFs, including biofuels and synthetic fuels, offer a pathway towards reducing the industry's environmental impact while enhancing fuel efficiency. Investments in SAF research, production, and infrastructure are pivotal for future growth.
- Robust Economic Expansion and Rising Air Travel Demand: The sustained economic growth across many APAC nations fuels a corresponding surge in air passenger and cargo traffic. This increased demand directly translates to higher aviation fuel consumption and market expansion.
- Government Support and Infrastructure Development: Government initiatives focusing on airport modernization, expansion of air travel infrastructure, and supportive aviation policies are crucial for industry expansion. Significant investments in airport infrastructure projects across key markets like India and China exemplify this trend.
- Growth of Low-Cost Carriers (LCCs): The increasing popularity of budget airlines expands the overall air travel market, thereby boosting demand for aviation fuel, though potentially at a lower margin for fuel suppliers.
Long-Term Growth Catalysts in APAC Aviation Fuel Industry
Long-term growth in the APAC aviation fuel market will be driven by continued technological advancements, particularly in sustainable aviation fuels (SAFs) and fuel-efficient aircraft. Strategic partnerships between fuel suppliers, airlines, and technology providers will play a crucial role in fostering innovation and expanding market access. Further regional infrastructure development will also support market expansion.
Emerging Opportunities in APAC Aviation Fuel Industry
Emerging opportunities exist in the development and deployment of SAFs, the expansion into underserved markets within the APAC region, and the adoption of advanced technologies to optimize fuel supply chains. The growing demand for sustainable aviation fuels presents a significant opportunity for companies that can invest in research and development and build a strong supply chain.
Leading Players in the APAC Aviation Fuel Industry Sector
- BP plc
- Bharat Petroleum Corp Ltd
- Exxon Mobil Corporation
- Royal Dutch Shell Plc
- Pertamina Persero PT
- Chevron Corporation
- World Fuel Services Corp
- Petronas Aviation Sdn Bhd
- China Aviation Oil Corporation Ltd
- Vitol Holding BV
Key Milestones in APAC Aviation Fuel Industry Industry
- 2020: Several airlines announced commitments to use SAFs, signaling a shift towards sustainable aviation.
- 2021: Major oil companies invested heavily in SAF production facilities.
- 2022: Several new airport infrastructure projects were launched across the region.
- 2023: New regulations were introduced in several countries to promote the use of SAFs. (Specific details of regulations omitted as this is a report summary and exact details would be in the full report).
Strategic Outlook for APAC Aviation Fuel Industry Market
The APAC aviation fuel market holds significant potential for future growth, driven by a combination of factors, including the continued expansion of air travel, increasing investments in airport infrastructure, and the growing adoption of sustainable aviation fuels. Strategic opportunities exist for companies that can innovate, adapt to evolving regulations, and establish efficient and reliable supply chains. The market’s future growth will be considerably influenced by technological advancements, governmental policies, and economic factors.
APAC Aviation Fuel Industry Segmentation
-
1. Fuel Type
- 1.1. Air Turbine Fuel (ATF)
- 1.2. Aviation Biofuel
- 1.3. Others
-
2. Application
- 2.1. Commercial Aircraft
- 2.2. Military Aircraft
- 2.3. General Aviation
-
3. Geography
- 3.1. China
- 3.2. Japan
- 3.3. India
- 3.4. Indonesia
- 3.5. Australia
- 3.6. Rest of Asia-Pacific
APAC Aviation Fuel Industry Segmentation By Geography
- 1. China
- 2. Japan
- 3. India
- 4. Indonesia
- 5. Australia
- 6. Rest of Asia Pacific
APAC Aviation Fuel Industry REPORT HIGHLIGHTS
| Aspects | Details |
|---|---|
| Study Period | 2019-2033 |
| Base Year | 2024 |
| Estimated Year | 2025 |
| Forecast Period | 2025-2033 |
| Historical Period | 2019-2024 |
| Growth Rate | CAGR of > 10.00% from 2019-2033 |
| Segmentation |
|
Table of Contents
- 1. Introduction
- 1.1. Research Scope
- 1.2. Market Segmentation
- 1.3. Research Methodology
- 1.4. Definitions and Assumptions
- 2. Executive Summary
- 2.1. Introduction
- 3. Market Dynamics
- 3.1. Introduction
- 3.2. Market Drivers
- 3.2.1. 4.; Increase in Prices of Electricity Procured from Conventional Mechanisms 4.; Decline in Cost of Solar Energy Infrastructure
- 3.3. Market Restrains
- 3.3.1. 4.; Competition from Other Alternative Energy Sources
- 3.4. Market Trends
- 3.4.1. Commercial Aircraft Segment to Dominate the Market
- 4. Market Factor Analysis
- 4.1. Porters Five Forces
- 4.2. Supply/Value Chain
- 4.3. PESTEL analysis
- 4.4. Market Entropy
- 4.5. Patent/Trademark Analysis
- 5. Global APAC Aviation Fuel Industry Analysis, Insights and Forecast, 2019-2031
- 5.1. Market Analysis, Insights and Forecast - by Fuel Type
- 5.1.1. Air Turbine Fuel (ATF)
- 5.1.2. Aviation Biofuel
- 5.1.3. Others
- 5.2. Market Analysis, Insights and Forecast - by Application
- 5.2.1. Commercial Aircraft
- 5.2.2. Military Aircraft
- 5.2.3. General Aviation
- 5.3. Market Analysis, Insights and Forecast - by Geography
- 5.3.1. China
- 5.3.2. Japan
- 5.3.3. India
- 5.3.4. Indonesia
- 5.3.5. Australia
- 5.3.6. Rest of Asia-Pacific
- 5.4. Market Analysis, Insights and Forecast - by Region
- 5.4.1. China
- 5.4.2. Japan
- 5.4.3. India
- 5.4.4. Indonesia
- 5.4.5. Australia
- 5.4.6. Rest of Asia Pacific
- 5.1. Market Analysis, Insights and Forecast - by Fuel Type
- 6. China APAC Aviation Fuel Industry Analysis, Insights and Forecast, 2019-2031
- 6.1. Market Analysis, Insights and Forecast - by Fuel Type
- 6.1.1. Air Turbine Fuel (ATF)
- 6.1.2. Aviation Biofuel
- 6.1.3. Others
- 6.2. Market Analysis, Insights and Forecast - by Application
- 6.2.1. Commercial Aircraft
- 6.2.2. Military Aircraft
- 6.2.3. General Aviation
- 6.3. Market Analysis, Insights and Forecast - by Geography
- 6.3.1. China
- 6.3.2. Japan
- 6.3.3. India
- 6.3.4. Indonesia
- 6.3.5. Australia
- 6.3.6. Rest of Asia-Pacific
- 6.1. Market Analysis, Insights and Forecast - by Fuel Type
- 7. Japan APAC Aviation Fuel Industry Analysis, Insights and Forecast, 2019-2031
- 7.1. Market Analysis, Insights and Forecast - by Fuel Type
- 7.1.1. Air Turbine Fuel (ATF)
- 7.1.2. Aviation Biofuel
- 7.1.3. Others
- 7.2. Market Analysis, Insights and Forecast - by Application
- 7.2.1. Commercial Aircraft
- 7.2.2. Military Aircraft
- 7.2.3. General Aviation
- 7.3. Market Analysis, Insights and Forecast - by Geography
- 7.3.1. China
- 7.3.2. Japan
- 7.3.3. India
- 7.3.4. Indonesia
- 7.3.5. Australia
- 7.3.6. Rest of Asia-Pacific
- 7.1. Market Analysis, Insights and Forecast - by Fuel Type
- 8. India APAC Aviation Fuel Industry Analysis, Insights and Forecast, 2019-2031
- 8.1. Market Analysis, Insights and Forecast - by Fuel Type
- 8.1.1. Air Turbine Fuel (ATF)
- 8.1.2. Aviation Biofuel
- 8.1.3. Others
- 8.2. Market Analysis, Insights and Forecast - by Application
- 8.2.1. Commercial Aircraft
- 8.2.2. Military Aircraft
- 8.2.3. General Aviation
- 8.3. Market Analysis, Insights and Forecast - by Geography
- 8.3.1. China
- 8.3.2. Japan
- 8.3.3. India
- 8.3.4. Indonesia
- 8.3.5. Australia
- 8.3.6. Rest of Asia-Pacific
- 8.1. Market Analysis, Insights and Forecast - by Fuel Type
- 9. Indonesia APAC Aviation Fuel Industry Analysis, Insights and Forecast, 2019-2031
- 9.1. Market Analysis, Insights and Forecast - by Fuel Type
- 9.1.1. Air Turbine Fuel (ATF)
- 9.1.2. Aviation Biofuel
- 9.1.3. Others
- 9.2. Market Analysis, Insights and Forecast - by Application
- 9.2.1. Commercial Aircraft
- 9.2.2. Military Aircraft
- 9.2.3. General Aviation
- 9.3. Market Analysis, Insights and Forecast - by Geography
- 9.3.1. China
- 9.3.2. Japan
- 9.3.3. India
- 9.3.4. Indonesia
- 9.3.5. Australia
- 9.3.6. Rest of Asia-Pacific
- 9.1. Market Analysis, Insights and Forecast - by Fuel Type
- 10. Australia APAC Aviation Fuel Industry Analysis, Insights and Forecast, 2019-2031
- 10.1. Market Analysis, Insights and Forecast - by Fuel Type
- 10.1.1. Air Turbine Fuel (ATF)
- 10.1.2. Aviation Biofuel
- 10.1.3. Others
- 10.2. Market Analysis, Insights and Forecast - by Application
- 10.2.1. Commercial Aircraft
- 10.2.2. Military Aircraft
- 10.2.3. General Aviation
- 10.3. Market Analysis, Insights and Forecast - by Geography
- 10.3.1. China
- 10.3.2. Japan
- 10.3.3. India
- 10.3.4. Indonesia
- 10.3.5. Australia
- 10.3.6. Rest of Asia-Pacific
- 10.1. Market Analysis, Insights and Forecast - by Fuel Type
- 11. Rest of Asia Pacific APAC Aviation Fuel Industry Analysis, Insights and Forecast, 2019-2031
- 11.1. Market Analysis, Insights and Forecast - by Fuel Type
- 11.1.1. Air Turbine Fuel (ATF)
- 11.1.2. Aviation Biofuel
- 11.1.3. Others
- 11.2. Market Analysis, Insights and Forecast - by Application
- 11.2.1. Commercial Aircraft
- 11.2.2. Military Aircraft
- 11.2.3. General Aviation
- 11.3. Market Analysis, Insights and Forecast - by Geography
- 11.3.1. China
- 11.3.2. Japan
- 11.3.3. India
- 11.3.4. Indonesia
- 11.3.5. Australia
- 11.3.6. Rest of Asia-Pacific
- 11.1. Market Analysis, Insights and Forecast - by Fuel Type
- 12. North America APAC Aviation Fuel Industry Analysis, Insights and Forecast, 2019-2031
- 12.1. Market Analysis, Insights and Forecast - By Country/Sub-region
- 12.1.1 United States
- 12.1.2 Canada
- 12.1.3 Mexico
- 13. Europe APAC Aviation Fuel Industry Analysis, Insights and Forecast, 2019-2031
- 13.1. Market Analysis, Insights and Forecast - By Country/Sub-region
- 13.1.1 Germany
- 13.1.2 United Kingdom
- 13.1.3 France
- 13.1.4 Spain
- 13.1.5 Italy
- 13.1.6 Spain
- 13.1.7 Belgium
- 13.1.8 Netherland
- 13.1.9 Nordics
- 13.1.10 Rest of Europe
- 14. Asia Pacific APAC Aviation Fuel Industry Analysis, Insights and Forecast, 2019-2031
- 14.1. Market Analysis, Insights and Forecast - By Country/Sub-region
- 14.1.1 China
- 14.1.2 Japan
- 14.1.3 India
- 14.1.4 South Korea
- 14.1.5 Southeast Asia
- 14.1.6 Australia
- 14.1.7 Indonesia
- 14.1.8 Phillipes
- 14.1.9 Singapore
- 14.1.10 Thailandc
- 14.1.11 Rest of Asia Pacific
- 15. South America APAC Aviation Fuel Industry Analysis, Insights and Forecast, 2019-2031
- 15.1. Market Analysis, Insights and Forecast - By Country/Sub-region
- 15.1.1 Brazil
- 15.1.2 Argentina
- 15.1.3 Peru
- 15.1.4 Chile
- 15.1.5 Colombia
- 15.1.6 Ecuador
- 15.1.7 Venezuela
- 15.1.8 Rest of South America
- 16. North America APAC Aviation Fuel Industry Analysis, Insights and Forecast, 2019-2031
- 16.1. Market Analysis, Insights and Forecast - By Country/Sub-region
- 16.1.1 United States
- 16.1.2 Canada
- 16.1.3 Mexico
- 17. MEA APAC Aviation Fuel Industry Analysis, Insights and Forecast, 2019-2031
- 17.1. Market Analysis, Insights and Forecast - By Country/Sub-region
- 17.1.1 United Arab Emirates
- 17.1.2 Saudi Arabia
- 17.1.3 South Africa
- 17.1.4 Rest of Middle East and Africa
- 18. Competitive Analysis
- 18.1. Global Market Share Analysis 2024
- 18.2. Company Profiles
- 18.2.1 BP plc
- 18.2.1.1. Overview
- 18.2.1.2. Products
- 18.2.1.3. SWOT Analysis
- 18.2.1.4. Recent Developments
- 18.2.1.5. Financials (Based on Availability)
- 18.2.2 Bharat Petroleum Corp Ltd
- 18.2.2.1. Overview
- 18.2.2.2. Products
- 18.2.2.3. SWOT Analysis
- 18.2.2.4. Recent Developments
- 18.2.2.5. Financials (Based on Availability)
- 18.2.3 Exxon Mobil Corporation*List Not Exhaustive
- 18.2.3.1. Overview
- 18.2.3.2. Products
- 18.2.3.3. SWOT Analysis
- 18.2.3.4. Recent Developments
- 18.2.3.5. Financials (Based on Availability)
- 18.2.4 Royal Dutch Shell Plc
- 18.2.4.1. Overview
- 18.2.4.2. Products
- 18.2.4.3. SWOT Analysis
- 18.2.4.4. Recent Developments
- 18.2.4.5. Financials (Based on Availability)
- 18.2.5 Pertamina Persero PT
- 18.2.5.1. Overview
- 18.2.5.2. Products
- 18.2.5.3. SWOT Analysis
- 18.2.5.4. Recent Developments
- 18.2.5.5. Financials (Based on Availability)
- 18.2.6 Chevron Corporation
- 18.2.6.1. Overview
- 18.2.6.2. Products
- 18.2.6.3. SWOT Analysis
- 18.2.6.4. Recent Developments
- 18.2.6.5. Financials (Based on Availability)
- 18.2.7 World Fuel Services Corp
- 18.2.7.1. Overview
- 18.2.7.2. Products
- 18.2.7.3. SWOT Analysis
- 18.2.7.4. Recent Developments
- 18.2.7.5. Financials (Based on Availability)
- 18.2.8 Petronas Aviation Sdn Bhd
- 18.2.8.1. Overview
- 18.2.8.2. Products
- 18.2.8.3. SWOT Analysis
- 18.2.8.4. Recent Developments
- 18.2.8.5. Financials (Based on Availability)
- 18.2.9 China Aviation Oil Corporation Ltd
- 18.2.9.1. Overview
- 18.2.9.2. Products
- 18.2.9.3. SWOT Analysis
- 18.2.9.4. Recent Developments
- 18.2.9.5. Financials (Based on Availability)
- 18.2.10 Vitol Holding BV
- 18.2.10.1. Overview
- 18.2.10.2. Products
- 18.2.10.3. SWOT Analysis
- 18.2.10.4. Recent Developments
- 18.2.10.5. Financials (Based on Availability)
- 18.2.1 BP plc
List of Figures
- Figure 1: Global APAC Aviation Fuel Industry Revenue Breakdown (Million, %) by Region 2024 & 2032
- Figure 2: Global APAC Aviation Fuel Industry Volume Breakdown (Litre, %) by Region 2024 & 2032
- Figure 3: North America APAC Aviation Fuel Industry Revenue (Million), by Country 2024 & 2032
- Figure 4: North America APAC Aviation Fuel Industry Volume (Litre), by Country 2024 & 2032
- Figure 5: North America APAC Aviation Fuel Industry Revenue Share (%), by Country 2024 & 2032
- Figure 6: North America APAC Aviation Fuel Industry Volume Share (%), by Country 2024 & 2032
- Figure 7: Europe APAC Aviation Fuel Industry Revenue (Million), by Country 2024 & 2032
- Figure 8: Europe APAC Aviation Fuel Industry Volume (Litre), by Country 2024 & 2032
- Figure 9: Europe APAC Aviation Fuel Industry Revenue Share (%), by Country 2024 & 2032
- Figure 10: Europe APAC Aviation Fuel Industry Volume Share (%), by Country 2024 & 2032
- Figure 11: Asia Pacific APAC Aviation Fuel Industry Revenue (Million), by Country 2024 & 2032
- Figure 12: Asia Pacific APAC Aviation Fuel Industry Volume (Litre), by Country 2024 & 2032
- Figure 13: Asia Pacific APAC Aviation Fuel Industry Revenue Share (%), by Country 2024 & 2032
- Figure 14: Asia Pacific APAC Aviation Fuel Industry Volume Share (%), by Country 2024 & 2032
- Figure 15: South America APAC Aviation Fuel Industry Revenue (Million), by Country 2024 & 2032
- Figure 16: South America APAC Aviation Fuel Industry Volume (Litre), by Country 2024 & 2032
- Figure 17: South America APAC Aviation Fuel Industry Revenue Share (%), by Country 2024 & 2032
- Figure 18: South America APAC Aviation Fuel Industry Volume Share (%), by Country 2024 & 2032
- Figure 19: North America APAC Aviation Fuel Industry Revenue (Million), by Country 2024 & 2032
- Figure 20: North America APAC Aviation Fuel Industry Volume (Litre), by Country 2024 & 2032
- Figure 21: North America APAC Aviation Fuel Industry Revenue Share (%), by Country 2024 & 2032
- Figure 22: North America APAC Aviation Fuel Industry Volume Share (%), by Country 2024 & 2032
- Figure 23: MEA APAC Aviation Fuel Industry Revenue (Million), by Country 2024 & 2032
- Figure 24: MEA APAC Aviation Fuel Industry Volume (Litre), by Country 2024 & 2032
- Figure 25: MEA APAC Aviation Fuel Industry Revenue Share (%), by Country 2024 & 2032
- Figure 26: MEA APAC Aviation Fuel Industry Volume Share (%), by Country 2024 & 2032
- Figure 27: China APAC Aviation Fuel Industry Revenue (Million), by Fuel Type 2024 & 2032
- Figure 28: China APAC Aviation Fuel Industry Volume (Litre), by Fuel Type 2024 & 2032
- Figure 29: China APAC Aviation Fuel Industry Revenue Share (%), by Fuel Type 2024 & 2032
- Figure 30: China APAC Aviation Fuel Industry Volume Share (%), by Fuel Type 2024 & 2032
- Figure 31: China APAC Aviation Fuel Industry Revenue (Million), by Application 2024 & 2032
- Figure 32: China APAC Aviation Fuel Industry Volume (Litre), by Application 2024 & 2032
- Figure 33: China APAC Aviation Fuel Industry Revenue Share (%), by Application 2024 & 2032
- Figure 34: China APAC Aviation Fuel Industry Volume Share (%), by Application 2024 & 2032
- Figure 35: China APAC Aviation Fuel Industry Revenue (Million), by Geography 2024 & 2032
- Figure 36: China APAC Aviation Fuel Industry Volume (Litre), by Geography 2024 & 2032
- Figure 37: China APAC Aviation Fuel Industry Revenue Share (%), by Geography 2024 & 2032
- Figure 38: China APAC Aviation Fuel Industry Volume Share (%), by Geography 2024 & 2032
- Figure 39: China APAC Aviation Fuel Industry Revenue (Million), by Country 2024 & 2032
- Figure 40: China APAC Aviation Fuel Industry Volume (Litre), by Country 2024 & 2032
- Figure 41: China APAC Aviation Fuel Industry Revenue Share (%), by Country 2024 & 2032
- Figure 42: China APAC Aviation Fuel Industry Volume Share (%), by Country 2024 & 2032
- Figure 43: Japan APAC Aviation Fuel Industry Revenue (Million), by Fuel Type 2024 & 2032
- Figure 44: Japan APAC Aviation Fuel Industry Volume (Litre), by Fuel Type 2024 & 2032
- Figure 45: Japan APAC Aviation Fuel Industry Revenue Share (%), by Fuel Type 2024 & 2032
- Figure 46: Japan APAC Aviation Fuel Industry Volume Share (%), by Fuel Type 2024 & 2032
- Figure 47: Japan APAC Aviation Fuel Industry Revenue (Million), by Application 2024 & 2032
- Figure 48: Japan APAC Aviation Fuel Industry Volume (Litre), by Application 2024 & 2032
- Figure 49: Japan APAC Aviation Fuel Industry Revenue Share (%), by Application 2024 & 2032
- Figure 50: Japan APAC Aviation Fuel Industry Volume Share (%), by Application 2024 & 2032
- Figure 51: Japan APAC Aviation Fuel Industry Revenue (Million), by Geography 2024 & 2032
- Figure 52: Japan APAC Aviation Fuel Industry Volume (Litre), by Geography 2024 & 2032
- Figure 53: Japan APAC Aviation Fuel Industry Revenue Share (%), by Geography 2024 & 2032
- Figure 54: Japan APAC Aviation Fuel Industry Volume Share (%), by Geography 2024 & 2032
- Figure 55: Japan APAC Aviation Fuel Industry Revenue (Million), by Country 2024 & 2032
- Figure 56: Japan APAC Aviation Fuel Industry Volume (Litre), by Country 2024 & 2032
- Figure 57: Japan APAC Aviation Fuel Industry Revenue Share (%), by Country 2024 & 2032
- Figure 58: Japan APAC Aviation Fuel Industry Volume Share (%), by Country 2024 & 2032
- Figure 59: India APAC Aviation Fuel Industry Revenue (Million), by Fuel Type 2024 & 2032
- Figure 60: India APAC Aviation Fuel Industry Volume (Litre), by Fuel Type 2024 & 2032
- Figure 61: India APAC Aviation Fuel Industry Revenue Share (%), by Fuel Type 2024 & 2032
- Figure 62: India APAC Aviation Fuel Industry Volume Share (%), by Fuel Type 2024 & 2032
- Figure 63: India APAC Aviation Fuel Industry Revenue (Million), by Application 2024 & 2032
- Figure 64: India APAC Aviation Fuel Industry Volume (Litre), by Application 2024 & 2032
- Figure 65: India APAC Aviation Fuel Industry Revenue Share (%), by Application 2024 & 2032
- Figure 66: India APAC Aviation Fuel Industry Volume Share (%), by Application 2024 & 2032
- Figure 67: India APAC Aviation Fuel Industry Revenue (Million), by Geography 2024 & 2032
- Figure 68: India APAC Aviation Fuel Industry Volume (Litre), by Geography 2024 & 2032
- Figure 69: India APAC Aviation Fuel Industry Revenue Share (%), by Geography 2024 & 2032
- Figure 70: India APAC Aviation Fuel Industry Volume Share (%), by Geography 2024 & 2032
- Figure 71: India APAC Aviation Fuel Industry Revenue (Million), by Country 2024 & 2032
- Figure 72: India APAC Aviation Fuel Industry Volume (Litre), by Country 2024 & 2032
- Figure 73: India APAC Aviation Fuel Industry Revenue Share (%), by Country 2024 & 2032
- Figure 74: India APAC Aviation Fuel Industry Volume Share (%), by Country 2024 & 2032
- Figure 75: Indonesia APAC Aviation Fuel Industry Revenue (Million), by Fuel Type 2024 & 2032
- Figure 76: Indonesia APAC Aviation Fuel Industry Volume (Litre), by Fuel Type 2024 & 2032
- Figure 77: Indonesia APAC Aviation Fuel Industry Revenue Share (%), by Fuel Type 2024 & 2032
- Figure 78: Indonesia APAC Aviation Fuel Industry Volume Share (%), by Fuel Type 2024 & 2032
- Figure 79: Indonesia APAC Aviation Fuel Industry Revenue (Million), by Application 2024 & 2032
- Figure 80: Indonesia APAC Aviation Fuel Industry Volume (Litre), by Application 2024 & 2032
- Figure 81: Indonesia APAC Aviation Fuel Industry Revenue Share (%), by Application 2024 & 2032
- Figure 82: Indonesia APAC Aviation Fuel Industry Volume Share (%), by Application 2024 & 2032
- Figure 83: Indonesia APAC Aviation Fuel Industry Revenue (Million), by Geography 2024 & 2032
- Figure 84: Indonesia APAC Aviation Fuel Industry Volume (Litre), by Geography 2024 & 2032
- Figure 85: Indonesia APAC Aviation Fuel Industry Revenue Share (%), by Geography 2024 & 2032
- Figure 86: Indonesia APAC Aviation Fuel Industry Volume Share (%), by Geography 2024 & 2032
- Figure 87: Indonesia APAC Aviation Fuel Industry Revenue (Million), by Country 2024 & 2032
- Figure 88: Indonesia APAC Aviation Fuel Industry Volume (Litre), by Country 2024 & 2032
- Figure 89: Indonesia APAC Aviation Fuel Industry Revenue Share (%), by Country 2024 & 2032
- Figure 90: Indonesia APAC Aviation Fuel Industry Volume Share (%), by Country 2024 & 2032
- Figure 91: Australia APAC Aviation Fuel Industry Revenue (Million), by Fuel Type 2024 & 2032
- Figure 92: Australia APAC Aviation Fuel Industry Volume (Litre), by Fuel Type 2024 & 2032
- Figure 93: Australia APAC Aviation Fuel Industry Revenue Share (%), by Fuel Type 2024 & 2032
- Figure 94: Australia APAC Aviation Fuel Industry Volume Share (%), by Fuel Type 2024 & 2032
- Figure 95: Australia APAC Aviation Fuel Industry Revenue (Million), by Application 2024 & 2032
- Figure 96: Australia APAC Aviation Fuel Industry Volume (Litre), by Application 2024 & 2032
- Figure 97: Australia APAC Aviation Fuel Industry Revenue Share (%), by Application 2024 & 2032
- Figure 98: Australia APAC Aviation Fuel Industry Volume Share (%), by Application 2024 & 2032
- Figure 99: Australia APAC Aviation Fuel Industry Revenue (Million), by Geography 2024 & 2032
- Figure 100: Australia APAC Aviation Fuel Industry Volume (Litre), by Geography 2024 & 2032
- Figure 101: Australia APAC Aviation Fuel Industry Revenue Share (%), by Geography 2024 & 2032
- Figure 102: Australia APAC Aviation Fuel Industry Volume Share (%), by Geography 2024 & 2032
- Figure 103: Australia APAC Aviation Fuel Industry Revenue (Million), by Country 2024 & 2032
- Figure 104: Australia APAC Aviation Fuel Industry Volume (Litre), by Country 2024 & 2032
- Figure 105: Australia APAC Aviation Fuel Industry Revenue Share (%), by Country 2024 & 2032
- Figure 106: Australia APAC Aviation Fuel Industry Volume Share (%), by Country 2024 & 2032
- Figure 107: Rest of Asia Pacific APAC Aviation Fuel Industry Revenue (Million), by Fuel Type 2024 & 2032
- Figure 108: Rest of Asia Pacific APAC Aviation Fuel Industry Volume (Litre), by Fuel Type 2024 & 2032
- Figure 109: Rest of Asia Pacific APAC Aviation Fuel Industry Revenue Share (%), by Fuel Type 2024 & 2032
- Figure 110: Rest of Asia Pacific APAC Aviation Fuel Industry Volume Share (%), by Fuel Type 2024 & 2032
- Figure 111: Rest of Asia Pacific APAC Aviation Fuel Industry Revenue (Million), by Application 2024 & 2032
- Figure 112: Rest of Asia Pacific APAC Aviation Fuel Industry Volume (Litre), by Application 2024 & 2032
- Figure 113: Rest of Asia Pacific APAC Aviation Fuel Industry Revenue Share (%), by Application 2024 & 2032
- Figure 114: Rest of Asia Pacific APAC Aviation Fuel Industry Volume Share (%), by Application 2024 & 2032
- Figure 115: Rest of Asia Pacific APAC Aviation Fuel Industry Revenue (Million), by Geography 2024 & 2032
- Figure 116: Rest of Asia Pacific APAC Aviation Fuel Industry Volume (Litre), by Geography 2024 & 2032
- Figure 117: Rest of Asia Pacific APAC Aviation Fuel Industry Revenue Share (%), by Geography 2024 & 2032
- Figure 118: Rest of Asia Pacific APAC Aviation Fuel Industry Volume Share (%), by Geography 2024 & 2032
- Figure 119: Rest of Asia Pacific APAC Aviation Fuel Industry Revenue (Million), by Country 2024 & 2032
- Figure 120: Rest of Asia Pacific APAC Aviation Fuel Industry Volume (Litre), by Country 2024 & 2032
- Figure 121: Rest of Asia Pacific APAC Aviation Fuel Industry Revenue Share (%), by Country 2024 & 2032
- Figure 122: Rest of Asia Pacific APAC Aviation Fuel Industry Volume Share (%), by Country 2024 & 2032
List of Tables
- Table 1: Global APAC Aviation Fuel Industry Revenue Million Forecast, by Region 2019 & 2032
- Table 2: Global APAC Aviation Fuel Industry Volume Litre Forecast, by Region 2019 & 2032
- Table 3: Global APAC Aviation Fuel Industry Revenue Million Forecast, by Fuel Type 2019 & 2032
- Table 4: Global APAC Aviation Fuel Industry Volume Litre Forecast, by Fuel Type 2019 & 2032
- Table 5: Global APAC Aviation Fuel Industry Revenue Million Forecast, by Application 2019 & 2032
- Table 6: Global APAC Aviation Fuel Industry Volume Litre Forecast, by Application 2019 & 2032
- Table 7: Global APAC Aviation Fuel Industry Revenue Million Forecast, by Geography 2019 & 2032
- Table 8: Global APAC Aviation Fuel Industry Volume Litre Forecast, by Geography 2019 & 2032
- Table 9: Global APAC Aviation Fuel Industry Revenue Million Forecast, by Region 2019 & 2032
- Table 10: Global APAC Aviation Fuel Industry Volume Litre Forecast, by Region 2019 & 2032
- Table 11: Global APAC Aviation Fuel Industry Revenue Million Forecast, by Country 2019 & 2032
- Table 12: Global APAC Aviation Fuel Industry Volume Litre Forecast, by Country 2019 & 2032
- Table 13: United States APAC Aviation Fuel Industry Revenue (Million) Forecast, by Application 2019 & 2032
- Table 14: United States APAC Aviation Fuel Industry Volume (Litre) Forecast, by Application 2019 & 2032
- Table 15: Canada APAC Aviation Fuel Industry Revenue (Million) Forecast, by Application 2019 & 2032
- Table 16: Canada APAC Aviation Fuel Industry Volume (Litre) Forecast, by Application 2019 & 2032
- Table 17: Mexico APAC Aviation Fuel Industry Revenue (Million) Forecast, by Application 2019 & 2032
- Table 18: Mexico APAC Aviation Fuel Industry Volume (Litre) Forecast, by Application 2019 & 2032
- Table 19: Global APAC Aviation Fuel Industry Revenue Million Forecast, by Country 2019 & 2032
- Table 20: Global APAC Aviation Fuel Industry Volume Litre Forecast, by Country 2019 & 2032
- Table 21: Germany APAC Aviation Fuel Industry Revenue (Million) Forecast, by Application 2019 & 2032
- Table 22: Germany APAC Aviation Fuel Industry Volume (Litre) Forecast, by Application 2019 & 2032
- Table 23: United Kingdom APAC Aviation Fuel Industry Revenue (Million) Forecast, by Application 2019 & 2032
- Table 24: United Kingdom APAC Aviation Fuel Industry Volume (Litre) Forecast, by Application 2019 & 2032
- Table 25: France APAC Aviation Fuel Industry Revenue (Million) Forecast, by Application 2019 & 2032
- Table 26: France APAC Aviation Fuel Industry Volume (Litre) Forecast, by Application 2019 & 2032
- Table 27: Spain APAC Aviation Fuel Industry Revenue (Million) Forecast, by Application 2019 & 2032
- Table 28: Spain APAC Aviation Fuel Industry Volume (Litre) Forecast, by Application 2019 & 2032
- Table 29: Italy APAC Aviation Fuel Industry Revenue (Million) Forecast, by Application 2019 & 2032
- Table 30: Italy APAC Aviation Fuel Industry Volume (Litre) Forecast, by Application 2019 & 2032
- Table 31: Spain APAC Aviation Fuel Industry Revenue (Million) Forecast, by Application 2019 & 2032
- Table 32: Spain APAC Aviation Fuel Industry Volume (Litre) Forecast, by Application 2019 & 2032
- Table 33: Belgium APAC Aviation Fuel Industry Revenue (Million) Forecast, by Application 2019 & 2032
- Table 34: Belgium APAC Aviation Fuel Industry Volume (Litre) Forecast, by Application 2019 & 2032
- Table 35: Netherland APAC Aviation Fuel Industry Revenue (Million) Forecast, by Application 2019 & 2032
- Table 36: Netherland APAC Aviation Fuel Industry Volume (Litre) Forecast, by Application 2019 & 2032
- Table 37: Nordics APAC Aviation Fuel Industry Revenue (Million) Forecast, by Application 2019 & 2032
- Table 38: Nordics APAC Aviation Fuel Industry Volume (Litre) Forecast, by Application 2019 & 2032
- Table 39: Rest of Europe APAC Aviation Fuel Industry Revenue (Million) Forecast, by Application 2019 & 2032
- Table 40: Rest of Europe APAC Aviation Fuel Industry Volume (Litre) Forecast, by Application 2019 & 2032
- Table 41: Global APAC Aviation Fuel Industry Revenue Million Forecast, by Country 2019 & 2032
- Table 42: Global APAC Aviation Fuel Industry Volume Litre Forecast, by Country 2019 & 2032
- Table 43: China APAC Aviation Fuel Industry Revenue (Million) Forecast, by Application 2019 & 2032
- Table 44: China APAC Aviation Fuel Industry Volume (Litre) Forecast, by Application 2019 & 2032
- Table 45: Japan APAC Aviation Fuel Industry Revenue (Million) Forecast, by Application 2019 & 2032
- Table 46: Japan APAC Aviation Fuel Industry Volume (Litre) Forecast, by Application 2019 & 2032
- Table 47: India APAC Aviation Fuel Industry Revenue (Million) Forecast, by Application 2019 & 2032
- Table 48: India APAC Aviation Fuel Industry Volume (Litre) Forecast, by Application 2019 & 2032
- Table 49: South Korea APAC Aviation Fuel Industry Revenue (Million) Forecast, by Application 2019 & 2032
- Table 50: South Korea APAC Aviation Fuel Industry Volume (Litre) Forecast, by Application 2019 & 2032
- Table 51: Southeast Asia APAC Aviation Fuel Industry Revenue (Million) Forecast, by Application 2019 & 2032
- Table 52: Southeast Asia APAC Aviation Fuel Industry Volume (Litre) Forecast, by Application 2019 & 2032
- Table 53: Australia APAC Aviation Fuel Industry Revenue (Million) Forecast, by Application 2019 & 2032
- Table 54: Australia APAC Aviation Fuel Industry Volume (Litre) Forecast, by Application 2019 & 2032
- Table 55: Indonesia APAC Aviation Fuel Industry Revenue (Million) Forecast, by Application 2019 & 2032
- Table 56: Indonesia APAC Aviation Fuel Industry Volume (Litre) Forecast, by Application 2019 & 2032
- Table 57: Phillipes APAC Aviation Fuel Industry Revenue (Million) Forecast, by Application 2019 & 2032
- Table 58: Phillipes APAC Aviation Fuel Industry Volume (Litre) Forecast, by Application 2019 & 2032
- Table 59: Singapore APAC Aviation Fuel Industry Revenue (Million) Forecast, by Application 2019 & 2032
- Table 60: Singapore APAC Aviation Fuel Industry Volume (Litre) Forecast, by Application 2019 & 2032
- Table 61: Thailandc APAC Aviation Fuel Industry Revenue (Million) Forecast, by Application 2019 & 2032
- Table 62: Thailandc APAC Aviation Fuel Industry Volume (Litre) Forecast, by Application 2019 & 2032
- Table 63: Rest of Asia Pacific APAC Aviation Fuel Industry Revenue (Million) Forecast, by Application 2019 & 2032
- Table 64: Rest of Asia Pacific APAC Aviation Fuel Industry Volume (Litre) Forecast, by Application 2019 & 2032
- Table 65: Global APAC Aviation Fuel Industry Revenue Million Forecast, by Country 2019 & 2032
- Table 66: Global APAC Aviation Fuel Industry Volume Litre Forecast, by Country 2019 & 2032
- Table 67: Brazil APAC Aviation Fuel Industry Revenue (Million) Forecast, by Application 2019 & 2032
- Table 68: Brazil APAC Aviation Fuel Industry Volume (Litre) Forecast, by Application 2019 & 2032
- Table 69: Argentina APAC Aviation Fuel Industry Revenue (Million) Forecast, by Application 2019 & 2032
- Table 70: Argentina APAC Aviation Fuel Industry Volume (Litre) Forecast, by Application 2019 & 2032
- Table 71: Peru APAC Aviation Fuel Industry Revenue (Million) Forecast, by Application 2019 & 2032
- Table 72: Peru APAC Aviation Fuel Industry Volume (Litre) Forecast, by Application 2019 & 2032
- Table 73: Chile APAC Aviation Fuel Industry Revenue (Million) Forecast, by Application 2019 & 2032
- Table 74: Chile APAC Aviation Fuel Industry Volume (Litre) Forecast, by Application 2019 & 2032
- Table 75: Colombia APAC Aviation Fuel Industry Revenue (Million) Forecast, by Application 2019 & 2032
- Table 76: Colombia APAC Aviation Fuel Industry Volume (Litre) Forecast, by Application 2019 & 2032
- Table 77: Ecuador APAC Aviation Fuel Industry Revenue (Million) Forecast, by Application 2019 & 2032
- Table 78: Ecuador APAC Aviation Fuel Industry Volume (Litre) Forecast, by Application 2019 & 2032
- Table 79: Venezuela APAC Aviation Fuel Industry Revenue (Million) Forecast, by Application 2019 & 2032
- Table 80: Venezuela APAC Aviation Fuel Industry Volume (Litre) Forecast, by Application 2019 & 2032
- Table 81: Rest of South America APAC Aviation Fuel Industry Revenue (Million) Forecast, by Application 2019 & 2032
- Table 82: Rest of South America APAC Aviation Fuel Industry Volume (Litre) Forecast, by Application 2019 & 2032
- Table 83: Global APAC Aviation Fuel Industry Revenue Million Forecast, by Country 2019 & 2032
- Table 84: Global APAC Aviation Fuel Industry Volume Litre Forecast, by Country 2019 & 2032
- Table 85: United States APAC Aviation Fuel Industry Revenue (Million) Forecast, by Application 2019 & 2032
- Table 86: United States APAC Aviation Fuel Industry Volume (Litre) Forecast, by Application 2019 & 2032
- Table 87: Canada APAC Aviation Fuel Industry Revenue (Million) Forecast, by Application 2019 & 2032
- Table 88: Canada APAC Aviation Fuel Industry Volume (Litre) Forecast, by Application 2019 & 2032
- Table 89: Mexico APAC Aviation Fuel Industry Revenue (Million) Forecast, by Application 2019 & 2032
- Table 90: Mexico APAC Aviation Fuel Industry Volume (Litre) Forecast, by Application 2019 & 2032
- Table 91: Global APAC Aviation Fuel Industry Revenue Million Forecast, by Country 2019 & 2032
- Table 92: Global APAC Aviation Fuel Industry Volume Litre Forecast, by Country 2019 & 2032
- Table 93: United Arab Emirates APAC Aviation Fuel Industry Revenue (Million) Forecast, by Application 2019 & 2032
- Table 94: United Arab Emirates APAC Aviation Fuel Industry Volume (Litre) Forecast, by Application 2019 & 2032
- Table 95: Saudi Arabia APAC Aviation Fuel Industry Revenue (Million) Forecast, by Application 2019 & 2032
- Table 96: Saudi Arabia APAC Aviation Fuel Industry Volume (Litre) Forecast, by Application 2019 & 2032
- Table 97: South Africa APAC Aviation Fuel Industry Revenue (Million) Forecast, by Application 2019 & 2032
- Table 98: South Africa APAC Aviation Fuel Industry Volume (Litre) Forecast, by Application 2019 & 2032
- Table 99: Rest of Middle East and Africa APAC Aviation Fuel Industry Revenue (Million) Forecast, by Application 2019 & 2032
- Table 100: Rest of Middle East and Africa APAC Aviation Fuel Industry Volume (Litre) Forecast, by Application 2019 & 2032
- Table 101: Global APAC Aviation Fuel Industry Revenue Million Forecast, by Fuel Type 2019 & 2032
- Table 102: Global APAC Aviation Fuel Industry Volume Litre Forecast, by Fuel Type 2019 & 2032
- Table 103: Global APAC Aviation Fuel Industry Revenue Million Forecast, by Application 2019 & 2032
- Table 104: Global APAC Aviation Fuel Industry Volume Litre Forecast, by Application 2019 & 2032
- Table 105: Global APAC Aviation Fuel Industry Revenue Million Forecast, by Geography 2019 & 2032
- Table 106: Global APAC Aviation Fuel Industry Volume Litre Forecast, by Geography 2019 & 2032
- Table 107: Global APAC Aviation Fuel Industry Revenue Million Forecast, by Country 2019 & 2032
- Table 108: Global APAC Aviation Fuel Industry Volume Litre Forecast, by Country 2019 & 2032
- Table 109: Global APAC Aviation Fuel Industry Revenue Million Forecast, by Fuel Type 2019 & 2032
- Table 110: Global APAC Aviation Fuel Industry Volume Litre Forecast, by Fuel Type 2019 & 2032
- Table 111: Global APAC Aviation Fuel Industry Revenue Million Forecast, by Application 2019 & 2032
- Table 112: Global APAC Aviation Fuel Industry Volume Litre Forecast, by Application 2019 & 2032
- Table 113: Global APAC Aviation Fuel Industry Revenue Million Forecast, by Geography 2019 & 2032
- Table 114: Global APAC Aviation Fuel Industry Volume Litre Forecast, by Geography 2019 & 2032
- Table 115: Global APAC Aviation Fuel Industry Revenue Million Forecast, by Country 2019 & 2032
- Table 116: Global APAC Aviation Fuel Industry Volume Litre Forecast, by Country 2019 & 2032
- Table 117: Global APAC Aviation Fuel Industry Revenue Million Forecast, by Fuel Type 2019 & 2032
- Table 118: Global APAC Aviation Fuel Industry Volume Litre Forecast, by Fuel Type 2019 & 2032
- Table 119: Global APAC Aviation Fuel Industry Revenue Million Forecast, by Application 2019 & 2032
- Table 120: Global APAC Aviation Fuel Industry Volume Litre Forecast, by Application 2019 & 2032
- Table 121: Global APAC Aviation Fuel Industry Revenue Million Forecast, by Geography 2019 & 2032
- Table 122: Global APAC Aviation Fuel Industry Volume Litre Forecast, by Geography 2019 & 2032
- Table 123: Global APAC Aviation Fuel Industry Revenue Million Forecast, by Country 2019 & 2032
- Table 124: Global APAC Aviation Fuel Industry Volume Litre Forecast, by Country 2019 & 2032
- Table 125: Global APAC Aviation Fuel Industry Revenue Million Forecast, by Fuel Type 2019 & 2032
- Table 126: Global APAC Aviation Fuel Industry Volume Litre Forecast, by Fuel Type 2019 & 2032
- Table 127: Global APAC Aviation Fuel Industry Revenue Million Forecast, by Application 2019 & 2032
- Table 128: Global APAC Aviation Fuel Industry Volume Litre Forecast, by Application 2019 & 2032
- Table 129: Global APAC Aviation Fuel Industry Revenue Million Forecast, by Geography 2019 & 2032
- Table 130: Global APAC Aviation Fuel Industry Volume Litre Forecast, by Geography 2019 & 2032
- Table 131: Global APAC Aviation Fuel Industry Revenue Million Forecast, by Country 2019 & 2032
- Table 132: Global APAC Aviation Fuel Industry Volume Litre Forecast, by Country 2019 & 2032
- Table 133: Global APAC Aviation Fuel Industry Revenue Million Forecast, by Fuel Type 2019 & 2032
- Table 134: Global APAC Aviation Fuel Industry Volume Litre Forecast, by Fuel Type 2019 & 2032
- Table 135: Global APAC Aviation Fuel Industry Revenue Million Forecast, by Application 2019 & 2032
- Table 136: Global APAC Aviation Fuel Industry Volume Litre Forecast, by Application 2019 & 2032
- Table 137: Global APAC Aviation Fuel Industry Revenue Million Forecast, by Geography 2019 & 2032
- Table 138: Global APAC Aviation Fuel Industry Volume Litre Forecast, by Geography 2019 & 2032
- Table 139: Global APAC Aviation Fuel Industry Revenue Million Forecast, by Country 2019 & 2032
- Table 140: Global APAC Aviation Fuel Industry Volume Litre Forecast, by Country 2019 & 2032
- Table 141: Global APAC Aviation Fuel Industry Revenue Million Forecast, by Fuel Type 2019 & 2032
- Table 142: Global APAC Aviation Fuel Industry Volume Litre Forecast, by Fuel Type 2019 & 2032
- Table 143: Global APAC Aviation Fuel Industry Revenue Million Forecast, by Application 2019 & 2032
- Table 144: Global APAC Aviation Fuel Industry Volume Litre Forecast, by Application 2019 & 2032
- Table 145: Global APAC Aviation Fuel Industry Revenue Million Forecast, by Geography 2019 & 2032
- Table 146: Global APAC Aviation Fuel Industry Volume Litre Forecast, by Geography 2019 & 2032
- Table 147: Global APAC Aviation Fuel Industry Revenue Million Forecast, by Country 2019 & 2032
- Table 148: Global APAC Aviation Fuel Industry Volume Litre Forecast, by Country 2019 & 2032
Frequently Asked Questions
1. What is the projected Compound Annual Growth Rate (CAGR) of the APAC Aviation Fuel Industry?
The projected CAGR is approximately > 10.00%.
2. Which companies are prominent players in the APAC Aviation Fuel Industry?
Key companies in the market include BP plc, Bharat Petroleum Corp Ltd, Exxon Mobil Corporation*List Not Exhaustive, Royal Dutch Shell Plc, Pertamina Persero PT, Chevron Corporation, World Fuel Services Corp, Petronas Aviation Sdn Bhd, China Aviation Oil Corporation Ltd, Vitol Holding BV.
3. What are the main segments of the APAC Aviation Fuel Industry?
The market segments include Fuel Type, Application, Geography.
4. Can you provide details about the market size?
The market size is estimated to be USD XX Million as of 2022.
5. What are some drivers contributing to market growth?
4.; Increase in Prices of Electricity Procured from Conventional Mechanisms 4.; Decline in Cost of Solar Energy Infrastructure.
6. What are the notable trends driving market growth?
Commercial Aircraft Segment to Dominate the Market.
7. Are there any restraints impacting market growth?
4.; Competition from Other Alternative Energy Sources.
8. Can you provide examples of recent developments in the market?
N/A
9. What pricing options are available for accessing the report?
Pricing options include single-user, multi-user, and enterprise licenses priced at USD 4750, USD 5250, and USD 8750 respectively.
10. Is the market size provided in terms of value or volume?
The market size is provided in terms of value, measured in Million and volume, measured in Litre.
11. Are there any specific market keywords associated with the report?
Yes, the market keyword associated with the report is "APAC Aviation Fuel Industry," which aids in identifying and referencing the specific market segment covered.
12. How do I determine which pricing option suits my needs best?
The pricing options vary based on user requirements and access needs. Individual users may opt for single-user licenses, while businesses requiring broader access may choose multi-user or enterprise licenses for cost-effective access to the report.
13. Are there any additional resources or data provided in the APAC Aviation Fuel Industry report?
While the report offers comprehensive insights, it's advisable to review the specific contents or supplementary materials provided to ascertain if additional resources or data are available.
14. How can I stay updated on further developments or reports in the APAC Aviation Fuel Industry?
To stay informed about further developments, trends, and reports in the APAC Aviation Fuel Industry, consider subscribing to industry newsletters, following relevant companies and organizations, or regularly checking reputable industry news sources and publications.
Methodology
Step 1 - Identification of Relevant Samples Size from Population Database


Step 2 - Approaches for Defining Global Market Size (Value, Volume* & Price*)

Note*: In applicable scenarios
Step 3 - Data Sources
Primary Research
- Web Analytics
- Survey Reports
- Research Institute
- Latest Research Reports
- Opinion Leaders
Secondary Research
- Annual Reports
- White Paper
- Latest Press Release
- Industry Association
- Paid Database
- Investor Presentations

Step 4 - Data Triangulation
Involves using different sources of information in order to increase the validity of a study
These sources are likely to be stakeholders in a program - participants, other researchers, program staff, other community members, and so on.
Then we put all data in single framework & apply various statistical tools to find out the dynamic on the market.
During the analysis stage, feedback from the stakeholder groups would be compared to determine areas of agreement as well as areas of divergence
