

Key Insights
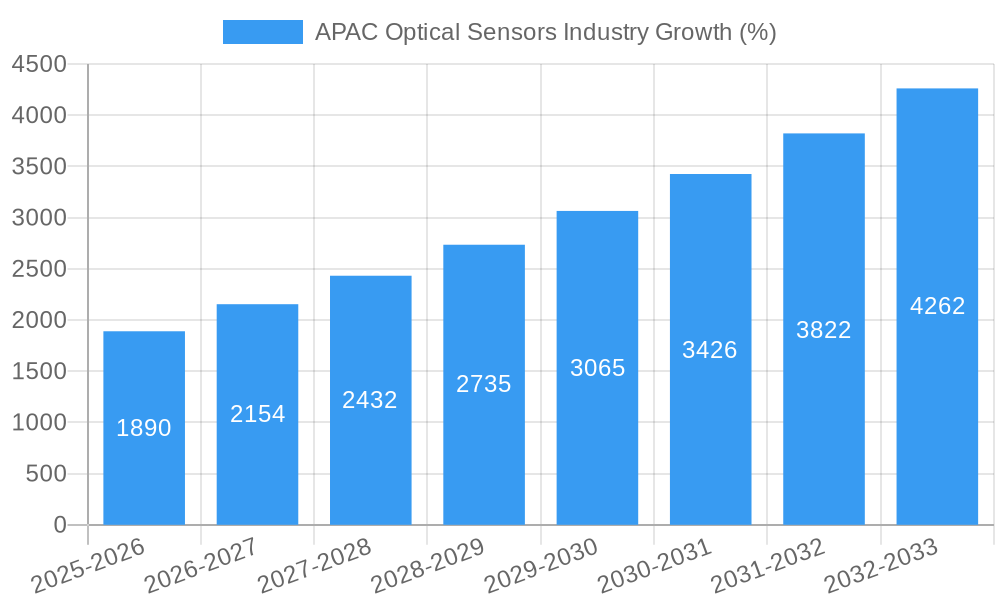
The Asia-Pacific (APAC) optical sensor market is experiencing robust growth, driven by the region's expanding industrial automation, burgeoning automotive sector, and increasing adoption of consumer electronics. The market's Compound Annual Growth Rate (CAGR) of 12.60% from 2019 to 2024 suggests a significant upward trajectory, which is expected to continue through 2033. Key growth drivers include the rising demand for high-precision and high-performance sensors in various applications like industrial process monitoring, advanced driver-assistance systems (ADAS) in vehicles, and biometric authentication in smartphones and other consumer devices. Furthermore, technological advancements in sensor miniaturization, improved sensitivity, and enhanced cost-effectiveness are fueling market expansion. Within APAC, countries like China, India, South Korea, and Japan are major contributors, owing to their strong manufacturing bases and supportive government policies promoting technological innovation. The increasing adoption of Industry 4.0 principles and the growing focus on smart manufacturing across diverse industries further accelerates the demand for optical sensors. Fiber optic sensors, image sensors, and proximity sensors represent significant segments within the APAC market, each catering to specific application needs.
While the market enjoys substantial growth potential, challenges remain. Supply chain disruptions, particularly concerning raw materials and specialized components, could impact production and market expansion. Furthermore, the market faces competition from alternative sensor technologies, requiring continuous innovation to maintain market leadership. However, the long-term outlook remains optimistic, fueled by increasing investment in research and development, and the emergence of new applications for optical sensors across diverse sectors. We project that the continued integration of optical sensors into increasingly sophisticated devices and systems will sustain the APAC market's impressive growth trajectory for the foreseeable future. The segmentation by sensor type (fiber optic, image, position, ambient light, proximity, infrared) and application (industrial, medical, biometric, automotive, consumer electronics) allows for targeted market analysis and strategic investment planning.

APAC Optical Sensors Industry Market Report: 2019-2033
This comprehensive report provides a detailed analysis of the Asia-Pacific (APAC) optical sensors industry, covering market size, growth drivers, key players, and future trends. The study period spans from 2019 to 2033, with 2025 as the base and estimated year. The report offers actionable insights for industry stakeholders, investors, and businesses operating within this dynamic sector. The market is segmented by sensor type (Fiber Optic Sensors, Image Sensors, Position Sensors, Ambient Light Sensors, Proximity Sensors, Infrared Sensors), application (Industrial, Medical, Biometric, Automotive, Consumer Electronics, Other Applications), and country (China, India, South Korea, Japan, Rest of Asia Pacific). The report values are expressed in Millions.
APAC Optical Sensors Industry Market Concentration & Dynamics
The APAC optical sensors market exhibits a moderately concentrated landscape, with several major players holding significant market share. Honeywell International Inc, Keyence Corporation, SICK AG, and STMicroelectronics NV are among the leading companies, collectively accounting for an estimated xx% of the market in 2025. However, the presence of numerous smaller, specialized players indicates a competitive environment. The market's innovation ecosystem is robust, driven by ongoing advancements in sensor technology and increasing demand across various applications. Regulatory frameworks vary across APAC countries, impacting market access and compliance. Substitute products, such as ultrasonic and capacitive sensors, pose a degree of competitive pressure. End-user trends, particularly toward automation and increased connectivity, significantly influence market growth. M&A activity in the sector has been moderate in recent years, with approximately xx deals recorded between 2019 and 2024. This activity is expected to increase as companies seek to expand their product portfolios and market reach.
- Market Share (2025): Top 4 players - xx%
- M&A Deal Count (2019-2024): xx
- Key Growth Drivers: Increasing automation, technological advancements, rising demand in automotive and consumer electronics.
- Challenges: Stringent regulations in some countries, price competition, supply chain complexities.
APAC Optical Sensors Industry Industry Insights & Trends
The APAC optical sensors market is experiencing robust growth, driven by the increasing adoption of automation technologies across various industries. The market size reached approximately USD xx Million in 2024 and is projected to reach USD xx Million by 2033, exhibiting a CAGR of xx% during the forecast period (2025-2033). Technological disruptions, particularly the emergence of advanced sensor technologies like 3D imaging and LiDAR, are reshaping the market landscape. Evolving consumer behaviors, including the demand for smart devices and advanced healthcare solutions, are driving demand for high-performance optical sensors. The industrial sector remains the dominant application segment, while the automotive and consumer electronics sectors are exhibiting rapid growth. The ongoing shift towards Industry 4.0 and the expansion of smart cities are key factors fueling market expansion.
Key Markets & Segments Leading APAC Optical Sensors Industry
China holds the largest market share within the APAC region, followed by Japan, South Korea, and India. This dominance is driven by strong economic growth, burgeoning industrial sectors, and government initiatives promoting technological advancements.
Drivers:
- China: Rapid industrialization, large manufacturing base, significant government investment in technology.
- Japan: Advanced technological capabilities, strong presence of automotive and electronics industries.
- South Korea: Highly developed electronics sector, strong focus on R&D.
- India: Growing industrialization, rising demand for consumer electronics and healthcare technologies.
Segment Dominance:
- By Sensor Type: The Image Sensors segment is projected to hold the largest market share owing to its wide applications across various industries.
- By Application: Industrial automation remains the leading application area, fueled by demand for increased efficiency and precision.
The Rest of Asia Pacific region also shows promising growth potential, with several countries experiencing rapid economic development and technological adoption.
APAP Optical Sensors Industry Product Developments
Significant product innovations have emerged recently, including the development of miniaturized sensors with improved sensitivity and accuracy. These advancements have expanded the range of applications for optical sensors, particularly in areas like medical diagnostics, autonomous driving, and consumer electronics. Competition in the market is driving companies to develop unique features and functionalities, leading to a wide array of sensor types and performance capabilities. The focus is shifting toward sensor fusion and integration with other technologies like AI and IoT to create more sophisticated solutions.
Challenges in the APAC Optical Sensors Industry Market
The APAC optical sensors market faces several challenges, including supply chain disruptions caused by geopolitical events and the COVID-19 pandemic. These disruptions have led to increased lead times and material costs. Intense competition from both established players and new entrants adds to the challenges. Regulatory compliance and standardization issues vary across the region, presenting complexities for manufacturers. High R&D costs and skilled labor shortages also affect the market. The combined impact of these factors can lead to decreased profit margins and slowed growth.
Forces Driving APAC Optical Sensors Industry Growth
Several factors fuel the growth of the APAC optical sensors market. Technological advancements, such as miniaturization and improved sensor performance, are key drivers. Economic growth in many APAC countries is creating increased demand across various sectors. Government support for technological innovation and infrastructure development further stimulates market growth. For example, the increasing adoption of automation in manufacturing and the expansion of smart city initiatives are significant growth catalysts.
Long-Term Growth Catalysts in the APAC Optical Sensors Industry
Long-term growth in the APAC optical sensors market will be driven by continued innovation in sensor technology, including advancements in 3D imaging and hyperspectral imaging. Strategic partnerships between sensor manufacturers and system integrators will play a key role in market expansion. The development of new applications in fields like robotics, healthcare, and environmental monitoring will further drive growth. The expansion into emerging markets within APAC will create significant opportunities.
Emerging Opportunities in the APAC Optical Sensors Industry
The increasing adoption of IoT and AI technologies presents significant growth opportunities for the APAC optical sensors market. The demand for advanced sensor solutions in the automotive industry (autonomous driving, ADAS) is rapidly expanding. New markets are emerging in areas like precision agriculture and environmental monitoring, offering significant potential for growth. Growing consumer demand for high-quality images and 3D sensing in consumer electronics also represent significant opportunities.
Leading Players in the APAC Optical Sensors Industry Sector
- Honeywell International Inc
- Keyence Corporation
- SICK AG
- STMicroelectronics NV
- Shinkoh Electronics Co Ltd
- Robert Bosch GmbH
- Atmel Corporation
- Rockwell Automation Inc
- OZ Optics Ltd
- Neubrex Co Ltd
- List Not Exhaustive
Key Milestones in APAC Optical Sensors Industry Industry
- September 2022: The Northeast Frontier Railway (NFR) implemented optical sensor technology to alert locomotive drivers about nearby animals, a significant step in railway safety and a potential boost for the optical sensor market in the transportation sector.
Strategic Outlook for APAC Optical Sensors Industry Market
The APAC optical sensors market is poised for strong growth over the next decade. The convergence of technological advancements, increasing automation, and rising consumer demand creates a favorable environment for market expansion. Companies focusing on innovation, strategic partnerships, and expansion into emerging applications are well-positioned to capitalize on the considerable market opportunities. The market's future hinges on continued technological development and the successful integration of optical sensors into various sectors.
APAC Optical Sensors Industry Segmentation
-
1. Sensor Type
- 1.1. Fiber Optic Sensors
- 1.2. Image Sensors
- 1.3. Position Sensors
- 1.4. Ambient light
- 1.5. Proximity Sensors
- 1.6. Infrared Sensors
-
2. Application
- 2.1. Industrial
- 2.2. Medical
- 2.3. Biometric
- 2.4. Automotive
- 2.5. Consumer Electronics
- 2.6. Other Applications
APAC Optical Sensors Industry Segmentation By Geography
-
1. North America
- 1.1. United States
- 1.2. Canada
- 1.3. Mexico
-
2. South America
- 2.1. Brazil
- 2.2. Argentina
- 2.3. Rest of South America
-
3. Europe
- 3.1. United Kingdom
- 3.2. Germany
- 3.3. France
- 3.4. Italy
- 3.5. Spain
- 3.6. Russia
- 3.7. Benelux
- 3.8. Nordics
- 3.9. Rest of Europe
-
4. Middle East & Africa
- 4.1. Turkey
- 4.2. Israel
- 4.3. GCC
- 4.4. North Africa
- 4.5. South Africa
- 4.6. Rest of Middle East & Africa
-
5. Asia Pacific
- 5.1. China
- 5.2. India
- 5.3. Japan
- 5.4. South Korea
- 5.5. ASEAN
- 5.6. Oceania
- 5.7. Rest of Asia Pacific

APAC Optical Sensors Industry REPORT HIGHLIGHTS
| Aspects | Details |
|---|---|
| Study Period | 2019-2033 |
| Base Year | 2024 |
| Estimated Year | 2025 |
| Forecast Period | 2025-2033 |
| Historical Period | 2019-2024 |
| Growth Rate | CAGR of 12.60% from 2019-2033 |
| Segmentation |
|
Table of Contents
- 1. Introduction
- 1.1. Research Scope
- 1.2. Market Segmentation
- 1.3. Research Methodology
- 1.4. Definitions and Assumptions
- 2. Executive Summary
- 2.1. Introduction
- 3. Market Dynamics
- 3.1. Introduction
- 3.2. Market Drivers
- 3.2.1. Increasing demand from consumer electronics; Rising adoption of IoT
- 3.3. Market Restrains
- 3.3.1. Intense Competition in the Market
- 3.4. Market Trends
- 3.4.1. Growing consumer electronics demand will boost the market growth
- 4. Market Factor Analysis
- 4.1. Porters Five Forces
- 4.2. Supply/Value Chain
- 4.3. PESTEL analysis
- 4.4. Market Entropy
- 4.5. Patent/Trademark Analysis
- 5. Global APAC Optical Sensors Industry Analysis, Insights and Forecast, 2019-2031
- 5.1. Market Analysis, Insights and Forecast - by Sensor Type
- 5.1.1. Fiber Optic Sensors
- 5.1.2. Image Sensors
- 5.1.3. Position Sensors
- 5.1.4. Ambient light
- 5.1.5. Proximity Sensors
- 5.1.6. Infrared Sensors
- 5.2. Market Analysis, Insights and Forecast - by Application
- 5.2.1. Industrial
- 5.2.2. Medical
- 5.2.3. Biometric
- 5.2.4. Automotive
- 5.2.5. Consumer Electronics
- 5.2.6. Other Applications
- 5.3. Market Analysis, Insights and Forecast - by Region
- 5.3.1. North America
- 5.3.2. South America
- 5.3.3. Europe
- 5.3.4. Middle East & Africa
- 5.3.5. Asia Pacific
- 5.1. Market Analysis, Insights and Forecast - by Sensor Type
- 6. North America APAC Optical Sensors Industry Analysis, Insights and Forecast, 2019-2031
- 6.1. Market Analysis, Insights and Forecast - by Sensor Type
- 6.1.1. Fiber Optic Sensors
- 6.1.2. Image Sensors
- 6.1.3. Position Sensors
- 6.1.4. Ambient light
- 6.1.5. Proximity Sensors
- 6.1.6. Infrared Sensors
- 6.2. Market Analysis, Insights and Forecast - by Application
- 6.2.1. Industrial
- 6.2.2. Medical
- 6.2.3. Biometric
- 6.2.4. Automotive
- 6.2.5. Consumer Electronics
- 6.2.6. Other Applications
- 6.1. Market Analysis, Insights and Forecast - by Sensor Type
- 7. South America APAC Optical Sensors Industry Analysis, Insights and Forecast, 2019-2031
- 7.1. Market Analysis, Insights and Forecast - by Sensor Type
- 7.1.1. Fiber Optic Sensors
- 7.1.2. Image Sensors
- 7.1.3. Position Sensors
- 7.1.4. Ambient light
- 7.1.5. Proximity Sensors
- 7.1.6. Infrared Sensors
- 7.2. Market Analysis, Insights and Forecast - by Application
- 7.2.1. Industrial
- 7.2.2. Medical
- 7.2.3. Biometric
- 7.2.4. Automotive
- 7.2.5. Consumer Electronics
- 7.2.6. Other Applications
- 7.1. Market Analysis, Insights and Forecast - by Sensor Type
- 8. Europe APAC Optical Sensors Industry Analysis, Insights and Forecast, 2019-2031
- 8.1. Market Analysis, Insights and Forecast - by Sensor Type
- 8.1.1. Fiber Optic Sensors
- 8.1.2. Image Sensors
- 8.1.3. Position Sensors
- 8.1.4. Ambient light
- 8.1.5. Proximity Sensors
- 8.1.6. Infrared Sensors
- 8.2. Market Analysis, Insights and Forecast - by Application
- 8.2.1. Industrial
- 8.2.2. Medical
- 8.2.3. Biometric
- 8.2.4. Automotive
- 8.2.5. Consumer Electronics
- 8.2.6. Other Applications
- 8.1. Market Analysis, Insights and Forecast - by Sensor Type
- 9. Middle East & Africa APAC Optical Sensors Industry Analysis, Insights and Forecast, 2019-2031
- 9.1. Market Analysis, Insights and Forecast - by Sensor Type
- 9.1.1. Fiber Optic Sensors
- 9.1.2. Image Sensors
- 9.1.3. Position Sensors
- 9.1.4. Ambient light
- 9.1.5. Proximity Sensors
- 9.1.6. Infrared Sensors
- 9.2. Market Analysis, Insights and Forecast - by Application
- 9.2.1. Industrial
- 9.2.2. Medical
- 9.2.3. Biometric
- 9.2.4. Automotive
- 9.2.5. Consumer Electronics
- 9.2.6. Other Applications
- 9.1. Market Analysis, Insights and Forecast - by Sensor Type
- 10. Asia Pacific APAC Optical Sensors Industry Analysis, Insights and Forecast, 2019-2031
- 10.1. Market Analysis, Insights and Forecast - by Sensor Type
- 10.1.1. Fiber Optic Sensors
- 10.1.2. Image Sensors
- 10.1.3. Position Sensors
- 10.1.4. Ambient light
- 10.1.5. Proximity Sensors
- 10.1.6. Infrared Sensors
- 10.2. Market Analysis, Insights and Forecast - by Application
- 10.2.1. Industrial
- 10.2.2. Medical
- 10.2.3. Biometric
- 10.2.4. Automotive
- 10.2.5. Consumer Electronics
- 10.2.6. Other Applications
- 10.1. Market Analysis, Insights and Forecast - by Sensor Type
- 11. North America APAC Optical Sensors Industry Analysis, Insights and Forecast, 2019-2031
- 11.1. Market Analysis, Insights and Forecast - By Country/Sub-region
- 11.1.1.
- 12. Europe APAC Optical Sensors Industry Analysis, Insights and Forecast, 2019-2031
- 12.1. Market Analysis, Insights and Forecast - By Country/Sub-region
- 12.1.1.
- 13. Asia Pacific APAC Optical Sensors Industry Analysis, Insights and Forecast, 2019-2031
- 13.1. Market Analysis, Insights and Forecast - By Country/Sub-region
- 13.1.1.
- 14. Latin America APAC Optical Sensors Industry Analysis, Insights and Forecast, 2019-2031
- 14.1. Market Analysis, Insights and Forecast - By Country/Sub-region
- 14.1.1.
- 15. Middle East APAC Optical Sensors Industry Analysis, Insights and Forecast, 2019-2031
- 15.1. Market Analysis, Insights and Forecast - By Country/Sub-region
- 15.1.1.
- 16. Competitive Analysis
- 16.1. Global Market Share Analysis 2024
- 16.2. Company Profiles
- 16.2.1 Honeywell International Inc
- 16.2.1.1. Overview
- 16.2.1.2. Products
- 16.2.1.3. SWOT Analysis
- 16.2.1.4. Recent Developments
- 16.2.1.5. Financials (Based on Availability)
- 16.2.2 Keyence Corporation
- 16.2.2.1. Overview
- 16.2.2.2. Products
- 16.2.2.3. SWOT Analysis
- 16.2.2.4. Recent Developments
- 16.2.2.5. Financials (Based on Availability)
- 16.2.3 SICK AG
- 16.2.3.1. Overview
- 16.2.3.2. Products
- 16.2.3.3. SWOT Analysis
- 16.2.3.4. Recent Developments
- 16.2.3.5. Financials (Based on Availability)
- 16.2.4 STMicroelectronics NV
- 16.2.4.1. Overview
- 16.2.4.2. Products
- 16.2.4.3. SWOT Analysis
- 16.2.4.4. Recent Developments
- 16.2.4.5. Financials (Based on Availability)
- 16.2.5 Shinkoh Electronics Co Ltd
- 16.2.5.1. Overview
- 16.2.5.2. Products
- 16.2.5.3. SWOT Analysis
- 16.2.5.4. Recent Developments
- 16.2.5.5. Financials (Based on Availability)
- 16.2.6 Robert Bosch GmbH
- 16.2.6.1. Overview
- 16.2.6.2. Products
- 16.2.6.3. SWOT Analysis
- 16.2.6.4. Recent Developments
- 16.2.6.5. Financials (Based on Availability)
- 16.2.7 Atmel Corporation
- 16.2.7.1. Overview
- 16.2.7.2. Products
- 16.2.7.3. SWOT Analysis
- 16.2.7.4. Recent Developments
- 16.2.7.5. Financials (Based on Availability)
- 16.2.8 Rockwell Automation Inc
- 16.2.8.1. Overview
- 16.2.8.2. Products
- 16.2.8.3. SWOT Analysis
- 16.2.8.4. Recent Developments
- 16.2.8.5. Financials (Based on Availability)
- 16.2.9 OZ Optics Ltd
- 16.2.9.1. Overview
- 16.2.9.2. Products
- 16.2.9.3. SWOT Analysis
- 16.2.9.4. Recent Developments
- 16.2.9.5. Financials (Based on Availability)
- 16.2.10 Neubrex Co Ltd *List Not Exhaustive
- 16.2.10.1. Overview
- 16.2.10.2. Products
- 16.2.10.3. SWOT Analysis
- 16.2.10.4. Recent Developments
- 16.2.10.5. Financials (Based on Availability)
- 16.2.1 Honeywell International Inc
List of Figures
- Figure 1: Global APAC Optical Sensors Industry Revenue Breakdown (Million, %) by Region 2024 & 2032
- Figure 2: North America APAC Optical Sensors Industry Revenue (Million), by Country 2024 & 2032
- Figure 3: North America APAC Optical Sensors Industry Revenue Share (%), by Country 2024 & 2032
- Figure 4: Europe APAC Optical Sensors Industry Revenue (Million), by Country 2024 & 2032
- Figure 5: Europe APAC Optical Sensors Industry Revenue Share (%), by Country 2024 & 2032
- Figure 6: Asia Pacific APAC Optical Sensors Industry Revenue (Million), by Country 2024 & 2032
- Figure 7: Asia Pacific APAC Optical Sensors Industry Revenue Share (%), by Country 2024 & 2032
- Figure 8: Latin America APAC Optical Sensors Industry Revenue (Million), by Country 2024 & 2032
- Figure 9: Latin America APAC Optical Sensors Industry Revenue Share (%), by Country 2024 & 2032
- Figure 10: Middle East APAC Optical Sensors Industry Revenue (Million), by Country 2024 & 2032
- Figure 11: Middle East APAC Optical Sensors Industry Revenue Share (%), by Country 2024 & 2032
- Figure 12: North America APAC Optical Sensors Industry Revenue (Million), by Sensor Type 2024 & 2032
- Figure 13: North America APAC Optical Sensors Industry Revenue Share (%), by Sensor Type 2024 & 2032
- Figure 14: North America APAC Optical Sensors Industry Revenue (Million), by Application 2024 & 2032
- Figure 15: North America APAC Optical Sensors Industry Revenue Share (%), by Application 2024 & 2032
- Figure 16: North America APAC Optical Sensors Industry Revenue (Million), by Country 2024 & 2032
- Figure 17: North America APAC Optical Sensors Industry Revenue Share (%), by Country 2024 & 2032
- Figure 18: South America APAC Optical Sensors Industry Revenue (Million), by Sensor Type 2024 & 2032
- Figure 19: South America APAC Optical Sensors Industry Revenue Share (%), by Sensor Type 2024 & 2032
- Figure 20: South America APAC Optical Sensors Industry Revenue (Million), by Application 2024 & 2032
- Figure 21: South America APAC Optical Sensors Industry Revenue Share (%), by Application 2024 & 2032
- Figure 22: South America APAC Optical Sensors Industry Revenue (Million), by Country 2024 & 2032
- Figure 23: South America APAC Optical Sensors Industry Revenue Share (%), by Country 2024 & 2032
- Figure 24: Europe APAC Optical Sensors Industry Revenue (Million), by Sensor Type 2024 & 2032
- Figure 25: Europe APAC Optical Sensors Industry Revenue Share (%), by Sensor Type 2024 & 2032
- Figure 26: Europe APAC Optical Sensors Industry Revenue (Million), by Application 2024 & 2032
- Figure 27: Europe APAC Optical Sensors Industry Revenue Share (%), by Application 2024 & 2032
- Figure 28: Europe APAC Optical Sensors Industry Revenue (Million), by Country 2024 & 2032
- Figure 29: Europe APAC Optical Sensors Industry Revenue Share (%), by Country 2024 & 2032
- Figure 30: Middle East & Africa APAC Optical Sensors Industry Revenue (Million), by Sensor Type 2024 & 2032
- Figure 31: Middle East & Africa APAC Optical Sensors Industry Revenue Share (%), by Sensor Type 2024 & 2032
- Figure 32: Middle East & Africa APAC Optical Sensors Industry Revenue (Million), by Application 2024 & 2032
- Figure 33: Middle East & Africa APAC Optical Sensors Industry Revenue Share (%), by Application 2024 & 2032
- Figure 34: Middle East & Africa APAC Optical Sensors Industry Revenue (Million), by Country 2024 & 2032
- Figure 35: Middle East & Africa APAC Optical Sensors Industry Revenue Share (%), by Country 2024 & 2032
- Figure 36: Asia Pacific APAC Optical Sensors Industry Revenue (Million), by Sensor Type 2024 & 2032
- Figure 37: Asia Pacific APAC Optical Sensors Industry Revenue Share (%), by Sensor Type 2024 & 2032
- Figure 38: Asia Pacific APAC Optical Sensors Industry Revenue (Million), by Application 2024 & 2032
- Figure 39: Asia Pacific APAC Optical Sensors Industry Revenue Share (%), by Application 2024 & 2032
- Figure 40: Asia Pacific APAC Optical Sensors Industry Revenue (Million), by Country 2024 & 2032
- Figure 41: Asia Pacific APAC Optical Sensors Industry Revenue Share (%), by Country 2024 & 2032
List of Tables
- Table 1: Global APAC Optical Sensors Industry Revenue Million Forecast, by Region 2019 & 2032
- Table 2: Global APAC Optical Sensors Industry Revenue Million Forecast, by Sensor Type 2019 & 2032
- Table 3: Global APAC Optical Sensors Industry Revenue Million Forecast, by Application 2019 & 2032
- Table 4: Global APAC Optical Sensors Industry Revenue Million Forecast, by Region 2019 & 2032
- Table 5: Global APAC Optical Sensors Industry Revenue Million Forecast, by Country 2019 & 2032
- Table 6: APAC Optical Sensors Industry Revenue (Million) Forecast, by Application 2019 & 2032
- Table 7: Global APAC Optical Sensors Industry Revenue Million Forecast, by Country 2019 & 2032
- Table 8: APAC Optical Sensors Industry Revenue (Million) Forecast, by Application 2019 & 2032
- Table 9: Global APAC Optical Sensors Industry Revenue Million Forecast, by Country 2019 & 2032
- Table 10: APAC Optical Sensors Industry Revenue (Million) Forecast, by Application 2019 & 2032
- Table 11: Global APAC Optical Sensors Industry Revenue Million Forecast, by Country 2019 & 2032
- Table 12: APAC Optical Sensors Industry Revenue (Million) Forecast, by Application 2019 & 2032
- Table 13: Global APAC Optical Sensors Industry Revenue Million Forecast, by Country 2019 & 2032
- Table 14: APAC Optical Sensors Industry Revenue (Million) Forecast, by Application 2019 & 2032
- Table 15: Global APAC Optical Sensors Industry Revenue Million Forecast, by Sensor Type 2019 & 2032
- Table 16: Global APAC Optical Sensors Industry Revenue Million Forecast, by Application 2019 & 2032
- Table 17: Global APAC Optical Sensors Industry Revenue Million Forecast, by Country 2019 & 2032
- Table 18: United States APAC Optical Sensors Industry Revenue (Million) Forecast, by Application 2019 & 2032
- Table 19: Canada APAC Optical Sensors Industry Revenue (Million) Forecast, by Application 2019 & 2032
- Table 20: Mexico APAC Optical Sensors Industry Revenue (Million) Forecast, by Application 2019 & 2032
- Table 21: Global APAC Optical Sensors Industry Revenue Million Forecast, by Sensor Type 2019 & 2032
- Table 22: Global APAC Optical Sensors Industry Revenue Million Forecast, by Application 2019 & 2032
- Table 23: Global APAC Optical Sensors Industry Revenue Million Forecast, by Country 2019 & 2032
- Table 24: Brazil APAC Optical Sensors Industry Revenue (Million) Forecast, by Application 2019 & 2032
- Table 25: Argentina APAC Optical Sensors Industry Revenue (Million) Forecast, by Application 2019 & 2032
- Table 26: Rest of South America APAC Optical Sensors Industry Revenue (Million) Forecast, by Application 2019 & 2032
- Table 27: Global APAC Optical Sensors Industry Revenue Million Forecast, by Sensor Type 2019 & 2032
- Table 28: Global APAC Optical Sensors Industry Revenue Million Forecast, by Application 2019 & 2032
- Table 29: Global APAC Optical Sensors Industry Revenue Million Forecast, by Country 2019 & 2032
- Table 30: United Kingdom APAC Optical Sensors Industry Revenue (Million) Forecast, by Application 2019 & 2032
- Table 31: Germany APAC Optical Sensors Industry Revenue (Million) Forecast, by Application 2019 & 2032
- Table 32: France APAC Optical Sensors Industry Revenue (Million) Forecast, by Application 2019 & 2032
- Table 33: Italy APAC Optical Sensors Industry Revenue (Million) Forecast, by Application 2019 & 2032
- Table 34: Spain APAC Optical Sensors Industry Revenue (Million) Forecast, by Application 2019 & 2032
- Table 35: Russia APAC Optical Sensors Industry Revenue (Million) Forecast, by Application 2019 & 2032
- Table 36: Benelux APAC Optical Sensors Industry Revenue (Million) Forecast, by Application 2019 & 2032
- Table 37: Nordics APAC Optical Sensors Industry Revenue (Million) Forecast, by Application 2019 & 2032
- Table 38: Rest of Europe APAC Optical Sensors Industry Revenue (Million) Forecast, by Application 2019 & 2032
- Table 39: Global APAC Optical Sensors Industry Revenue Million Forecast, by Sensor Type 2019 & 2032
- Table 40: Global APAC Optical Sensors Industry Revenue Million Forecast, by Application 2019 & 2032
- Table 41: Global APAC Optical Sensors Industry Revenue Million Forecast, by Country 2019 & 2032
- Table 42: Turkey APAC Optical Sensors Industry Revenue (Million) Forecast, by Application 2019 & 2032
- Table 43: Israel APAC Optical Sensors Industry Revenue (Million) Forecast, by Application 2019 & 2032
- Table 44: GCC APAC Optical Sensors Industry Revenue (Million) Forecast, by Application 2019 & 2032
- Table 45: North Africa APAC Optical Sensors Industry Revenue (Million) Forecast, by Application 2019 & 2032
- Table 46: South Africa APAC Optical Sensors Industry Revenue (Million) Forecast, by Application 2019 & 2032
- Table 47: Rest of Middle East & Africa APAC Optical Sensors Industry Revenue (Million) Forecast, by Application 2019 & 2032
- Table 48: Global APAC Optical Sensors Industry Revenue Million Forecast, by Sensor Type 2019 & 2032
- Table 49: Global APAC Optical Sensors Industry Revenue Million Forecast, by Application 2019 & 2032
- Table 50: Global APAC Optical Sensors Industry Revenue Million Forecast, by Country 2019 & 2032
- Table 51: China APAC Optical Sensors Industry Revenue (Million) Forecast, by Application 2019 & 2032
- Table 52: India APAC Optical Sensors Industry Revenue (Million) Forecast, by Application 2019 & 2032
- Table 53: Japan APAC Optical Sensors Industry Revenue (Million) Forecast, by Application 2019 & 2032
- Table 54: South Korea APAC Optical Sensors Industry Revenue (Million) Forecast, by Application 2019 & 2032
- Table 55: ASEAN APAC Optical Sensors Industry Revenue (Million) Forecast, by Application 2019 & 2032
- Table 56: Oceania APAC Optical Sensors Industry Revenue (Million) Forecast, by Application 2019 & 2032
- Table 57: Rest of Asia Pacific APAC Optical Sensors Industry Revenue (Million) Forecast, by Application 2019 & 2032
Frequently Asked Questions
1. What is the projected Compound Annual Growth Rate (CAGR) of the APAC Optical Sensors Industry?
The projected CAGR is approximately 12.60%.
2. Which companies are prominent players in the APAC Optical Sensors Industry?
Key companies in the market include Honeywell International Inc, Keyence Corporation, SICK AG, STMicroelectronics NV, Shinkoh Electronics Co Ltd, Robert Bosch GmbH, Atmel Corporation, Rockwell Automation Inc, OZ Optics Ltd, Neubrex Co Ltd *List Not Exhaustive.
3. What are the main segments of the APAC Optical Sensors Industry?
The market segments include Sensor Type, Application.
4. Can you provide details about the market size?
The market size is estimated to be USD XX Million as of 2022.
5. What are some drivers contributing to market growth?
Increasing demand from consumer electronics; Rising adoption of IoT.
6. What are the notable trends driving market growth?
Growing consumer electronics demand will boost the market growth.
7. Are there any restraints impacting market growth?
Intense Competition in the Market.
8. Can you provide examples of recent developments in the market?
September 2022 - The Northeast Frontier Railway (NFR) announced rolling out an optical sensor technology to alert locomotive drivers about the presence of animals in the vicinity of trains. The development took place after the amplifying system imitating the buzz of a swarm of honey bees to keep wild jumbos away from rail tracks failed to give an ultimate solution to curb elephant deaths.
9. What pricing options are available for accessing the report?
Pricing options include single-user, multi-user, and enterprise licenses priced at USD 4750, USD 4950, and USD 6800 respectively.
10. Is the market size provided in terms of value or volume?
The market size is provided in terms of value, measured in Million.
11. Are there any specific market keywords associated with the report?
Yes, the market keyword associated with the report is "APAC Optical Sensors Industry," which aids in identifying and referencing the specific market segment covered.
12. How do I determine which pricing option suits my needs best?
The pricing options vary based on user requirements and access needs. Individual users may opt for single-user licenses, while businesses requiring broader access may choose multi-user or enterprise licenses for cost-effective access to the report.
13. Are there any additional resources or data provided in the APAC Optical Sensors Industry report?
While the report offers comprehensive insights, it's advisable to review the specific contents or supplementary materials provided to ascertain if additional resources or data are available.
14. How can I stay updated on further developments or reports in the APAC Optical Sensors Industry?
To stay informed about further developments, trends, and reports in the APAC Optical Sensors Industry, consider subscribing to industry newsletters, following relevant companies and organizations, or regularly checking reputable industry news sources and publications.
Methodology
Step 1 - Identification of Relevant Samples Size from Population Database


Step 2 - Approaches for Defining Global Market Size (Value, Volume* & Price*)

Note*: In applicable scenarios
Step 3 - Data Sources
Primary Research
- Web Analytics
- Survey Reports
- Research Institute
- Latest Research Reports
- Opinion Leaders
Secondary Research
- Annual Reports
- White Paper
- Latest Press Release
- Industry Association
- Paid Database
- Investor Presentations

Step 4 - Data Triangulation
Involves using different sources of information in order to increase the validity of a study
These sources are likely to be stakeholders in a program - participants, other researchers, program staff, other community members, and so on.
Then we put all data in single framework & apply various statistical tools to find out the dynamic on the market.
During the analysis stage, feedback from the stakeholder groups would be compared to determine areas of agreement as well as areas of divergence
