

Key Insights
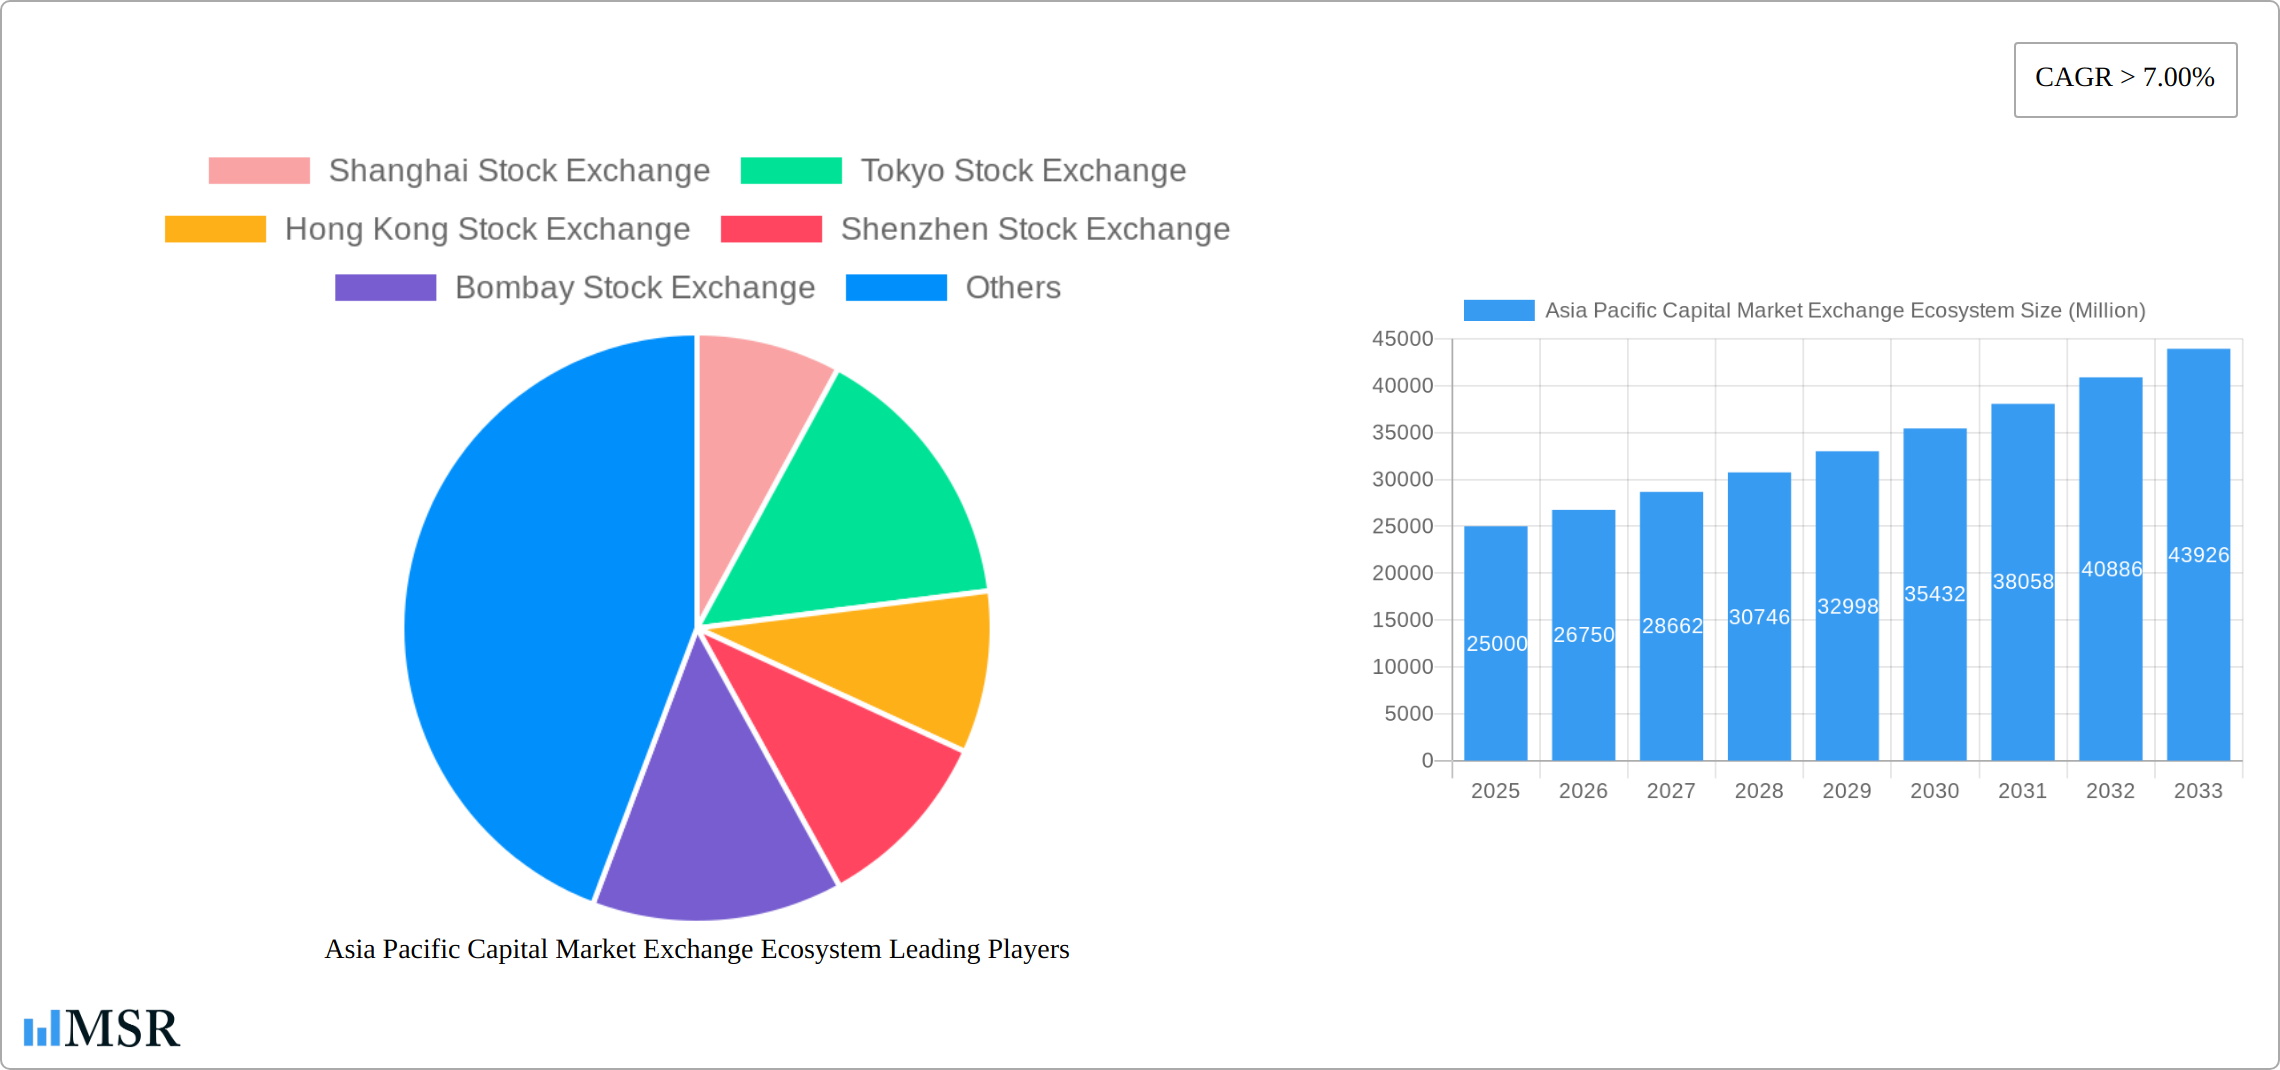
The Asia-Pacific capital market exchange ecosystem is poised for significant expansion, propelled by rising foreign direct investment (FDI), a growing middle class driving retail investment, and favorable government initiatives fostering financial market development. The market is projected to achieve a compound annual growth rate (CAGR) of 5.48% from 2025 to 2033. Key players include major exchanges like the Shanghai, Tokyo, and Hong Kong Stock Exchanges, alongside emerging specialized exchanges in rapidly developing economies. Digitalization and enhanced financial literacy are particularly fueling growth in Southeast Asia. Technological innovations such as algorithmic trading and blockchain are boosting efficiency and transparency, attracting a broader investor base. However, persistent challenges include regulatory variances across jurisdictions, geopolitical instability, and potential market volatility stemming from global economic shifts.
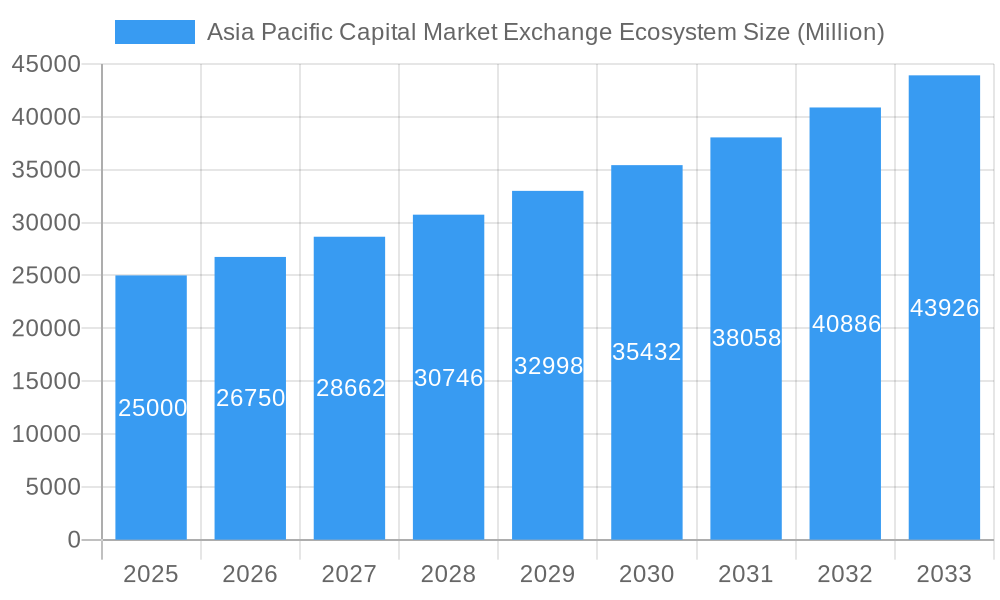
Asia Pacific Capital Market Exchange Ecosystem Market Size (In Million)
For the period leading up to 2033, the Asia-Pacific capital market exchange ecosystem is forecast to sustain its growth trajectory, with a potential moderation in the later years attributed to market maturation and anticipated economic headwinds. Future expansion will be contingent on the continued diversification of investment products, enhancements in market infrastructure, and the pervasive integration of financial technologies. While established exchanges are expected to maintain their prominence, intensified competition will foster innovation and market dynamism. Strategic alliances and mergers will likely occur as exchanges aim to broaden their geographic reach and service portfolios. Harmonizing regional regulations is critical for unlocking further growth potential and bolstering investor confidence.
Asia Pacific Capital Market Exchange Ecosystem Company Market Share
The market size for the Asia-Pacific Capital Market Exchange Ecosystem is estimated at 1120 billion in the base year 2025.
Asia Pacific Capital Market Exchange Ecosystem: A Comprehensive Market Report (2019-2033)
This in-depth report provides a comprehensive analysis of the Asia Pacific Capital Market Exchange Ecosystem, encompassing market dynamics, industry trends, key players, and future growth prospects. The study period covers 2019-2033, with a base year of 2025 and a forecast period of 2025-2033. The report offers actionable insights for investors, stakeholders, and industry professionals seeking to navigate this dynamic landscape. The market size in 2025 is estimated at xx Million, with a CAGR of xx% during the forecast period.
Asia Pacific Capital Market Exchange Ecosystem Market Concentration & Dynamics
The Asia Pacific capital market exchange ecosystem is characterized by a dynamic and evolving landscape, marked by both established powerhouses and rapidly ascending contenders. While a few dominant players currently command significant market share, the region is witnessing increasing fragmentation and the rise of innovative platforms. The Shanghai Stock Exchange, Tokyo Stock Exchange, and Hong Kong Stock Exchange remain pivotal, holding a substantial, though not absolute, combined market share of approximately [Insert Percentage Here]%. However, the vibrant growth of emerging exchanges in India (Bombay Stock Exchange, National Stock Exchange) and across Southeast Asia is fundamentally reshaping market dynamics and challenging the status quo.
Market Concentration Metrics (Illustrative for 2024):
- Top 3 Exchanges Market Share: [Insert Percentage Here]%
- Top 5 Exchanges Market Share: [Insert Percentage Here]%
- Number of M&A deals in the last 5 years: [Insert Number Here]
Key Dynamics Influencing the Ecosystem:
- Innovation Ecosystems: The region is a hotbed for innovation, with significant advancements in trading technologies, disruptive fintech solutions, and forward-thinking regulatory frameworks designed to foster growth and attract investment.
- Regulatory Frameworks: The heterogeneity of regulatory environments across the Asia Pacific presents both strategic opportunities for market entry and expansion, as well as complex challenges requiring nuanced navigation.
- Substitute Products & New Asset Classes: The burgeoning landscape of decentralized finance (DeFi) platforms and the increasing integration of digital assets are presenting significant disruptive forces and potential alternative investment avenues.
- End-User Trends: A notable surge in retail investor participation, coupled with the sophisticated rise of algorithmic and high-frequency trading, is fundamentally reshaping market microstructure and investor behavior.
- M&A Activities & Strategic Alliances: Consolidating forces are evident through strategic mergers, acquisitions, and collaborative ventures, aimed at enhancing operational efficiencies, expanding product offerings, and solidifying competitive advantages.
Asia Pacific Capital Market Exchange Ecosystem Industry Insights & Trends
The Asia Pacific capital market exchange ecosystem is experiencing robust growth, fueled by several key factors. Strong economic growth in several Asian economies, particularly in China and India, has significantly boosted trading volumes and market capitalization. Furthermore, supportive government policies aimed at fostering financial market development and attracting foreign investment have played a pivotal role. Technological advancements, particularly in the fintech sector, are transforming trading processes, enhancing efficiency, and attracting a new generation of investors. The increasing adoption of digital platforms and mobile trading apps has further contributed to the growth of the market. However, geopolitical uncertainties and macroeconomic headwinds pose potential challenges.
Key Markets & Segments Leading Asia Pacific Capital Market Exchange Ecosystem
China and Japan continue to be the twin engines driving the Asia Pacific capital market exchange ecosystem, contributing a substantial portion of overall trading volume and market capitalization. However, the growth trajectory of other key markets is rapidly accelerating, signifying a more diversified and competitive future.
China's Enduring Influence:
- Key Drivers: Sustained rapid economic expansion, proactive government policies championing financial market development, and the sheer scale of its domestic market are primary accelerators.
- Key Exchanges: The Shanghai Stock Exchange and Shenzhen Stock Exchange are paramount. The strategic integration of Shenzhen Stock Exchange's main board with its SME board in February 2022 has further optimized its operational structure and market reach.
Japan's Established Strength:
- Key Drivers: A mature and sophisticated financial market infrastructure, robust corporate governance standards, and a deep reservoir of institutional investors underpin its enduring significance.
- Key Exchange: The Tokyo Stock Exchange remains a central pillar of the region's financial landscape.
Rising Stars and Strategic Hubs:
- Hong Kong: Continues to shine as a premier international financial hub, strategically positioned as a crucial gateway for capital flows between mainland China and the global markets.
- India: Fueled by robust economic expansion and a rapidly growing, increasingly affluent middle class, India's capital markets are experiencing unprecedented growth. The Bombay Stock Exchange and National Stock Exchange are at the forefront of this expansion.
- Other Significant Contributors: The Korea Exchange, Taiwan Stock Exchange, Singapore Exchange, and The Stock Exchange of Thailand are all playing increasingly vital roles in regional market liquidity, innovation, and investor access.
Asia Pacific Capital Market Exchange Ecosystem Product Developments
The Asia Pacific capital market exchange ecosystem is undergoing a profound transformation driven by relentless innovation in trading technologies. Advanced high-frequency trading platforms, sophisticated algorithmic trading systems, and cutting-edge risk management tools are no longer exceptions but the standard. The strategic integration of Artificial Intelligence (AI) and Machine Learning (ML) is elevating trading efficiency to new heights, providing investors with deeper, actionable insights. Furthermore, blockchain technology is emerging as a pivotal force, promising enhanced transparency, improved security, and novel avenues for digital asset settlement. These technological leaps are intensifying competition, compelling exchanges to embrace continuous adaptation and innovation to secure and expand their market positions.
Challenges in the Asia Pacific Capital Market Exchange Ecosystem Market
The Asia Pacific capital market exchange ecosystem faces several challenges. Regulatory inconsistencies across different jurisdictions create complexities for cross-border investments. Cybersecurity threats and data privacy concerns represent significant risks. Intense competition among exchanges, both domestically and internationally, necessitates continuous investment in technology and infrastructure. The impact of these challenges on overall market growth is estimated at xx Million annually.
Forces Driving Asia Pacific Capital Market Exchange Ecosystem Growth
A confluence of powerful forces is propelling the Asia Pacific capital market exchange ecosystem forward. Transformative technological advancements, including the widespread adoption of AI and blockchain, are significantly boosting efficiency and broadening investor appeal. Robust economic growth across numerous Asian economies is generating substantial demand for capital, thereby stimulating market activity. Proactive government initiatives aimed at liberalizing and developing financial markets are fostering a more favorable and supportive regulatory environment. These synergistic factors are collectively poised to drive sustained and significant market expansion in the foreseeable future.
Long-Term Growth Catalysts in the Asia Pacific Capital Market Exchange Ecosystem
Long-term growth in this sector will be driven by continued technological innovation, strategic partnerships between exchanges and fintech companies, and expansion into new markets. Increased integration of capital markets across the region, and the rise of ESG investing will also play a crucial role.
Emerging Opportunities in Asia Pacific Capital Market Exchange Ecosystem
The Asia Pacific capital market exchange ecosystem is ripe with emerging opportunities that promise substantial growth and diversification. The rapidly evolving landscape of digital assets and cryptocurrencies presents a groundbreaking frontier for innovation and investment. Simultaneously, the increasing prominence of Islamic finance principles and the global push for sustainable finance initiatives are opening up significant new avenues for capital allocation and product development. Moreover, the escalating demand for sophisticated risk management frameworks and advanced analytics solutions is creating a fertile ground for specialized service providers and innovative market participants.
Leading Players in the Asia Pacific Capital Market Exchange Ecosystem Sector
Key Milestones in Asia Pacific Capital Market Exchange Ecosystem Industry
- July 2022: Eligible companies listed on the Beijing Stock Exchange were allowed to transfer to the Star Market of the Shanghai Stock Exchange, signifying increased integration within China's capital markets.
- February 2022: The China Securities Regulatory Commission (CSRC) approved the merger of Shenzhen Stock Exchange's main board with the SME board, streamlining the market structure.
Strategic Outlook for Asia Pacific Capital Market Exchange Ecosystem Market
The Asia Pacific capital market exchange ecosystem is poised for continued growth, driven by technological innovation, economic expansion, and supportive government policies. Strategic partnerships, diversification of product offerings, and expansion into new markets will be critical for success in this competitive landscape. The long-term potential is substantial, with significant opportunities for investors and market participants.
Asia Pacific Capital Market Exchange Ecosystem Segmentation
-
1. Type of Market
- 1.1. Primary Market
- 1.2. Secondary Market
-
2. Financial Product
- 2.1. Debt
- 2.2. Equity
-
3. Investors
- 3.1. Retail Investors
- 3.2. Institutional Investors
Asia Pacific Capital Market Exchange Ecosystem Segmentation By Geography
-
1. Asia Pacific
- 1.1. China
- 1.2. Japan
- 1.3. South Korea
- 1.4. India
- 1.5. Australia
- 1.6. New Zealand
- 1.7. Indonesia
- 1.8. Malaysia
- 1.9. Singapore
- 1.10. Thailand
- 1.11. Vietnam
- 1.12. Philippines
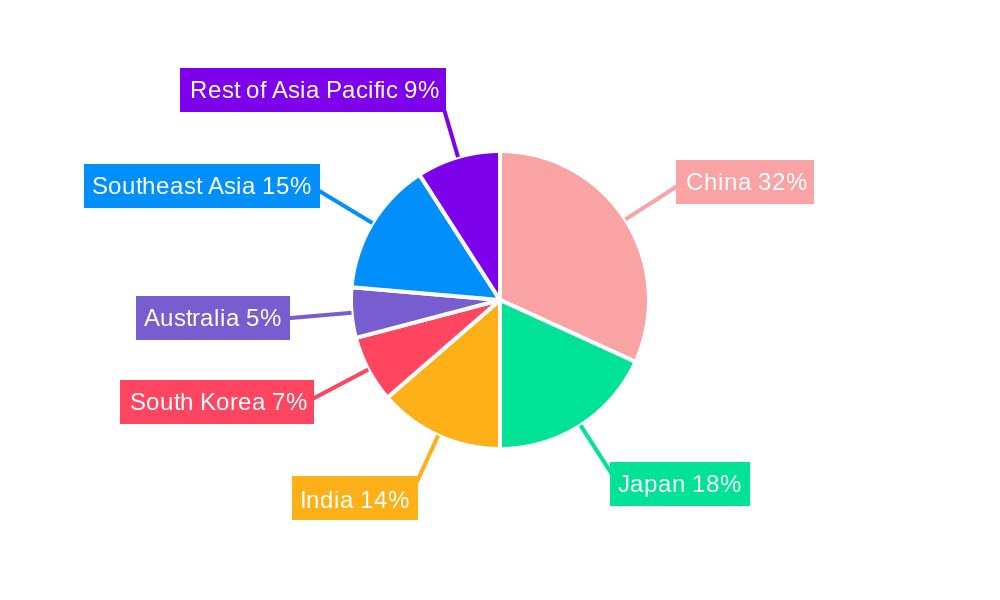
Asia Pacific Capital Market Exchange Ecosystem Regional Market Share
Geographic Coverage of Asia Pacific Capital Market Exchange Ecosystem
Asia Pacific Capital Market Exchange Ecosystem REPORT HIGHLIGHTS
| Aspects | Details |
|---|---|
| Study Period | 2020-2034 |
| Base Year | 2025 |
| Estimated Year | 2026 |
| Forecast Period | 2026-2034 |
| Historical Period | 2020-2025 |
| Growth Rate | CAGR of 5.48% from 2020-2034 |
| Segmentation |
|
Table of Contents
- 1. Introduction
- 1.1. Research Scope
- 1.2. Market Segmentation
- 1.3. Research Objective
- 1.4. Definitions and Assumptions
- 2. Executive Summary
- 2.1. Market Snapshot
- 3. Market Dynamics
- 3.1. Market Drivers
- 3.2. Market Restrains
- 3.3. Market Trends
- 3.4. Market Opportunities
- 4. Market Factor Analysis
- 4.1. Porters Five Forces
- 4.1.1. Bargaining Power of Suppliers
- 4.1.2. Bargaining Power of Buyers
- 4.1.3. Threat of New Entrants
- 4.1.4. Threat of Substitutes
- 4.1.5. Competitive Rivalry
- 4.2. PESTEL analysis
- 4.3. BCG Analysis
- 4.3.1. Stars (High Growth, High Market Share)
- 4.3.2. Cash Cows (Low Growth, High Market Share)
- 4.3.3. Question Mark (High Growth, Low Market Share)
- 4.3.4. Dogs (Low Growth, Low Market Share)
- 4.4. Ansoff Matrix Analysis
- 4.5. Supply Chain Analysis
- 4.6. Regulatory Landscape
- 4.7. Current Market Potential and Opportunity Assessment (TAM–SAM–SOM Framework)
- 4.8. MSR Analyst Note
- 4.1. Porters Five Forces
- 5. Market Analysis, Insights and Forecast 2021-2033
- 5.1. Market Analysis, Insights and Forecast - by Type of Market
- 5.1.1. Primary Market
- 5.1.2. Secondary Market
- 5.2. Market Analysis, Insights and Forecast - by Financial Product
- 5.2.1. Debt
- 5.2.2. Equity
- 5.3. Market Analysis, Insights and Forecast - by Investors
- 5.3.1. Retail Investors
- 5.3.2. Institutional Investors
- 5.4. Market Analysis, Insights and Forecast - by Region
- 5.4.1. Asia Pacific
- 5.1. Market Analysis, Insights and Forecast - by Type of Market
- 6. Asia Pacific Capital Market Exchange Ecosystem Analysis, Insights and Forecast, 2021-2033
- 6.1. Market Analysis, Insights and Forecast - by Type of Market
- 6.1.1. Primary Market
- 6.1.2. Secondary Market
- 6.2. Market Analysis, Insights and Forecast - by Financial Product
- 6.2.1. Debt
- 6.2.2. Equity
- 6.3. Market Analysis, Insights and Forecast - by Investors
- 6.3.1. Retail Investors
- 6.3.2. Institutional Investors
- 6.1. Market Analysis, Insights and Forecast - by Type of Market
- 7. Competitive Analysis
- 7.1. Company Profiles
- 7.1.1 Shanghai Stock Exchange
- 7.1.1.1. Company Overview
- 7.1.1.2. Products
- 7.1.1.3. Company Financials
- 7.1.1.4. SWOT Analysis
- 7.1.2 Tokyo Stock Exchange
- 7.1.2.1. Company Overview
- 7.1.2.2. Products
- 7.1.2.3. Company Financials
- 7.1.2.4. SWOT Analysis
- 7.1.3 Hong Kong Stock Exchange
- 7.1.3.1. Company Overview
- 7.1.3.2. Products
- 7.1.3.3. Company Financials
- 7.1.3.4. SWOT Analysis
- 7.1.4 Shenzhen Stock Exchange
- 7.1.4.1. Company Overview
- 7.1.4.2. Products
- 7.1.4.3. Company Financials
- 7.1.4.4. SWOT Analysis
- 7.1.5 Bombay Stock Exchange
- 7.1.5.1. Company Overview
- 7.1.5.2. Products
- 7.1.5.3. Company Financials
- 7.1.5.4. SWOT Analysis
- 7.1.6 National Stock Exchange
- 7.1.6.1. Company Overview
- 7.1.6.2. Products
- 7.1.6.3. Company Financials
- 7.1.6.4. SWOT Analysis
- 7.1.7 Korea Exchange
- 7.1.7.1. Company Overview
- 7.1.7.2. Products
- 7.1.7.3. Company Financials
- 7.1.7.4. SWOT Analysis
- 7.1.8 Taiwan Stock Exchange
- 7.1.8.1. Company Overview
- 7.1.8.2. Products
- 7.1.8.3. Company Financials
- 7.1.8.4. SWOT Analysis
- 7.1.9 Singapore Exchange
- 7.1.9.1. Company Overview
- 7.1.9.2. Products
- 7.1.9.3. Company Financials
- 7.1.9.4. SWOT Analysis
- 7.1.10 The Stock Exchange of Thailand**List Not Exhaustive
- 7.1.10.1. Company Overview
- 7.1.10.2. Products
- 7.1.10.3. Company Financials
- 7.1.10.4. SWOT Analysis
- 7.1.1 Shanghai Stock Exchange
- 7.2. Market Entropy
- 7.2.1 Company's Key Areas Served
- 7.2.2 Recent Developments
- 7.3. Company Market Share Analysis 2025
- 7.3.1 Top 5 Companies Market Share Analysis
- 7.3.2 Top 3 Companies Market Share Analysis
- 7.4. List of Potential Customers
- 8. Research Methodology
List of Figures
- Figure 1: Asia Pacific Capital Market Exchange Ecosystem Revenue Breakdown (billion, %) by Product 2025 & 2033
- Figure 2: Asia Pacific Capital Market Exchange Ecosystem Share (%) by Company 2025
List of Tables
- Table 1: Asia Pacific Capital Market Exchange Ecosystem Revenue billion Forecast, by Type of Market 2020 & 2033
- Table 2: Asia Pacific Capital Market Exchange Ecosystem Revenue billion Forecast, by Financial Product 2020 & 2033
- Table 3: Asia Pacific Capital Market Exchange Ecosystem Revenue billion Forecast, by Investors 2020 & 2033
- Table 4: Asia Pacific Capital Market Exchange Ecosystem Revenue billion Forecast, by Region 2020 & 2033
- Table 5: Asia Pacific Capital Market Exchange Ecosystem Revenue billion Forecast, by Type of Market 2020 & 2033
- Table 6: Asia Pacific Capital Market Exchange Ecosystem Revenue billion Forecast, by Financial Product 2020 & 2033
- Table 7: Asia Pacific Capital Market Exchange Ecosystem Revenue billion Forecast, by Investors 2020 & 2033
- Table 8: Asia Pacific Capital Market Exchange Ecosystem Revenue billion Forecast, by Country 2020 & 2033
- Table 9: China Asia Pacific Capital Market Exchange Ecosystem Revenue (billion) Forecast, by Application 2020 & 2033
- Table 10: Japan Asia Pacific Capital Market Exchange Ecosystem Revenue (billion) Forecast, by Application 2020 & 2033
- Table 11: South Korea Asia Pacific Capital Market Exchange Ecosystem Revenue (billion) Forecast, by Application 2020 & 2033
- Table 12: India Asia Pacific Capital Market Exchange Ecosystem Revenue (billion) Forecast, by Application 2020 & 2033
- Table 13: Australia Asia Pacific Capital Market Exchange Ecosystem Revenue (billion) Forecast, by Application 2020 & 2033
- Table 14: New Zealand Asia Pacific Capital Market Exchange Ecosystem Revenue (billion) Forecast, by Application 2020 & 2033
- Table 15: Indonesia Asia Pacific Capital Market Exchange Ecosystem Revenue (billion) Forecast, by Application 2020 & 2033
- Table 16: Malaysia Asia Pacific Capital Market Exchange Ecosystem Revenue (billion) Forecast, by Application 2020 & 2033
- Table 17: Singapore Asia Pacific Capital Market Exchange Ecosystem Revenue (billion) Forecast, by Application 2020 & 2033
- Table 18: Thailand Asia Pacific Capital Market Exchange Ecosystem Revenue (billion) Forecast, by Application 2020 & 2033
- Table 19: Vietnam Asia Pacific Capital Market Exchange Ecosystem Revenue (billion) Forecast, by Application 2020 & 2033
- Table 20: Philippines Asia Pacific Capital Market Exchange Ecosystem Revenue (billion) Forecast, by Application 2020 & 2033
Frequently Asked Questions
1. What is the projected Compound Annual Growth Rate (CAGR) of the Asia Pacific Capital Market Exchange Ecosystem?
The projected CAGR is approximately 5.48%.
2. Which companies are prominent players in the Asia Pacific Capital Market Exchange Ecosystem?
Key companies in the market include Shanghai Stock Exchange, Tokyo Stock Exchange, Hong Kong Stock Exchange, Shenzhen Stock Exchange, Bombay Stock Exchange, National Stock Exchange, Korea Exchange, Taiwan Stock Exchange, Singapore Exchange, The Stock Exchange of Thailand**List Not Exhaustive.
3. What are the main segments of the Asia Pacific Capital Market Exchange Ecosystem?
The market segments include Type of Market, Financial Product, Investors.
4. Can you provide details about the market size?
The market size is estimated to be USD 1120 billion as of 2022.
5. What are some drivers contributing to market growth?
N/A
6. What are the notable trends driving market growth?
Increasing Foreign Direct Investment in Various Developing Economies in Asia-Pacific.
7. Are there any restraints impacting market growth?
N/A
8. Can you provide examples of recent developments in the market?
July 2022: The eligible companies listed on Beijing Stock Exchange were allowed to apply for transfer to the Star Market of the Shanghai Stock Exchange. A transfer system is a positive approach for bridge-building efforts between China's multiple layers of the capital market.
9. What pricing options are available for accessing the report?
Pricing options include single-user, multi-user, and enterprise licenses priced at USD 3800, USD 4500, and USD 5800 respectively.
10. Is the market size provided in terms of value or volume?
The market size is provided in terms of value, measured in billion.
11. Are there any specific market keywords associated with the report?
Yes, the market keyword associated with the report is "Asia Pacific Capital Market Exchange Ecosystem," which aids in identifying and referencing the specific market segment covered.
12. How do I determine which pricing option suits my needs best?
The pricing options vary based on user requirements and access needs. Individual users may opt for single-user licenses, while businesses requiring broader access may choose multi-user or enterprise licenses for cost-effective access to the report.
13. Are there any additional resources or data provided in the Asia Pacific Capital Market Exchange Ecosystem report?
While the report offers comprehensive insights, it's advisable to review the specific contents or supplementary materials provided to ascertain if additional resources or data are available.
14. How can I stay updated on further developments or reports in the Asia Pacific Capital Market Exchange Ecosystem?
To stay informed about further developments, trends, and reports in the Asia Pacific Capital Market Exchange Ecosystem, consider subscribing to industry newsletters, following relevant companies and organizations, or regularly checking reputable industry news sources and publications.
Methodology
Step 1 - Identification of Relevant Samples Size from Population Database


Step 2 - Approaches for Defining Global Market Size (Value, Volume* & Price*)

Note*: In applicable scenarios
Step 3 - Data Sources
Primary Research
- Web Analytics
- Survey Reports
- Research Institute
- Latest Research Reports
- Opinion Leaders
Secondary Research
- Annual Reports
- White Paper
- Latest Press Release
- Industry Association
- Paid Database
- Investor Presentations

Step 4 - Data Triangulation
Involves using different sources of information in order to increase the validity of a study
These sources are likely to be stakeholders in a program - participants, other researchers, program staff, other community members, and so on.
Then we put all data in single framework & apply various statistical tools to find out the dynamic on the market.
During the analysis stage, feedback from the stakeholder groups would be compared to determine areas of agreement as well as areas of divergence