

Key Insights
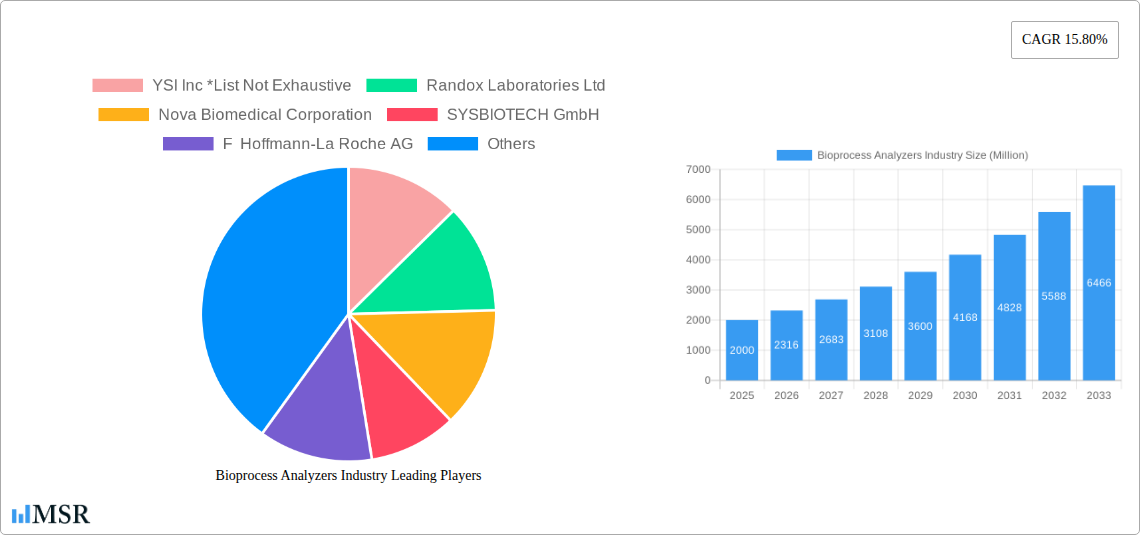
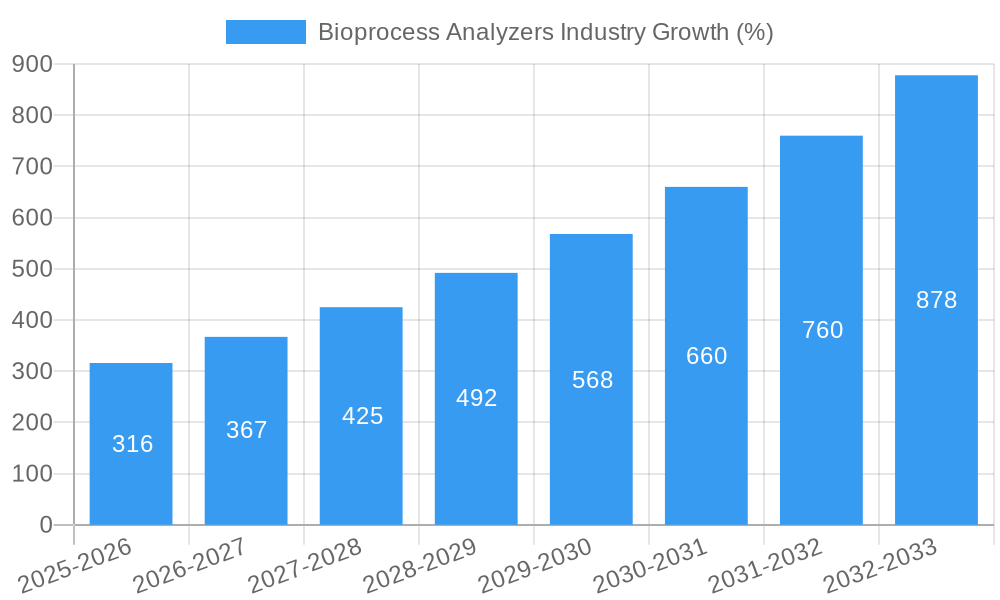
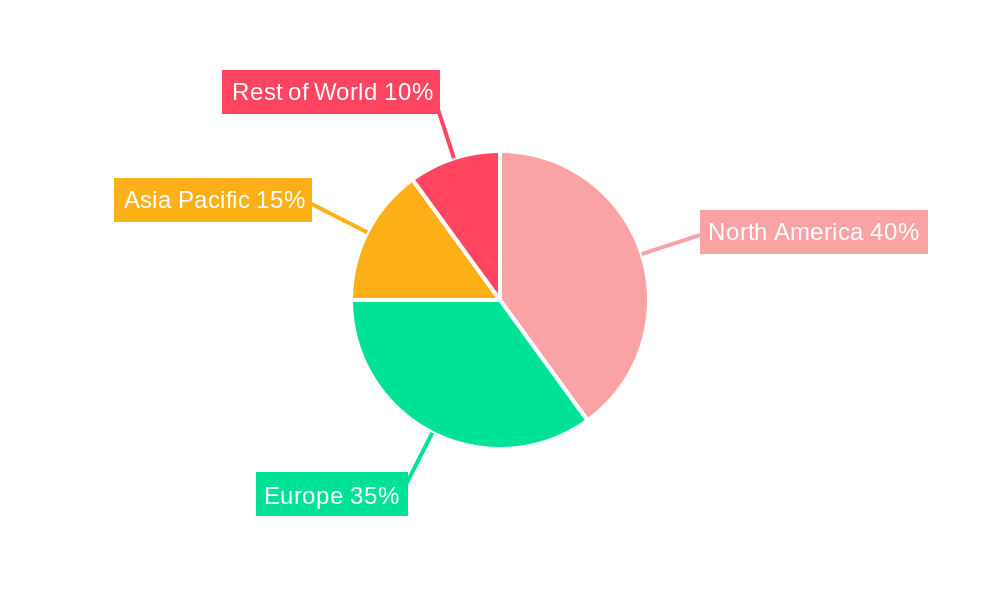
The bioprocess analyzers market, valued at $2.00 billion in 2025, is projected to experience robust growth, driven by the increasing demand for biopharmaceuticals, advancements in bioprocessing technologies, and stringent regulatory requirements for quality control. The market's Compound Annual Growth Rate (CAGR) of 15.80% from 2025 to 2033 indicates significant expansion opportunities. Key drivers include the rising prevalence of chronic diseases necessitating innovative therapies, the growing adoption of continuous manufacturing processes in biopharmaceutical production, and the increasing investment in research and development activities aimed at improving bioprocessing efficiency and yield. The market segmentation highlights the significant contribution of instruments and consumables, with applications spanning antibiotics, recombinant proteins, and biosimilars. Substrate analysis, metabolite analysis, and concentration detection represent the core analytical techniques within the market. North America and Europe currently hold substantial market share, reflecting the established biopharmaceutical industries in these regions, however, the Asia-Pacific region is expected to witness the fastest growth due to increasing investments in biotechnology and pharmaceutical infrastructure.
Competition is intense, with major players such as Thermo Fisher Scientific, Agilent Technologies, and Roche actively engaged in product innovation and strategic partnerships to maintain their market position. The emergence of smaller, specialized companies focusing on niche applications presents both opportunities and challenges. Factors such as the high cost of instruments, stringent regulatory hurdles, and the complexity of bioprocess analysis could potentially restrain market growth. However, the continuous development of advanced, miniaturized, and user-friendly bioprocess analyzers, coupled with the increasing adoption of automation and data analytics, is expected to mitigate these challenges and accelerate market expansion throughout the forecast period. The focus on faster, more precise, and cost-effective analytical solutions will continue to shape market dynamics in the coming years.
Bioprocess Analyzers Industry Market Report: 2019-2033
This comprehensive report provides a detailed analysis of the Bioprocess Analyzers industry, offering invaluable insights for stakeholders, investors, and industry professionals. The study period covers 2019-2033, with 2025 as the base and estimated year. The report forecasts market trends from 2025-2033, leveraging data from the historical period (2019-2024). The global market is expected to reach xx Million by 2033, exhibiting a CAGR of xx% during the forecast period. Key players analyzed include YSI Inc, Randox Laboratories Ltd, Nova Biomedical Corporation, SYSBIOTECH GmbH, F Hoffmann-La Roche AG, 4BioCell GmbH & Co KG, Sartorius AG, Kaiser Optical Systems Inc, Groton Biosystems, Thermo Fisher Scientific, and Agilent Technologies.
Bioprocess Analyzers Industry Market Concentration & Dynamics
The Bioprocess Analyzers market exhibits a moderately concentrated landscape, with a few major players holding significant market share. However, the presence of numerous smaller companies, particularly in niche segments, fosters competition and innovation. The market is characterized by strong R&D investments, leading to continuous technological advancements in instrumentation and consumables. Regulatory frameworks, particularly concerning GMP (Good Manufacturing Practices) and safety standards, play a crucial role in shaping industry dynamics. Substitute products, although limited, exist in certain applications, influencing market penetration. End-user trends are leaning towards automation, real-time monitoring, and data analytics integration for improved process efficiency. M&A activities have been relatively moderate in recent years, with approximately xx deals recorded between 2019 and 2024, contributing to market consolidation.
- Market Share: Top 5 players hold approximately xx% of the market share.
- M&A Activity: An average of xx M&A deals per year were observed between 2019 and 2024.
- Innovation Ecosystem: Robust R&D investment drives the introduction of advanced analytical technologies.
- Regulatory Landscape: Stringent GMP and safety regulations influence product development and adoption.
Bioprocess Analyzers Industry Insights & Trends
The Bioprocess Analyzers market is experiencing robust growth driven by several factors. The increasing demand for biopharmaceuticals, including biologics, vaccines, and cell therapies, fuels the need for sophisticated analytical tools. Technological advancements, such as miniaturization, automation, and advanced data analytics, enhance efficiency and accuracy in bioprocessing. Evolving consumer behavior emphasizes the need for faster turnaround times, cost-effectiveness, and real-time process monitoring. The market size in 2024 was estimated at xx Million, and is projected to reach xx Million by 2025, showcasing significant growth potential. This growth is further fueled by rising investments in R&D and increasing adoption of advanced bioprocessing techniques across various industries.
Key Markets & Segments Leading Bioprocess Analyzers Industry
North America currently dominates the Bioprocess Analyzers market, driven by robust pharmaceutical and biotechnology industries. Within the segments:
By Product: Instruments represent the larger segment, followed by consumables. The high demand for advanced analytical instrumentation drives this disparity.
By Application: Recombinant proteins and biosimilars constitute major application segments, fueled by the rising demand for these therapeutic products.
By Type: Substrate analysis, metabolite analysis, and concentration detection are all significant types with distinct requirements and applications.
Drivers for Dominance:
- North America: Strong pharmaceutical and biotechnology infrastructure, high R&D investments, and stringent regulatory frameworks.
- Europe: Significant presence of pharmaceutical companies and a well-established bioprocessing industry.
- Asia-Pacific: Rapid economic growth, rising healthcare spending, and increasing investments in biopharmaceutical manufacturing.
Bioprocess Analyzers Industry Product Developments
Recent years have witnessed significant advancements in bioprocess analyzers, including the development of miniaturized, portable devices, advanced sensors, and integrated data analysis software. These innovations enhance speed, accuracy, and ease of use while providing real-time insights into bioprocessing parameters. This translates to improved process control, reduced costs, and accelerated product development timelines, giving manufacturers a competitive advantage in the market.
Challenges in the Bioprocess Analyzers Industry Market
The Bioprocess Analyzers market faces several challenges, including stringent regulatory approvals, supply chain complexities (particularly for specialized components), and intense competition from established players and emerging market entrants. These hurdles impact market entry, pricing strategies, and overall industry profitability. Estimated annual losses due to supply chain disruptions are around xx Million.
Forces Driving Bioprocess Analyzers Industry Growth
Technological advancements (automation, miniaturization, AI integration), the increasing demand for biopharmaceuticals, and supportive regulatory frameworks are major growth drivers. For example, the increasing adoption of single-use technologies is creating new opportunities for bioprocess analyzers tailored to these systems.
Challenges in the Bioprocess Analyzers Industry Market
Long-term growth will be fueled by strategic partnerships, innovative product development (e.g., point-of-care diagnostics), expansion into emerging markets (e.g., Asia-Pacific), and ongoing development of advanced analytical techniques like mass spectrometry and chromatography.
Emerging Opportunities in Bioprocess Analyzers Industry
Emerging opportunities include the development of advanced analytical platforms for cell and gene therapy, personalized medicine, and the growing field of continuous bioprocessing. The integration of AI and machine learning for predictive modeling and process optimization is also a significant emerging area.
Leading Players in the Bioprocess Analyzers Industry Sector
- YSI Inc
- Randox Laboratories Ltd
- Nova Biomedical Corporation
- SYSBIOTECH GmbH
- F Hoffmann-La Roche AG
- 4BioCell GmbH & Co KG
- Sartorius AG
- Kaiser Optical Systems Inc
- Groton Biosystems
- Thermo Fisher Scientific
- Agilent Technologies
Key Milestones in Bioprocess Analyzers Industry Industry
- August 2022: Beckman Coulter Life Sciences partnered with Flownamics to create an automated online solution for bioprocess monitoring, improving efficiency and data acquisition.
- February 2022: Dow, Sartorius, and Südpack Medica collaborated to produce bioprocessing bags essential for COVID-19 vaccine production, highlighting industry collaboration and supply chain focus.
Strategic Outlook for Bioprocess Analyzers Industry Market
The Bioprocess Analyzers market holds significant potential for growth, driven by technological innovation, rising biopharmaceutical demand, and strategic partnerships. Companies focusing on developing advanced, integrated analytical platforms and catering to the evolving needs of bioprocessing will be well-positioned to capitalize on future opportunities and achieve sustained market leadership.
Bioprocess Analyzers Industry Segmentation
-
1. Product
- 1.1. Instruments
- 1.2. Consumables
-
2. Application
- 2.1. Antibiotics
- 2.2. Recombinant Proteins
- 2.3. Biosimilars
- 2.4. Other Applications
-
3. Type
- 3.1. Substrate Analysis
- 3.2. Metabolite Analysis
- 3.3. Concentration Detection
Bioprocess Analyzers Industry Segmentation By Geography
-
1. North America
- 1.1. United States
- 1.2. Canada
- 1.3. Mexico
-
2. Europe
- 2.1. Germany
- 2.2. United Kingdom
- 2.3. France
- 2.4. Italy
- 2.5. Spain
- 2.6. Rest of Europe
-
3. Asia Pacific
- 3.1. China
- 3.2. Japan
- 3.3. India
- 3.4. Australia
- 3.5. South Korea
- 3.6. Rest of Asia Pacific
-
4. Middle East and Africa
- 4.1. GCC
- 4.2. South Africa
- 4.3. Rest of Middle East and Africa
-
5. South America
- 5.1. Brazil
- 5.2. Argentina
- 5.3. Rest of South America
Bioprocess Analyzers Industry REPORT HIGHLIGHTS
| Aspects | Details |
|---|---|
| Study Period | 2019-2033 |
| Base Year | 2024 |
| Estimated Year | 2025 |
| Forecast Period | 2025-2033 |
| Historical Period | 2019-2024 |
| Growth Rate | CAGR of 15.80% from 2019-2033 |
| Segmentation |
|
Table of Contents
- 1. Introduction
- 1.1. Research Scope
- 1.2. Market Segmentation
- 1.3. Research Methodology
- 1.4. Definitions and Assumptions
- 2. Executive Summary
- 2.1. Introduction
- 3. Market Dynamics
- 3.1. Introduction
- 3.2. Market Drivers
- 3.2.1. Growing Interest in the Development of Advanced Medicines and Vaccines; Increasing Demand for Biologics
- 3.3. Market Restrains
- 3.3.1. Complexity of Upstream and Downstream Processing and Strict Regulations; High Cost of Raw Materials
- 3.4. Market Trends
- 3.4.1. Recombinant Protein Segment is Expected to Hold a Significant Market Share over the Forecast Period
- 4. Market Factor Analysis
- 4.1. Porters Five Forces
- 4.2. Supply/Value Chain
- 4.3. PESTEL analysis
- 4.4. Market Entropy
- 4.5. Patent/Trademark Analysis
- 5. Global Bioprocess Analyzers Industry Analysis, Insights and Forecast, 2019-2031
- 5.1. Market Analysis, Insights and Forecast - by Product
- 5.1.1. Instruments
- 5.1.2. Consumables
- 5.2. Market Analysis, Insights and Forecast - by Application
- 5.2.1. Antibiotics
- 5.2.2. Recombinant Proteins
- 5.2.3. Biosimilars
- 5.2.4. Other Applications
- 5.3. Market Analysis, Insights and Forecast - by Type
- 5.3.1. Substrate Analysis
- 5.3.2. Metabolite Analysis
- 5.3.3. Concentration Detection
- 5.4. Market Analysis, Insights and Forecast - by Region
- 5.4.1. North America
- 5.4.2. Europe
- 5.4.3. Asia Pacific
- 5.4.4. Middle East and Africa
- 5.4.5. South America
- 5.1. Market Analysis, Insights and Forecast - by Product
- 6. North America Bioprocess Analyzers Industry Analysis, Insights and Forecast, 2019-2031
- 6.1. Market Analysis, Insights and Forecast - by Product
- 6.1.1. Instruments
- 6.1.2. Consumables
- 6.2. Market Analysis, Insights and Forecast - by Application
- 6.2.1. Antibiotics
- 6.2.2. Recombinant Proteins
- 6.2.3. Biosimilars
- 6.2.4. Other Applications
- 6.3. Market Analysis, Insights and Forecast - by Type
- 6.3.1. Substrate Analysis
- 6.3.2. Metabolite Analysis
- 6.3.3. Concentration Detection
- 6.1. Market Analysis, Insights and Forecast - by Product
- 7. Europe Bioprocess Analyzers Industry Analysis, Insights and Forecast, 2019-2031
- 7.1. Market Analysis, Insights and Forecast - by Product
- 7.1.1. Instruments
- 7.1.2. Consumables
- 7.2. Market Analysis, Insights and Forecast - by Application
- 7.2.1. Antibiotics
- 7.2.2. Recombinant Proteins
- 7.2.3. Biosimilars
- 7.2.4. Other Applications
- 7.3. Market Analysis, Insights and Forecast - by Type
- 7.3.1. Substrate Analysis
- 7.3.2. Metabolite Analysis
- 7.3.3. Concentration Detection
- 7.1. Market Analysis, Insights and Forecast - by Product
- 8. Asia Pacific Bioprocess Analyzers Industry Analysis, Insights and Forecast, 2019-2031
- 8.1. Market Analysis, Insights and Forecast - by Product
- 8.1.1. Instruments
- 8.1.2. Consumables
- 8.2. Market Analysis, Insights and Forecast - by Application
- 8.2.1. Antibiotics
- 8.2.2. Recombinant Proteins
- 8.2.3. Biosimilars
- 8.2.4. Other Applications
- 8.3. Market Analysis, Insights and Forecast - by Type
- 8.3.1. Substrate Analysis
- 8.3.2. Metabolite Analysis
- 8.3.3. Concentration Detection
- 8.1. Market Analysis, Insights and Forecast - by Product
- 9. Middle East and Africa Bioprocess Analyzers Industry Analysis, Insights and Forecast, 2019-2031
- 9.1. Market Analysis, Insights and Forecast - by Product
- 9.1.1. Instruments
- 9.1.2. Consumables
- 9.2. Market Analysis, Insights and Forecast - by Application
- 9.2.1. Antibiotics
- 9.2.2. Recombinant Proteins
- 9.2.3. Biosimilars
- 9.2.4. Other Applications
- 9.3. Market Analysis, Insights and Forecast - by Type
- 9.3.1. Substrate Analysis
- 9.3.2. Metabolite Analysis
- 9.3.3. Concentration Detection
- 9.1. Market Analysis, Insights and Forecast - by Product
- 10. South America Bioprocess Analyzers Industry Analysis, Insights and Forecast, 2019-2031
- 10.1. Market Analysis, Insights and Forecast - by Product
- 10.1.1. Instruments
- 10.1.2. Consumables
- 10.2. Market Analysis, Insights and Forecast - by Application
- 10.2.1. Antibiotics
- 10.2.2. Recombinant Proteins
- 10.2.3. Biosimilars
- 10.2.4. Other Applications
- 10.3. Market Analysis, Insights and Forecast - by Type
- 10.3.1. Substrate Analysis
- 10.3.2. Metabolite Analysis
- 10.3.3. Concentration Detection
- 10.1. Market Analysis, Insights and Forecast - by Product
- 11. North America Bioprocess Analyzers Industry Analysis, Insights and Forecast, 2019-2031
- 11.1. Market Analysis, Insights and Forecast - By Country/Sub-region
- 11.1.1 United States
- 11.1.2 Canada
- 11.1.3 Mexico
- 12. South America Bioprocess Analyzers Industry Analysis, Insights and Forecast, 2019-2031
- 12.1. Market Analysis, Insights and Forecast - By Country/Sub-region
- 12.1.1 Brazil
- 12.1.2 Mexico
- 12.1.3 Rest of South America
- 13. Europe Bioprocess Analyzers Industry Analysis, Insights and Forecast, 2019-2031
- 13.1. Market Analysis, Insights and Forecast - By Country/Sub-region
- 13.1.1 United Kingdom
- 13.1.2 Germany
- 13.1.3 France
- 13.1.4 Italy
- 13.1.5 Spain
- 13.1.6 Russia
- 13.1.7 Rest of Europe
- 14. Asia Pacific Bioprocess Analyzers Industry Analysis, Insights and Forecast, 2019-2031
- 14.1. Market Analysis, Insights and Forecast - By Country/Sub-region
- 14.1.1 China
- 14.1.2 Japan
- 14.1.3 India
- 14.1.4 South Korea
- 14.1.5 Taiwan
- 14.1.6 Australia
- 14.1.7 Rest of Asia-Pacific
- 15. MEA Bioprocess Analyzers Industry Analysis, Insights and Forecast, 2019-2031
- 15.1. Market Analysis, Insights and Forecast - By Country/Sub-region
- 15.1.1 Middle East
- 15.1.2 Africa
- 16. Competitive Analysis
- 16.1. Global Market Share Analysis 2024
- 16.2. Company Profiles
- 16.2.1 YSI Inc *List Not Exhaustive
- 16.2.1.1. Overview
- 16.2.1.2. Products
- 16.2.1.3. SWOT Analysis
- 16.2.1.4. Recent Developments
- 16.2.1.5. Financials (Based on Availability)
- 16.2.2 Randox Laboratories Ltd
- 16.2.2.1. Overview
- 16.2.2.2. Products
- 16.2.2.3. SWOT Analysis
- 16.2.2.4. Recent Developments
- 16.2.2.5. Financials (Based on Availability)
- 16.2.3 Nova Biomedical Corporation
- 16.2.3.1. Overview
- 16.2.3.2. Products
- 16.2.3.3. SWOT Analysis
- 16.2.3.4. Recent Developments
- 16.2.3.5. Financials (Based on Availability)
- 16.2.4 SYSBIOTECH GmbH
- 16.2.4.1. Overview
- 16.2.4.2. Products
- 16.2.4.3. SWOT Analysis
- 16.2.4.4. Recent Developments
- 16.2.4.5. Financials (Based on Availability)
- 16.2.5 F Hoffmann-La Roche AG
- 16.2.5.1. Overview
- 16.2.5.2. Products
- 16.2.5.3. SWOT Analysis
- 16.2.5.4. Recent Developments
- 16.2.5.5. Financials (Based on Availability)
- 16.2.6 4BioCell GmbH & Co KG
- 16.2.6.1. Overview
- 16.2.6.2. Products
- 16.2.6.3. SWOT Analysis
- 16.2.6.4. Recent Developments
- 16.2.6.5. Financials (Based on Availability)
- 16.2.7 Sartorious AG
- 16.2.7.1. Overview
- 16.2.7.2. Products
- 16.2.7.3. SWOT Analysis
- 16.2.7.4. Recent Developments
- 16.2.7.5. Financials (Based on Availability)
- 16.2.8 Kaiser Optical Systems Inc
- 16.2.8.1. Overview
- 16.2.8.2. Products
- 16.2.8.3. SWOT Analysis
- 16.2.8.4. Recent Developments
- 16.2.8.5. Financials (Based on Availability)
- 16.2.9 Groton Biosystems
- 16.2.9.1. Overview
- 16.2.9.2. Products
- 16.2.9.3. SWOT Analysis
- 16.2.9.4. Recent Developments
- 16.2.9.5. Financials (Based on Availability)
- 16.2.10 Thermo Fisher Scientific
- 16.2.10.1. Overview
- 16.2.10.2. Products
- 16.2.10.3. SWOT Analysis
- 16.2.10.4. Recent Developments
- 16.2.10.5. Financials (Based on Availability)
- 16.2.11 Agilent Technologies
- 16.2.11.1. Overview
- 16.2.11.2. Products
- 16.2.11.3. SWOT Analysis
- 16.2.11.4. Recent Developments
- 16.2.11.5. Financials (Based on Availability)
- 16.2.1 YSI Inc *List Not Exhaustive
List of Figures
- Figure 1: Global Bioprocess Analyzers Industry Revenue Breakdown (Million, %) by Region 2024 & 2032
- Figure 2: North America Bioprocess Analyzers Industry Revenue (Million), by Country 2024 & 2032
- Figure 3: North America Bioprocess Analyzers Industry Revenue Share (%), by Country 2024 & 2032
- Figure 4: South America Bioprocess Analyzers Industry Revenue (Million), by Country 2024 & 2032
- Figure 5: South America Bioprocess Analyzers Industry Revenue Share (%), by Country 2024 & 2032
- Figure 6: Europe Bioprocess Analyzers Industry Revenue (Million), by Country 2024 & 2032
- Figure 7: Europe Bioprocess Analyzers Industry Revenue Share (%), by Country 2024 & 2032
- Figure 8: Asia Pacific Bioprocess Analyzers Industry Revenue (Million), by Country 2024 & 2032
- Figure 9: Asia Pacific Bioprocess Analyzers Industry Revenue Share (%), by Country 2024 & 2032
- Figure 10: MEA Bioprocess Analyzers Industry Revenue (Million), by Country 2024 & 2032
- Figure 11: MEA Bioprocess Analyzers Industry Revenue Share (%), by Country 2024 & 2032
- Figure 12: North America Bioprocess Analyzers Industry Revenue (Million), by Product 2024 & 2032
- Figure 13: North America Bioprocess Analyzers Industry Revenue Share (%), by Product 2024 & 2032
- Figure 14: North America Bioprocess Analyzers Industry Revenue (Million), by Application 2024 & 2032
- Figure 15: North America Bioprocess Analyzers Industry Revenue Share (%), by Application 2024 & 2032
- Figure 16: North America Bioprocess Analyzers Industry Revenue (Million), by Type 2024 & 2032
- Figure 17: North America Bioprocess Analyzers Industry Revenue Share (%), by Type 2024 & 2032
- Figure 18: North America Bioprocess Analyzers Industry Revenue (Million), by Country 2024 & 2032
- Figure 19: North America Bioprocess Analyzers Industry Revenue Share (%), by Country 2024 & 2032
- Figure 20: Europe Bioprocess Analyzers Industry Revenue (Million), by Product 2024 & 2032
- Figure 21: Europe Bioprocess Analyzers Industry Revenue Share (%), by Product 2024 & 2032
- Figure 22: Europe Bioprocess Analyzers Industry Revenue (Million), by Application 2024 & 2032
- Figure 23: Europe Bioprocess Analyzers Industry Revenue Share (%), by Application 2024 & 2032
- Figure 24: Europe Bioprocess Analyzers Industry Revenue (Million), by Type 2024 & 2032
- Figure 25: Europe Bioprocess Analyzers Industry Revenue Share (%), by Type 2024 & 2032
- Figure 26: Europe Bioprocess Analyzers Industry Revenue (Million), by Country 2024 & 2032
- Figure 27: Europe Bioprocess Analyzers Industry Revenue Share (%), by Country 2024 & 2032
- Figure 28: Asia Pacific Bioprocess Analyzers Industry Revenue (Million), by Product 2024 & 2032
- Figure 29: Asia Pacific Bioprocess Analyzers Industry Revenue Share (%), by Product 2024 & 2032
- Figure 30: Asia Pacific Bioprocess Analyzers Industry Revenue (Million), by Application 2024 & 2032
- Figure 31: Asia Pacific Bioprocess Analyzers Industry Revenue Share (%), by Application 2024 & 2032
- Figure 32: Asia Pacific Bioprocess Analyzers Industry Revenue (Million), by Type 2024 & 2032
- Figure 33: Asia Pacific Bioprocess Analyzers Industry Revenue Share (%), by Type 2024 & 2032
- Figure 34: Asia Pacific Bioprocess Analyzers Industry Revenue (Million), by Country 2024 & 2032
- Figure 35: Asia Pacific Bioprocess Analyzers Industry Revenue Share (%), by Country 2024 & 2032
- Figure 36: Middle East and Africa Bioprocess Analyzers Industry Revenue (Million), by Product 2024 & 2032
- Figure 37: Middle East and Africa Bioprocess Analyzers Industry Revenue Share (%), by Product 2024 & 2032
- Figure 38: Middle East and Africa Bioprocess Analyzers Industry Revenue (Million), by Application 2024 & 2032
- Figure 39: Middle East and Africa Bioprocess Analyzers Industry Revenue Share (%), by Application 2024 & 2032
- Figure 40: Middle East and Africa Bioprocess Analyzers Industry Revenue (Million), by Type 2024 & 2032
- Figure 41: Middle East and Africa Bioprocess Analyzers Industry Revenue Share (%), by Type 2024 & 2032
- Figure 42: Middle East and Africa Bioprocess Analyzers Industry Revenue (Million), by Country 2024 & 2032
- Figure 43: Middle East and Africa Bioprocess Analyzers Industry Revenue Share (%), by Country 2024 & 2032
- Figure 44: South America Bioprocess Analyzers Industry Revenue (Million), by Product 2024 & 2032
- Figure 45: South America Bioprocess Analyzers Industry Revenue Share (%), by Product 2024 & 2032
- Figure 46: South America Bioprocess Analyzers Industry Revenue (Million), by Application 2024 & 2032
- Figure 47: South America Bioprocess Analyzers Industry Revenue Share (%), by Application 2024 & 2032
- Figure 48: South America Bioprocess Analyzers Industry Revenue (Million), by Type 2024 & 2032
- Figure 49: South America Bioprocess Analyzers Industry Revenue Share (%), by Type 2024 & 2032
- Figure 50: South America Bioprocess Analyzers Industry Revenue (Million), by Country 2024 & 2032
- Figure 51: South America Bioprocess Analyzers Industry Revenue Share (%), by Country 2024 & 2032
List of Tables
- Table 1: Global Bioprocess Analyzers Industry Revenue Million Forecast, by Region 2019 & 2032
- Table 2: Global Bioprocess Analyzers Industry Revenue Million Forecast, by Product 2019 & 2032
- Table 3: Global Bioprocess Analyzers Industry Revenue Million Forecast, by Application 2019 & 2032
- Table 4: Global Bioprocess Analyzers Industry Revenue Million Forecast, by Type 2019 & 2032
- Table 5: Global Bioprocess Analyzers Industry Revenue Million Forecast, by Region 2019 & 2032
- Table 6: Global Bioprocess Analyzers Industry Revenue Million Forecast, by Country 2019 & 2032
- Table 7: United States Bioprocess Analyzers Industry Revenue (Million) Forecast, by Application 2019 & 2032
- Table 8: Canada Bioprocess Analyzers Industry Revenue (Million) Forecast, by Application 2019 & 2032
- Table 9: Mexico Bioprocess Analyzers Industry Revenue (Million) Forecast, by Application 2019 & 2032
- Table 10: Global Bioprocess Analyzers Industry Revenue Million Forecast, by Country 2019 & 2032
- Table 11: Brazil Bioprocess Analyzers Industry Revenue (Million) Forecast, by Application 2019 & 2032
- Table 12: Mexico Bioprocess Analyzers Industry Revenue (Million) Forecast, by Application 2019 & 2032
- Table 13: Rest of South America Bioprocess Analyzers Industry Revenue (Million) Forecast, by Application 2019 & 2032
- Table 14: Global Bioprocess Analyzers Industry Revenue Million Forecast, by Country 2019 & 2032
- Table 15: United Kingdom Bioprocess Analyzers Industry Revenue (Million) Forecast, by Application 2019 & 2032
- Table 16: Germany Bioprocess Analyzers Industry Revenue (Million) Forecast, by Application 2019 & 2032
- Table 17: France Bioprocess Analyzers Industry Revenue (Million) Forecast, by Application 2019 & 2032
- Table 18: Italy Bioprocess Analyzers Industry Revenue (Million) Forecast, by Application 2019 & 2032
- Table 19: Spain Bioprocess Analyzers Industry Revenue (Million) Forecast, by Application 2019 & 2032
- Table 20: Russia Bioprocess Analyzers Industry Revenue (Million) Forecast, by Application 2019 & 2032
- Table 21: Rest of Europe Bioprocess Analyzers Industry Revenue (Million) Forecast, by Application 2019 & 2032
- Table 22: Global Bioprocess Analyzers Industry Revenue Million Forecast, by Country 2019 & 2032
- Table 23: China Bioprocess Analyzers Industry Revenue (Million) Forecast, by Application 2019 & 2032
- Table 24: Japan Bioprocess Analyzers Industry Revenue (Million) Forecast, by Application 2019 & 2032
- Table 25: India Bioprocess Analyzers Industry Revenue (Million) Forecast, by Application 2019 & 2032
- Table 26: South Korea Bioprocess Analyzers Industry Revenue (Million) Forecast, by Application 2019 & 2032
- Table 27: Taiwan Bioprocess Analyzers Industry Revenue (Million) Forecast, by Application 2019 & 2032
- Table 28: Australia Bioprocess Analyzers Industry Revenue (Million) Forecast, by Application 2019 & 2032
- Table 29: Rest of Asia-Pacific Bioprocess Analyzers Industry Revenue (Million) Forecast, by Application 2019 & 2032
- Table 30: Global Bioprocess Analyzers Industry Revenue Million Forecast, by Country 2019 & 2032
- Table 31: Middle East Bioprocess Analyzers Industry Revenue (Million) Forecast, by Application 2019 & 2032
- Table 32: Africa Bioprocess Analyzers Industry Revenue (Million) Forecast, by Application 2019 & 2032
- Table 33: Global Bioprocess Analyzers Industry Revenue Million Forecast, by Product 2019 & 2032
- Table 34: Global Bioprocess Analyzers Industry Revenue Million Forecast, by Application 2019 & 2032
- Table 35: Global Bioprocess Analyzers Industry Revenue Million Forecast, by Type 2019 & 2032
- Table 36: Global Bioprocess Analyzers Industry Revenue Million Forecast, by Country 2019 & 2032
- Table 37: United States Bioprocess Analyzers Industry Revenue (Million) Forecast, by Application 2019 & 2032
- Table 38: Canada Bioprocess Analyzers Industry Revenue (Million) Forecast, by Application 2019 & 2032
- Table 39: Mexico Bioprocess Analyzers Industry Revenue (Million) Forecast, by Application 2019 & 2032
- Table 40: Global Bioprocess Analyzers Industry Revenue Million Forecast, by Product 2019 & 2032
- Table 41: Global Bioprocess Analyzers Industry Revenue Million Forecast, by Application 2019 & 2032
- Table 42: Global Bioprocess Analyzers Industry Revenue Million Forecast, by Type 2019 & 2032
- Table 43: Global Bioprocess Analyzers Industry Revenue Million Forecast, by Country 2019 & 2032
- Table 44: Germany Bioprocess Analyzers Industry Revenue (Million) Forecast, by Application 2019 & 2032
- Table 45: United Kingdom Bioprocess Analyzers Industry Revenue (Million) Forecast, by Application 2019 & 2032
- Table 46: France Bioprocess Analyzers Industry Revenue (Million) Forecast, by Application 2019 & 2032
- Table 47: Italy Bioprocess Analyzers Industry Revenue (Million) Forecast, by Application 2019 & 2032
- Table 48: Spain Bioprocess Analyzers Industry Revenue (Million) Forecast, by Application 2019 & 2032
- Table 49: Rest of Europe Bioprocess Analyzers Industry Revenue (Million) Forecast, by Application 2019 & 2032
- Table 50: Global Bioprocess Analyzers Industry Revenue Million Forecast, by Product 2019 & 2032
- Table 51: Global Bioprocess Analyzers Industry Revenue Million Forecast, by Application 2019 & 2032
- Table 52: Global Bioprocess Analyzers Industry Revenue Million Forecast, by Type 2019 & 2032
- Table 53: Global Bioprocess Analyzers Industry Revenue Million Forecast, by Country 2019 & 2032
- Table 54: China Bioprocess Analyzers Industry Revenue (Million) Forecast, by Application 2019 & 2032
- Table 55: Japan Bioprocess Analyzers Industry Revenue (Million) Forecast, by Application 2019 & 2032
- Table 56: India Bioprocess Analyzers Industry Revenue (Million) Forecast, by Application 2019 & 2032
- Table 57: Australia Bioprocess Analyzers Industry Revenue (Million) Forecast, by Application 2019 & 2032
- Table 58: South Korea Bioprocess Analyzers Industry Revenue (Million) Forecast, by Application 2019 & 2032
- Table 59: Rest of Asia Pacific Bioprocess Analyzers Industry Revenue (Million) Forecast, by Application 2019 & 2032
- Table 60: Global Bioprocess Analyzers Industry Revenue Million Forecast, by Product 2019 & 2032
- Table 61: Global Bioprocess Analyzers Industry Revenue Million Forecast, by Application 2019 & 2032
- Table 62: Global Bioprocess Analyzers Industry Revenue Million Forecast, by Type 2019 & 2032
- Table 63: Global Bioprocess Analyzers Industry Revenue Million Forecast, by Country 2019 & 2032
- Table 64: GCC Bioprocess Analyzers Industry Revenue (Million) Forecast, by Application 2019 & 2032
- Table 65: South Africa Bioprocess Analyzers Industry Revenue (Million) Forecast, by Application 2019 & 2032
- Table 66: Rest of Middle East and Africa Bioprocess Analyzers Industry Revenue (Million) Forecast, by Application 2019 & 2032
- Table 67: Global Bioprocess Analyzers Industry Revenue Million Forecast, by Product 2019 & 2032
- Table 68: Global Bioprocess Analyzers Industry Revenue Million Forecast, by Application 2019 & 2032
- Table 69: Global Bioprocess Analyzers Industry Revenue Million Forecast, by Type 2019 & 2032
- Table 70: Global Bioprocess Analyzers Industry Revenue Million Forecast, by Country 2019 & 2032
- Table 71: Brazil Bioprocess Analyzers Industry Revenue (Million) Forecast, by Application 2019 & 2032
- Table 72: Argentina Bioprocess Analyzers Industry Revenue (Million) Forecast, by Application 2019 & 2032
- Table 73: Rest of South America Bioprocess Analyzers Industry Revenue (Million) Forecast, by Application 2019 & 2032
Frequently Asked Questions
1. What is the projected Compound Annual Growth Rate (CAGR) of the Bioprocess Analyzers Industry?
The projected CAGR is approximately 15.80%.
2. Which companies are prominent players in the Bioprocess Analyzers Industry?
Key companies in the market include YSI Inc *List Not Exhaustive, Randox Laboratories Ltd, Nova Biomedical Corporation, SYSBIOTECH GmbH, F Hoffmann-La Roche AG, 4BioCell GmbH & Co KG, Sartorious AG, Kaiser Optical Systems Inc, Groton Biosystems, Thermo Fisher Scientific, Agilent Technologies.
3. What are the main segments of the Bioprocess Analyzers Industry?
The market segments include Product, Application, Type.
4. Can you provide details about the market size?
The market size is estimated to be USD 2.00 Million as of 2022.
5. What are some drivers contributing to market growth?
Growing Interest in the Development of Advanced Medicines and Vaccines; Increasing Demand for Biologics.
6. What are the notable trends driving market growth?
Recombinant Protein Segment is Expected to Hold a Significant Market Share over the Forecast Period.
7. Are there any restraints impacting market growth?
Complexity of Upstream and Downstream Processing and Strict Regulations; High Cost of Raw Materials.
8. Can you provide examples of recent developments in the market?
August 2022: Beckman Coulter Life Sciences entered into a partnership with Flownamics to create an automated, online solution for bioprocess culture monitoring and control. The agreement unites the company's Vi-CELL BLU Cell Viability Analyzer with the Seg-Flow S3 Automated On-Line Sampling System from Flownamics.
9. What pricing options are available for accessing the report?
Pricing options include single-user, multi-user, and enterprise licenses priced at USD 4750, USD 5250, and USD 8750 respectively.
10. Is the market size provided in terms of value or volume?
The market size is provided in terms of value, measured in Million.
11. Are there any specific market keywords associated with the report?
Yes, the market keyword associated with the report is "Bioprocess Analyzers Industry," which aids in identifying and referencing the specific market segment covered.
12. How do I determine which pricing option suits my needs best?
The pricing options vary based on user requirements and access needs. Individual users may opt for single-user licenses, while businesses requiring broader access may choose multi-user or enterprise licenses for cost-effective access to the report.
13. Are there any additional resources or data provided in the Bioprocess Analyzers Industry report?
While the report offers comprehensive insights, it's advisable to review the specific contents or supplementary materials provided to ascertain if additional resources or data are available.
14. How can I stay updated on further developments or reports in the Bioprocess Analyzers Industry?
To stay informed about further developments, trends, and reports in the Bioprocess Analyzers Industry, consider subscribing to industry newsletters, following relevant companies and organizations, or regularly checking reputable industry news sources and publications.
Methodology
Step 1 - Identification of Relevant Samples Size from Population Database


Step 2 - Approaches for Defining Global Market Size (Value, Volume* & Price*)

Note*: In applicable scenarios
Step 3 - Data Sources
Primary Research
- Web Analytics
- Survey Reports
- Research Institute
- Latest Research Reports
- Opinion Leaders
Secondary Research
- Annual Reports
- White Paper
- Latest Press Release
- Industry Association
- Paid Database
- Investor Presentations

Step 4 - Data Triangulation
Involves using different sources of information in order to increase the validity of a study
These sources are likely to be stakeholders in a program - participants, other researchers, program staff, other community members, and so on.
Then we put all data in single framework & apply various statistical tools to find out the dynamic on the market.
During the analysis stage, feedback from the stakeholder groups would be compared to determine areas of agreement as well as areas of divergence
