

Key Insights
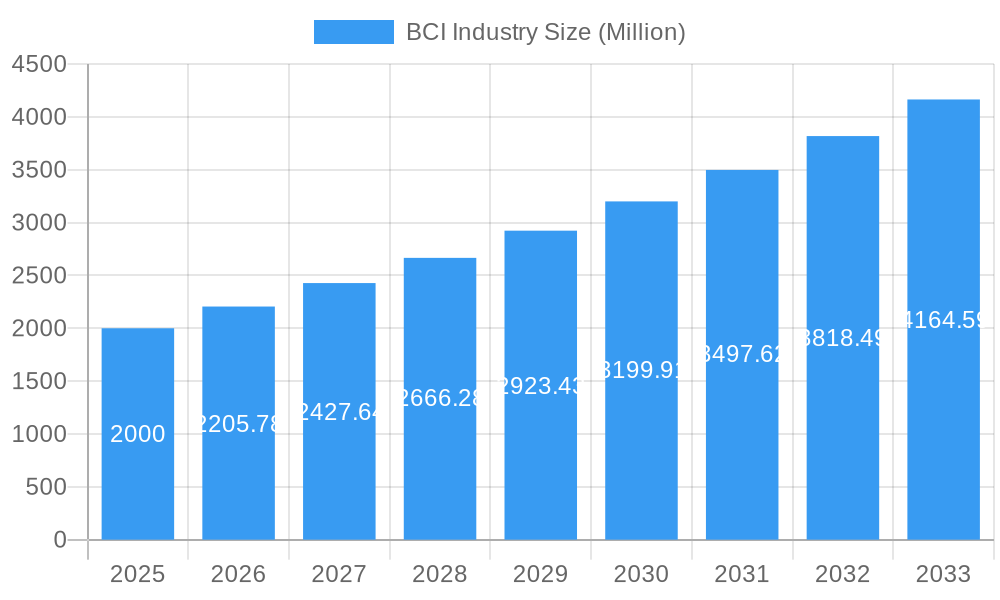
The Brain-Computer Interface (BCI) market is poised for significant growth, projected to reach \$2.0 billion in 2025 and exhibiting a Compound Annual Growth Rate (CAGR) of 10.29% from 2025 to 2033. This expansion is driven by several key factors. Technological advancements are leading to more sophisticated and user-friendly BCI systems, reducing invasiveness and improving performance. The rising prevalence of neurological disorders like paralysis and Alzheimer's disease fuels demand for effective restorative therapies, positioning BCI as a promising solution. Furthermore, increasing research and development funding from both public and private sectors are accelerating innovation and bringing new BCI applications to market. Growing awareness and acceptance of BCI technology among healthcare professionals and patients are also contributing to market growth. The market is segmented by type (invasive, non-invasive, other) and application (restoration of disabilities, repair of brain function, other). While invasive BCIs offer higher performance, non-invasive options are gaining traction due to their lower risk profile and greater accessibility. The restorative applications segment currently dominates, but advancements in brain function repair are expected to drive substantial future growth. Competition is robust, with companies like Medtronic, Neuralink (although not explicitly listed, a major player in the industry), and other key players driving innovation and market share. Geographic distribution shows strong growth in North America and Europe, fueled by advanced healthcare infrastructure and robust regulatory frameworks, but the Asia-Pacific region is expected to experience rapid growth driven by increasing healthcare spending and a large patient population.
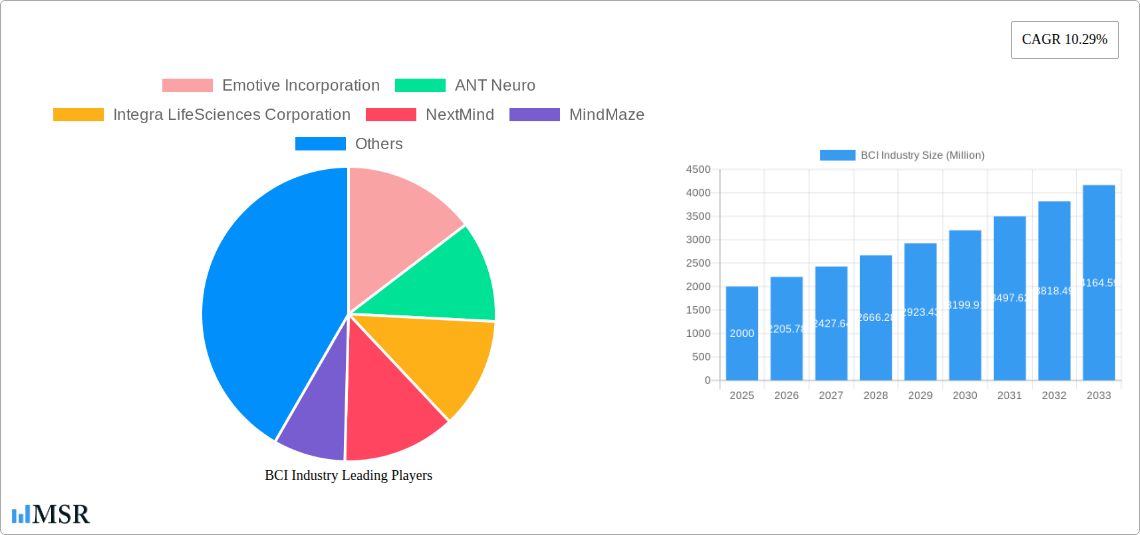
BCI Industry Market Size (In Billion)
The success of the BCI market hinges on overcoming challenges. High costs associated with BCI development and implementation remain a barrier to wider adoption, particularly in developing countries. Furthermore, ethical concerns regarding data privacy and the potential for misuse of BCI technology need careful consideration. Regulatory hurdles and the need for rigorous clinical trials also impact the speed of market penetration. Addressing these challenges through collaborative efforts among researchers, policymakers, and industry stakeholders is crucial for realizing the full potential of BCI technology and ensuring its responsible deployment. Focus on improving the accuracy, reliability, and affordability of BCI systems, coupled with comprehensive public education campaigns, will be instrumental in driving wider adoption and fostering a sustainable market.
BCI Industry Company Market Share
The Brain-Computer Interface (BCI) Industry: A Comprehensive Market Report (2019-2033)
This in-depth report provides a comprehensive analysis of the Brain-Computer Interface (BCI) industry, projecting a market valuation exceeding $xx Million by 2033. It offers invaluable insights for stakeholders, investors, and industry professionals seeking to understand the current market dynamics and future growth potential of this rapidly evolving sector. The report covers the period 2019-2033, with a focus on the estimated year 2025 and a forecast period of 2025-2033. Key players such as Emotive Incorporation, ANT Neuro, Integra LifeSciences Corporation, NextMind, and Medtronic PLC are analyzed extensively.
BCI Industry Market Concentration & Dynamics
The BCI market exhibits a moderately concentrated structure, with a few key players holding significant market share. The industry is characterized by a dynamic innovation ecosystem, fueled by substantial investments in research and development. Regulatory frameworks governing BCI technologies vary across different regions, impacting market entry and product approval timelines. Substitute products, while limited currently, represent a potential future threat to market growth. End-user trends are shifting towards non-invasive BCI solutions due to their ease of use and reduced invasiveness. The historical period (2019-2024) witnessed a notable increase in M&A activities, with xx major deals recorded. The forecast period (2025-2033) is expected to see a continued increase in M&A activity driven by a combination of factors.
- Market Share: Medtronic PLC and Integra LifeSciences Corporation currently hold a significant share of the global BCI market, estimated to be around xx% and xx% respectively in 2025. Smaller players like Emotive Incorporation and ANT Neuro are expected to experience accelerated growth in the coming years.
- M&A Activity: The number of M&A deals in the BCI industry is projected to increase by xx% annually during the forecast period, driven by strategic acquisitions aiming to expand product portfolios and technological capabilities.
BCI Industry Insights & Trends
The global BCI market is experiencing exponential growth, driven by several key factors. Technological advancements, particularly in areas like artificial intelligence and machine learning, are enabling the development of more sophisticated and effective BCI systems. The increasing prevalence of neurological disorders and the rising demand for advanced rehabilitation solutions are creating significant market opportunities. Consumer acceptance of BCI technology is gradually increasing, fueled by growing awareness of the potential benefits and improved user-friendliness. The market size in 2025 is estimated at $xx Million, with a compound annual growth rate (CAGR) of xx% projected for the period 2025-2033.
Key Markets & Segments Leading BCI Industry
The North American region currently dominates the global BCI market, driven by factors such as high healthcare spending, advanced technological infrastructure, and a robust regulatory environment. Within the BCI market segmentation, the non-invasive BCI segment holds the largest market share, followed by invasive BCI and other types. The restoration of disabilities application segment is also exhibiting substantial growth, fueled by the increasing prevalence of conditions like paralysis and spinal cord injuries.
By Type:
- Non-invasive Brain-Computer Interface: This segment is experiencing high growth due to ease of use and reduced risks.
- Invasive Brain-Computer Interface: Growth is being driven by the development of safer and more effective invasive procedures and expanding applications within the neurosurgical market.
- Other Types: This segment shows potential but currently represents a smaller fraction of the market.
By Application:
- Restoration of Disabilities: This is the leading application segment, driven by the growing need for assistive technologies for patients with paralysis and other mobility impairments.
- Repair of Brain Function: This segment is experiencing growth due to advancements in neurorehabilitation techniques and the growing understanding of brain plasticity.
- Other Applications: Emerging applications in areas like gaming and entertainment are expected to contribute to market expansion.
Drivers for North American Dominance:
- Strong economic growth supporting high healthcare spending.
- Advanced technological infrastructure fostering innovation and development.
- Favorable regulatory environment promoting market access for BCI technologies.
BCI Industry Product Developments
Recent years have witnessed significant advancements in BCI technology, including the development of more accurate and reliable signal acquisition methods, improved algorithms for processing brain signals, and the creation of more user-friendly and comfortable BCI interfaces. These innovations have broadened the range of potential applications, expanding the addressable market. This has led to increased competition, pushing companies towards greater product differentiation.
Challenges in the BCI Industry Market
The BCI market faces several challenges, including stringent regulatory requirements for medical devices, which can prolong the approval process and increase development costs. Supply chain constraints, especially regarding specialized components, can disrupt production and impact market availability. Intense competition among established and emerging players necessitates continuous innovation and strategic partnerships for sustained growth. The total estimated impact of these challenges on market growth is estimated to be a reduction of approximately xx% by 2033.
Forces Driving BCI Industry Growth
Technological advancements in areas such as artificial intelligence (AI) and machine learning (ML) are significantly driving the growth of the BCI industry. Rising healthcare expenditure coupled with increasing prevalence of neurological disorders are creating a greater demand for effective treatment and rehabilitation options. Favorable government regulations and initiatives supporting medical innovation are creating a supportive environment for the development and commercialization of BCI systems.
Long-Term Growth Catalysts in the BCI Industry
The long-term growth of the BCI industry is expected to be fueled by continuous technological advancements, strategic partnerships between technology companies and healthcare providers, and expansion into new geographical markets. Further research into neural interfaces and brain-computer interaction promises to unlock new applications and significantly expand market opportunities.
Emerging Opportunities in BCI Industry
Emerging opportunities in the BCI industry include the development of more personalized and adaptive BCI systems, integration with other medical devices and technologies, and expansion into new application areas such as brain-computer interfaces for mental health treatment. Consumer interest in neurotechnology, driven by advancements in virtual reality and other technologies, also presents significant market expansion opportunities.
Leading Players in the BCI Industry Sector
- Emotive Incorporation
- ANT Neuro
- Integra LifeSciences Corporation
- NextMind
- MindMaze
- NIRx Medical Technologies
- Natus Medical Inc
- Compumedics Ltd
- Medtronic PLC
- Advanced Brain Monitoring Inc
- NeuroSky
- Brain Products GmbH
- Cadwell Industries Inc
- g tec medical engineering GmbH
- Nihon Kohden Corporation
Key Milestones in BCI Industry
- 2020: FDA approval of a new non-invasive BCI system for stroke rehabilitation.
- 2021: Strategic partnership between a major technology company and a leading BCI research institute.
- 2022: Launch of a new generation of high-resolution BCI sensors.
- 2023: Significant investment in a leading BCI startup.
- 2024: First successful clinical trial of a fully implantable BCI.
- 2025: Market launch of a new BCI platform for consumer applications.
Strategic Outlook for BCI Industry Market
The future of the BCI industry is bright, with significant growth potential driven by continuous technological innovation and expanding applications. Strategic partnerships and collaborations will be essential for market penetration and sustained success. The industry is expected to continue to see further consolidation, with larger players acquiring smaller companies to expand their market share and product portfolios. The market will continue to be shaped by advancements in AI, machine learning, and neural engineering, creating new opportunities for market expansion and disruption.
BCI Industry Segmentation
-
1. Type
- 1.1. Invasive Brain-computer Interface
- 1.2. Non-invasive Brain-computer Interface
- 1.3. Other Types
-
2. Application
- 2.1. Restoration of Disabilities
- 2.2. Repair of Brain Function
- 2.3. Other Applications
BCI Industry Segmentation By Geography
-
1. North America
- 1.1. United States
- 1.2. Canada
- 1.3. Mexico
-
2. Europe
- 2.1. Germany
- 2.2. United Kingdom
- 2.3. France
- 2.4. Italy
- 2.5. Spain
- 2.6. Rest of Europe
-
3. Asia Pacific
- 3.1. China
- 3.2. Japan
- 3.3. India
- 3.4. Australia
- 3.5. South Korea
- 3.6. Rest of Asia Pacific
-
4. Middle East and Africa
- 4.1. GCC
- 4.2. South Africa
- 4.3. Rest of Middle East and Africa
-
5. South America
- 5.1. Brazil
- 5.2. Argentina
- 5.3. Rest of South America
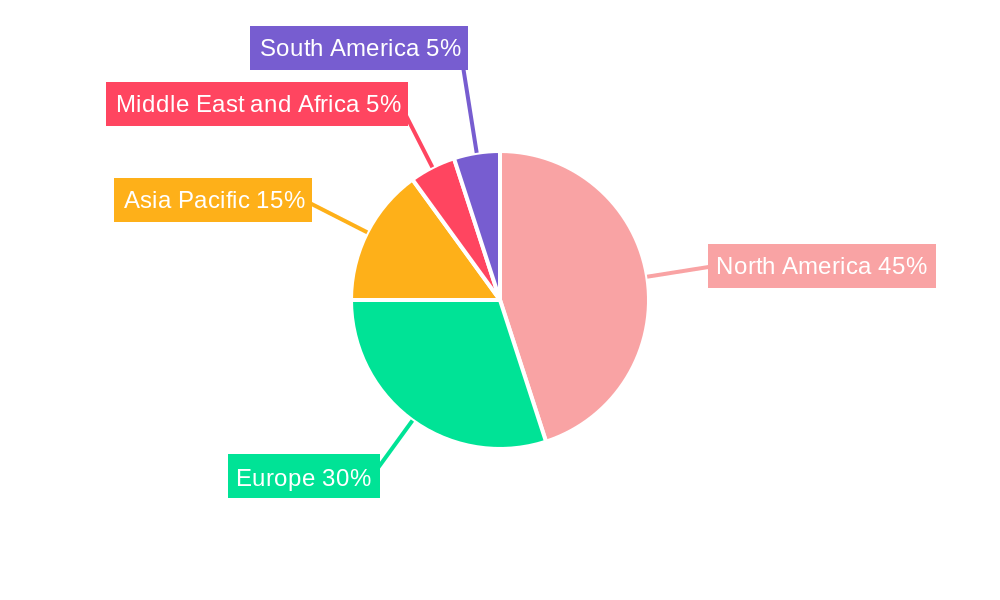
BCI Industry Regional Market Share
Geographic Coverage of BCI Industry
BCI Industry REPORT HIGHLIGHTS
| Aspects | Details |
|---|---|
| Study Period | 2020-2034 |
| Base Year | 2025 |
| Estimated Year | 2026 |
| Forecast Period | 2026-2034 |
| Historical Period | 2020-2025 |
| Growth Rate | CAGR of 10.29% from 2020-2034 |
| Segmentation |
|
Table of Contents
- 1. Introduction
- 1.1. Research Scope
- 1.2. Market Segmentation
- 1.3. Research Methodology
- 1.4. Definitions and Assumptions
- 2. Executive Summary
- 2.1. Introduction
- 3. Market Dynamics
- 3.1. Introduction
- 3.2. Market Drivers
- 3.2.1. Increasing Prevalence of Neurodegenerative Disorders; Rising R&D Activities by Government to Improve the Brain-computer Interface Technology; Various Technological Advancements such as Miniaturization of Devices
- 3.3. Market Restrains
- 3.3.1. High Cost of Brain-computer Interface Devices; Lack of Expertise in Implementing the Systems
- 3.4. Market Trends
- 3.4.1. The Non-invasive Brain-computer Interface Segment is Expected to Dominate the Market During the Forecast Period
- 4. Market Factor Analysis
- 4.1. Porters Five Forces
- 4.2. Supply/Value Chain
- 4.3. PESTEL analysis
- 4.4. Market Entropy
- 4.5. Patent/Trademark Analysis
- 5. Global BCI Industry Analysis, Insights and Forecast, 2020-2032
- 5.1. Market Analysis, Insights and Forecast - by Type
- 5.1.1. Invasive Brain-computer Interface
- 5.1.2. Non-invasive Brain-computer Interface
- 5.1.3. Other Types
- 5.2. Market Analysis, Insights and Forecast - by Application
- 5.2.1. Restoration of Disabilities
- 5.2.2. Repair of Brain Function
- 5.2.3. Other Applications
- 5.3. Market Analysis, Insights and Forecast - by Region
- 5.3.1. North America
- 5.3.2. Europe
- 5.3.3. Asia Pacific
- 5.3.4. Middle East and Africa
- 5.3.5. South America
- 5.1. Market Analysis, Insights and Forecast - by Type
- 6. North America BCI Industry Analysis, Insights and Forecast, 2020-2032
- 6.1. Market Analysis, Insights and Forecast - by Type
- 6.1.1. Invasive Brain-computer Interface
- 6.1.2. Non-invasive Brain-computer Interface
- 6.1.3. Other Types
- 6.2. Market Analysis, Insights and Forecast - by Application
- 6.2.1. Restoration of Disabilities
- 6.2.2. Repair of Brain Function
- 6.2.3. Other Applications
- 6.1. Market Analysis, Insights and Forecast - by Type
- 7. Europe BCI Industry Analysis, Insights and Forecast, 2020-2032
- 7.1. Market Analysis, Insights and Forecast - by Type
- 7.1.1. Invasive Brain-computer Interface
- 7.1.2. Non-invasive Brain-computer Interface
- 7.1.3. Other Types
- 7.2. Market Analysis, Insights and Forecast - by Application
- 7.2.1. Restoration of Disabilities
- 7.2.2. Repair of Brain Function
- 7.2.3. Other Applications
- 7.1. Market Analysis, Insights and Forecast - by Type
- 8. Asia Pacific BCI Industry Analysis, Insights and Forecast, 2020-2032
- 8.1. Market Analysis, Insights and Forecast - by Type
- 8.1.1. Invasive Brain-computer Interface
- 8.1.2. Non-invasive Brain-computer Interface
- 8.1.3. Other Types
- 8.2. Market Analysis, Insights and Forecast - by Application
- 8.2.1. Restoration of Disabilities
- 8.2.2. Repair of Brain Function
- 8.2.3. Other Applications
- 8.1. Market Analysis, Insights and Forecast - by Type
- 9. Middle East and Africa BCI Industry Analysis, Insights and Forecast, 2020-2032
- 9.1. Market Analysis, Insights and Forecast - by Type
- 9.1.1. Invasive Brain-computer Interface
- 9.1.2. Non-invasive Brain-computer Interface
- 9.1.3. Other Types
- 9.2. Market Analysis, Insights and Forecast - by Application
- 9.2.1. Restoration of Disabilities
- 9.2.2. Repair of Brain Function
- 9.2.3. Other Applications
- 9.1. Market Analysis, Insights and Forecast - by Type
- 10. South America BCI Industry Analysis, Insights and Forecast, 2020-2032
- 10.1. Market Analysis, Insights and Forecast - by Type
- 10.1.1. Invasive Brain-computer Interface
- 10.1.2. Non-invasive Brain-computer Interface
- 10.1.3. Other Types
- 10.2. Market Analysis, Insights and Forecast - by Application
- 10.2.1. Restoration of Disabilities
- 10.2.2. Repair of Brain Function
- 10.2.3. Other Applications
- 10.1. Market Analysis, Insights and Forecast - by Type
- 11. Competitive Analysis
- 11.1. Global Market Share Analysis 2025
- 11.2. Company Profiles
- 11.2.1 Emotive Incorporation
- 11.2.1.1. Overview
- 11.2.1.2. Products
- 11.2.1.3. SWOT Analysis
- 11.2.1.4. Recent Developments
- 11.2.1.5. Financials (Based on Availability)
- 11.2.2 ANT Neuro
- 11.2.2.1. Overview
- 11.2.2.2. Products
- 11.2.2.3. SWOT Analysis
- 11.2.2.4. Recent Developments
- 11.2.2.5. Financials (Based on Availability)
- 11.2.3 Integra LifeSciences Corporation
- 11.2.3.1. Overview
- 11.2.3.2. Products
- 11.2.3.3. SWOT Analysis
- 11.2.3.4. Recent Developments
- 11.2.3.5. Financials (Based on Availability)
- 11.2.4 NextMind
- 11.2.4.1. Overview
- 11.2.4.2. Products
- 11.2.4.3. SWOT Analysis
- 11.2.4.4. Recent Developments
- 11.2.4.5. Financials (Based on Availability)
- 11.2.5 MindMaze
- 11.2.5.1. Overview
- 11.2.5.2. Products
- 11.2.5.3. SWOT Analysis
- 11.2.5.4. Recent Developments
- 11.2.5.5. Financials (Based on Availability)
- 11.2.6 NIRx Medical Technologies
- 11.2.6.1. Overview
- 11.2.6.2. Products
- 11.2.6.3. SWOT Analysis
- 11.2.6.4. Recent Developments
- 11.2.6.5. Financials (Based on Availability)
- 11.2.7 Natus Medical Inc
- 11.2.7.1. Overview
- 11.2.7.2. Products
- 11.2.7.3. SWOT Analysis
- 11.2.7.4. Recent Developments
- 11.2.7.5. Financials (Based on Availability)
- 11.2.8 Compumedics Ltd
- 11.2.8.1. Overview
- 11.2.8.2. Products
- 11.2.8.3. SWOT Analysis
- 11.2.8.4. Recent Developments
- 11.2.8.5. Financials (Based on Availability)
- 11.2.9 Medtronic PLC
- 11.2.9.1. Overview
- 11.2.9.2. Products
- 11.2.9.3. SWOT Analysis
- 11.2.9.4. Recent Developments
- 11.2.9.5. Financials (Based on Availability)
- 11.2.10 Advanced Brain Monitoring Inc
- 11.2.10.1. Overview
- 11.2.10.2. Products
- 11.2.10.3. SWOT Analysis
- 11.2.10.4. Recent Developments
- 11.2.10.5. Financials (Based on Availability)
- 11.2.11 NeuroSky
- 11.2.11.1. Overview
- 11.2.11.2. Products
- 11.2.11.3. SWOT Analysis
- 11.2.11.4. Recent Developments
- 11.2.11.5. Financials (Based on Availability)
- 11.2.12 Brain Products GmbH
- 11.2.12.1. Overview
- 11.2.12.2. Products
- 11.2.12.3. SWOT Analysis
- 11.2.12.4. Recent Developments
- 11.2.12.5. Financials (Based on Availability)
- 11.2.13 Cadwell Industries Inc
- 11.2.13.1. Overview
- 11.2.13.2. Products
- 11.2.13.3. SWOT Analysis
- 11.2.13.4. Recent Developments
- 11.2.13.5. Financials (Based on Availability)
- 11.2.14 g tec medical engineering GmbH
- 11.2.14.1. Overview
- 11.2.14.2. Products
- 11.2.14.3. SWOT Analysis
- 11.2.14.4. Recent Developments
- 11.2.14.5. Financials (Based on Availability)
- 11.2.15 Nihon Kohden Corporation
- 11.2.15.1. Overview
- 11.2.15.2. Products
- 11.2.15.3. SWOT Analysis
- 11.2.15.4. Recent Developments
- 11.2.15.5. Financials (Based on Availability)
- 11.2.1 Emotive Incorporation
List of Figures
- Figure 1: Global BCI Industry Revenue Breakdown (Million, %) by Region 2025 & 2033
- Figure 2: Global BCI Industry Volume Breakdown (K Unit, %) by Region 2025 & 2033
- Figure 3: North America BCI Industry Revenue (Million), by Type 2025 & 2033
- Figure 4: North America BCI Industry Volume (K Unit), by Type 2025 & 2033
- Figure 5: North America BCI Industry Revenue Share (%), by Type 2025 & 2033
- Figure 6: North America BCI Industry Volume Share (%), by Type 2025 & 2033
- Figure 7: North America BCI Industry Revenue (Million), by Application 2025 & 2033
- Figure 8: North America BCI Industry Volume (K Unit), by Application 2025 & 2033
- Figure 9: North America BCI Industry Revenue Share (%), by Application 2025 & 2033
- Figure 10: North America BCI Industry Volume Share (%), by Application 2025 & 2033
- Figure 11: North America BCI Industry Revenue (Million), by Country 2025 & 2033
- Figure 12: North America BCI Industry Volume (K Unit), by Country 2025 & 2033
- Figure 13: North America BCI Industry Revenue Share (%), by Country 2025 & 2033
- Figure 14: North America BCI Industry Volume Share (%), by Country 2025 & 2033
- Figure 15: Europe BCI Industry Revenue (Million), by Type 2025 & 2033
- Figure 16: Europe BCI Industry Volume (K Unit), by Type 2025 & 2033
- Figure 17: Europe BCI Industry Revenue Share (%), by Type 2025 & 2033
- Figure 18: Europe BCI Industry Volume Share (%), by Type 2025 & 2033
- Figure 19: Europe BCI Industry Revenue (Million), by Application 2025 & 2033
- Figure 20: Europe BCI Industry Volume (K Unit), by Application 2025 & 2033
- Figure 21: Europe BCI Industry Revenue Share (%), by Application 2025 & 2033
- Figure 22: Europe BCI Industry Volume Share (%), by Application 2025 & 2033
- Figure 23: Europe BCI Industry Revenue (Million), by Country 2025 & 2033
- Figure 24: Europe BCI Industry Volume (K Unit), by Country 2025 & 2033
- Figure 25: Europe BCI Industry Revenue Share (%), by Country 2025 & 2033
- Figure 26: Europe BCI Industry Volume Share (%), by Country 2025 & 2033
- Figure 27: Asia Pacific BCI Industry Revenue (Million), by Type 2025 & 2033
- Figure 28: Asia Pacific BCI Industry Volume (K Unit), by Type 2025 & 2033
- Figure 29: Asia Pacific BCI Industry Revenue Share (%), by Type 2025 & 2033
- Figure 30: Asia Pacific BCI Industry Volume Share (%), by Type 2025 & 2033
- Figure 31: Asia Pacific BCI Industry Revenue (Million), by Application 2025 & 2033
- Figure 32: Asia Pacific BCI Industry Volume (K Unit), by Application 2025 & 2033
- Figure 33: Asia Pacific BCI Industry Revenue Share (%), by Application 2025 & 2033
- Figure 34: Asia Pacific BCI Industry Volume Share (%), by Application 2025 & 2033
- Figure 35: Asia Pacific BCI Industry Revenue (Million), by Country 2025 & 2033
- Figure 36: Asia Pacific BCI Industry Volume (K Unit), by Country 2025 & 2033
- Figure 37: Asia Pacific BCI Industry Revenue Share (%), by Country 2025 & 2033
- Figure 38: Asia Pacific BCI Industry Volume Share (%), by Country 2025 & 2033
- Figure 39: Middle East and Africa BCI Industry Revenue (Million), by Type 2025 & 2033
- Figure 40: Middle East and Africa BCI Industry Volume (K Unit), by Type 2025 & 2033
- Figure 41: Middle East and Africa BCI Industry Revenue Share (%), by Type 2025 & 2033
- Figure 42: Middle East and Africa BCI Industry Volume Share (%), by Type 2025 & 2033
- Figure 43: Middle East and Africa BCI Industry Revenue (Million), by Application 2025 & 2033
- Figure 44: Middle East and Africa BCI Industry Volume (K Unit), by Application 2025 & 2033
- Figure 45: Middle East and Africa BCI Industry Revenue Share (%), by Application 2025 & 2033
- Figure 46: Middle East and Africa BCI Industry Volume Share (%), by Application 2025 & 2033
- Figure 47: Middle East and Africa BCI Industry Revenue (Million), by Country 2025 & 2033
- Figure 48: Middle East and Africa BCI Industry Volume (K Unit), by Country 2025 & 2033
- Figure 49: Middle East and Africa BCI Industry Revenue Share (%), by Country 2025 & 2033
- Figure 50: Middle East and Africa BCI Industry Volume Share (%), by Country 2025 & 2033
- Figure 51: South America BCI Industry Revenue (Million), by Type 2025 & 2033
- Figure 52: South America BCI Industry Volume (K Unit), by Type 2025 & 2033
- Figure 53: South America BCI Industry Revenue Share (%), by Type 2025 & 2033
- Figure 54: South America BCI Industry Volume Share (%), by Type 2025 & 2033
- Figure 55: South America BCI Industry Revenue (Million), by Application 2025 & 2033
- Figure 56: South America BCI Industry Volume (K Unit), by Application 2025 & 2033
- Figure 57: South America BCI Industry Revenue Share (%), by Application 2025 & 2033
- Figure 58: South America BCI Industry Volume Share (%), by Application 2025 & 2033
- Figure 59: South America BCI Industry Revenue (Million), by Country 2025 & 2033
- Figure 60: South America BCI Industry Volume (K Unit), by Country 2025 & 2033
- Figure 61: South America BCI Industry Revenue Share (%), by Country 2025 & 2033
- Figure 62: South America BCI Industry Volume Share (%), by Country 2025 & 2033
List of Tables
- Table 1: Global BCI Industry Revenue Million Forecast, by Type 2020 & 2033
- Table 2: Global BCI Industry Volume K Unit Forecast, by Type 2020 & 2033
- Table 3: Global BCI Industry Revenue Million Forecast, by Application 2020 & 2033
- Table 4: Global BCI Industry Volume K Unit Forecast, by Application 2020 & 2033
- Table 5: Global BCI Industry Revenue Million Forecast, by Region 2020 & 2033
- Table 6: Global BCI Industry Volume K Unit Forecast, by Region 2020 & 2033
- Table 7: Global BCI Industry Revenue Million Forecast, by Type 2020 & 2033
- Table 8: Global BCI Industry Volume K Unit Forecast, by Type 2020 & 2033
- Table 9: Global BCI Industry Revenue Million Forecast, by Application 2020 & 2033
- Table 10: Global BCI Industry Volume K Unit Forecast, by Application 2020 & 2033
- Table 11: Global BCI Industry Revenue Million Forecast, by Country 2020 & 2033
- Table 12: Global BCI Industry Volume K Unit Forecast, by Country 2020 & 2033
- Table 13: United States BCI Industry Revenue (Million) Forecast, by Application 2020 & 2033
- Table 14: United States BCI Industry Volume (K Unit) Forecast, by Application 2020 & 2033
- Table 15: Canada BCI Industry Revenue (Million) Forecast, by Application 2020 & 2033
- Table 16: Canada BCI Industry Volume (K Unit) Forecast, by Application 2020 & 2033
- Table 17: Mexico BCI Industry Revenue (Million) Forecast, by Application 2020 & 2033
- Table 18: Mexico BCI Industry Volume (K Unit) Forecast, by Application 2020 & 2033
- Table 19: Global BCI Industry Revenue Million Forecast, by Type 2020 & 2033
- Table 20: Global BCI Industry Volume K Unit Forecast, by Type 2020 & 2033
- Table 21: Global BCI Industry Revenue Million Forecast, by Application 2020 & 2033
- Table 22: Global BCI Industry Volume K Unit Forecast, by Application 2020 & 2033
- Table 23: Global BCI Industry Revenue Million Forecast, by Country 2020 & 2033
- Table 24: Global BCI Industry Volume K Unit Forecast, by Country 2020 & 2033
- Table 25: Germany BCI Industry Revenue (Million) Forecast, by Application 2020 & 2033
- Table 26: Germany BCI Industry Volume (K Unit) Forecast, by Application 2020 & 2033
- Table 27: United Kingdom BCI Industry Revenue (Million) Forecast, by Application 2020 & 2033
- Table 28: United Kingdom BCI Industry Volume (K Unit) Forecast, by Application 2020 & 2033
- Table 29: France BCI Industry Revenue (Million) Forecast, by Application 2020 & 2033
- Table 30: France BCI Industry Volume (K Unit) Forecast, by Application 2020 & 2033
- Table 31: Italy BCI Industry Revenue (Million) Forecast, by Application 2020 & 2033
- Table 32: Italy BCI Industry Volume (K Unit) Forecast, by Application 2020 & 2033
- Table 33: Spain BCI Industry Revenue (Million) Forecast, by Application 2020 & 2033
- Table 34: Spain BCI Industry Volume (K Unit) Forecast, by Application 2020 & 2033
- Table 35: Rest of Europe BCI Industry Revenue (Million) Forecast, by Application 2020 & 2033
- Table 36: Rest of Europe BCI Industry Volume (K Unit) Forecast, by Application 2020 & 2033
- Table 37: Global BCI Industry Revenue Million Forecast, by Type 2020 & 2033
- Table 38: Global BCI Industry Volume K Unit Forecast, by Type 2020 & 2033
- Table 39: Global BCI Industry Revenue Million Forecast, by Application 2020 & 2033
- Table 40: Global BCI Industry Volume K Unit Forecast, by Application 2020 & 2033
- Table 41: Global BCI Industry Revenue Million Forecast, by Country 2020 & 2033
- Table 42: Global BCI Industry Volume K Unit Forecast, by Country 2020 & 2033
- Table 43: China BCI Industry Revenue (Million) Forecast, by Application 2020 & 2033
- Table 44: China BCI Industry Volume (K Unit) Forecast, by Application 2020 & 2033
- Table 45: Japan BCI Industry Revenue (Million) Forecast, by Application 2020 & 2033
- Table 46: Japan BCI Industry Volume (K Unit) Forecast, by Application 2020 & 2033
- Table 47: India BCI Industry Revenue (Million) Forecast, by Application 2020 & 2033
- Table 48: India BCI Industry Volume (K Unit) Forecast, by Application 2020 & 2033
- Table 49: Australia BCI Industry Revenue (Million) Forecast, by Application 2020 & 2033
- Table 50: Australia BCI Industry Volume (K Unit) Forecast, by Application 2020 & 2033
- Table 51: South Korea BCI Industry Revenue (Million) Forecast, by Application 2020 & 2033
- Table 52: South Korea BCI Industry Volume (K Unit) Forecast, by Application 2020 & 2033
- Table 53: Rest of Asia Pacific BCI Industry Revenue (Million) Forecast, by Application 2020 & 2033
- Table 54: Rest of Asia Pacific BCI Industry Volume (K Unit) Forecast, by Application 2020 & 2033
- Table 55: Global BCI Industry Revenue Million Forecast, by Type 2020 & 2033
- Table 56: Global BCI Industry Volume K Unit Forecast, by Type 2020 & 2033
- Table 57: Global BCI Industry Revenue Million Forecast, by Application 2020 & 2033
- Table 58: Global BCI Industry Volume K Unit Forecast, by Application 2020 & 2033
- Table 59: Global BCI Industry Revenue Million Forecast, by Country 2020 & 2033
- Table 60: Global BCI Industry Volume K Unit Forecast, by Country 2020 & 2033
- Table 61: GCC BCI Industry Revenue (Million) Forecast, by Application 2020 & 2033
- Table 62: GCC BCI Industry Volume (K Unit) Forecast, by Application 2020 & 2033
- Table 63: South Africa BCI Industry Revenue (Million) Forecast, by Application 2020 & 2033
- Table 64: South Africa BCI Industry Volume (K Unit) Forecast, by Application 2020 & 2033
- Table 65: Rest of Middle East and Africa BCI Industry Revenue (Million) Forecast, by Application 2020 & 2033
- Table 66: Rest of Middle East and Africa BCI Industry Volume (K Unit) Forecast, by Application 2020 & 2033
- Table 67: Global BCI Industry Revenue Million Forecast, by Type 2020 & 2033
- Table 68: Global BCI Industry Volume K Unit Forecast, by Type 2020 & 2033
- Table 69: Global BCI Industry Revenue Million Forecast, by Application 2020 & 2033
- Table 70: Global BCI Industry Volume K Unit Forecast, by Application 2020 & 2033
- Table 71: Global BCI Industry Revenue Million Forecast, by Country 2020 & 2033
- Table 72: Global BCI Industry Volume K Unit Forecast, by Country 2020 & 2033
- Table 73: Brazil BCI Industry Revenue (Million) Forecast, by Application 2020 & 2033
- Table 74: Brazil BCI Industry Volume (K Unit) Forecast, by Application 2020 & 2033
- Table 75: Argentina BCI Industry Revenue (Million) Forecast, by Application 2020 & 2033
- Table 76: Argentina BCI Industry Volume (K Unit) Forecast, by Application 2020 & 2033
- Table 77: Rest of South America BCI Industry Revenue (Million) Forecast, by Application 2020 & 2033
- Table 78: Rest of South America BCI Industry Volume (K Unit) Forecast, by Application 2020 & 2033
Frequently Asked Questions
1. What is the projected Compound Annual Growth Rate (CAGR) of the BCI Industry?
The projected CAGR is approximately 10.29%.
2. Which companies are prominent players in the BCI Industry?
Key companies in the market include Emotive Incorporation, ANT Neuro, Integra LifeSciences Corporation, NextMind, MindMaze, NIRx Medical Technologies, Natus Medical Inc, Compumedics Ltd, Medtronic PLC, Advanced Brain Monitoring Inc, NeuroSky, Brain Products GmbH, Cadwell Industries Inc, g tec medical engineering GmbH, Nihon Kohden Corporation.
3. What are the main segments of the BCI Industry?
The market segments include Type, Application.
4. Can you provide details about the market size?
The market size is estimated to be USD 2.00 Million as of 2022.
5. What are some drivers contributing to market growth?
Increasing Prevalence of Neurodegenerative Disorders; Rising R&D Activities by Government to Improve the Brain-computer Interface Technology; Various Technological Advancements such as Miniaturization of Devices.
6. What are the notable trends driving market growth?
The Non-invasive Brain-computer Interface Segment is Expected to Dominate the Market During the Forecast Period.
7. Are there any restraints impacting market growth?
High Cost of Brain-computer Interface Devices; Lack of Expertise in Implementing the Systems.
8. Can you provide examples of recent developments in the market?
N/A
9. What pricing options are available for accessing the report?
Pricing options include single-user, multi-user, and enterprise licenses priced at USD 4750, USD 5250, and USD 8750 respectively.
10. Is the market size provided in terms of value or volume?
The market size is provided in terms of value, measured in Million and volume, measured in K Unit.
11. Are there any specific market keywords associated with the report?
Yes, the market keyword associated with the report is "BCI Industry," which aids in identifying and referencing the specific market segment covered.
12. How do I determine which pricing option suits my needs best?
The pricing options vary based on user requirements and access needs. Individual users may opt for single-user licenses, while businesses requiring broader access may choose multi-user or enterprise licenses for cost-effective access to the report.
13. Are there any additional resources or data provided in the BCI Industry report?
While the report offers comprehensive insights, it's advisable to review the specific contents or supplementary materials provided to ascertain if additional resources or data are available.
14. How can I stay updated on further developments or reports in the BCI Industry?
To stay informed about further developments, trends, and reports in the BCI Industry, consider subscribing to industry newsletters, following relevant companies and organizations, or regularly checking reputable industry news sources and publications.
Methodology
Step 1 - Identification of Relevant Samples Size from Population Database


Step 2 - Approaches for Defining Global Market Size (Value, Volume* & Price*)

Note*: In applicable scenarios
Step 3 - Data Sources
Primary Research
- Web Analytics
- Survey Reports
- Research Institute
- Latest Research Reports
- Opinion Leaders
Secondary Research
- Annual Reports
- White Paper
- Latest Press Release
- Industry Association
- Paid Database
- Investor Presentations

Step 4 - Data Triangulation
Involves using different sources of information in order to increase the validity of a study
These sources are likely to be stakeholders in a program - participants, other researchers, program staff, other community members, and so on.
Then we put all data in single framework & apply various statistical tools to find out the dynamic on the market.
During the analysis stage, feedback from the stakeholder groups would be compared to determine areas of agreement as well as areas of divergence