

Key Insights
The global market for box packaged facial tissues is a mature yet dynamic sector, exhibiting steady growth driven by several key factors. Increased awareness of hygiene and personal health, particularly amplified by recent global events, has significantly boosted demand for disposable facial tissues. This is further fueled by rising disposable incomes in developing economies, leading to increased consumption of convenience products like pre-packaged tissues. The market is segmented by product type (e.g., soft, strong, lotion-enriched), packaging size, and distribution channel (e.g., supermarkets, drugstores, online retailers). While the market faces some constraints such as increasing environmental concerns related to paper waste and fluctuations in raw material prices (primarily pulp), innovation in sustainable packaging and eco-friendly materials is mitigating these concerns. Major players like Procter & Gamble and Kimberly-Clark dominate the market, leveraging strong brand recognition and extensive distribution networks. However, regional variations exist, with North America and Europe currently leading in market share, while emerging markets in Asia and Latin America present significant growth opportunities. The market is projected to maintain a moderate Compound Annual Growth Rate (CAGR) over the forecast period (2025-2033), driven by continued demand and product diversification.
The competitive landscape is characterized by both large multinational corporations and regional players. Large companies invest heavily in research and development to introduce innovative products, such as tissues with added moisturizers or antibacterial properties, catering to evolving consumer preferences. Private label brands are also gaining traction, offering cost-effective alternatives. Future growth will hinge on several factors, including successful marketing strategies focusing on hygiene and convenience, sustainable practices to address environmental concerns, and the ability to adapt to changing consumer preferences and technological advancements. The continuous development and adoption of innovative packaging solutions designed for enhanced hygiene and convenience, coupled with a strategic approach to addressing environmental concerns, will play a crucial role in shaping the future trajectory of the box packaged facial tissue market.
Dominating the Box Packaged Facial Tissues Market: A Comprehensive Report (2019-2033)
This in-depth report provides a comprehensive analysis of the global box packaged facial tissues market, offering invaluable insights for industry stakeholders, investors, and strategic decision-makers. We delve into market dynamics, growth drivers, competitive landscapes, and future projections, covering the period from 2019 to 2033. The report leverages rigorous research methodologies and incorporates extensive data analysis to present actionable intelligence. The global market size is projected to reach xx million units by 2033.
Box Packaged Facial Tissues Market Concentration & Dynamics
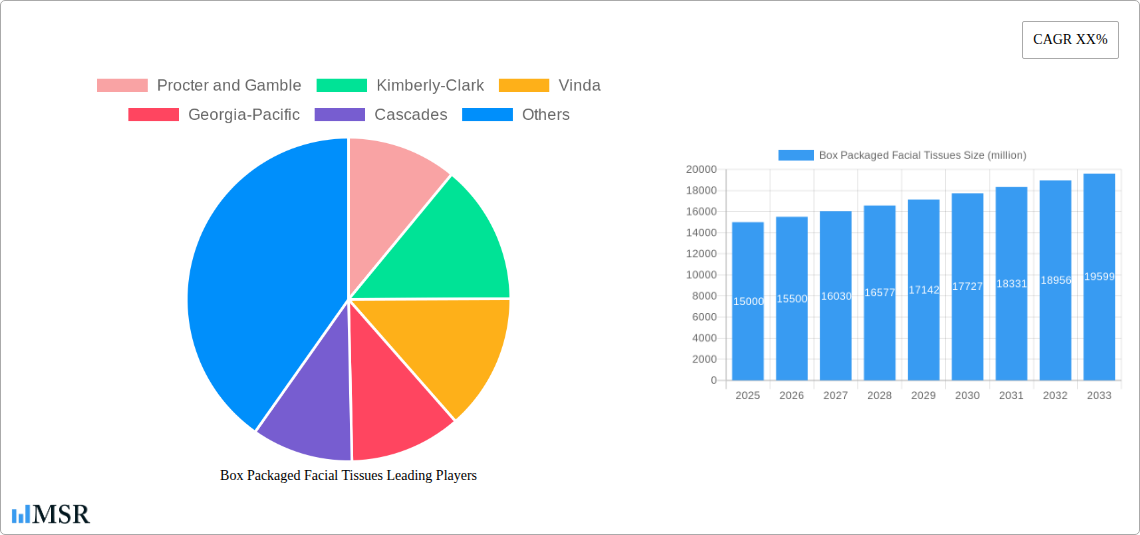
This section analyzes the competitive landscape, encompassing market concentration, innovation, regulatory environments, substitute products, consumer trends, and mergers & acquisitions (M&A) activity within the box packaged facial tissues market. The study period is 2019-2024, with a base year of 2025 and a forecast period spanning 2025-2033. Key players like Procter & Gamble, Kimberly-Clark, Vinda, Georgia-Pacific, Cascades, and Kruger Products are profiled.
Market Concentration: The market exhibits a moderately concentrated structure, with the top five players holding an estimated xx% market share in 2024. This concentration is expected to remain relatively stable through 2033, although smaller players continue to innovate and seek market share gains.
Innovation Ecosystem: Significant innovation is driven by advancements in material science, focusing on sustainability (recycled fibers, biodegradable options), enhanced softness, and improved hygiene features. This is coupled with increasing focus on eco-friendly packaging solutions.
Regulatory Landscape: Regulations related to product safety, labeling requirements, and environmental impact vary across geographies. Compliance requirements and evolving environmental regulations influence product formulations and packaging choices.
Substitute Products: Handkerchiefs, wet wipes, and other personal cleansing products represent some substitute products, although box packaged facial tissues retain a strong market position due to convenience and affordability.
End-User Trends: Consumer preferences are shifting toward eco-friendly, hypoallergenic, and value-added options. Demand for premium, high-quality tissues is steadily increasing.
M&A Activity: Between 2019 and 2024, there were approximately xx M&A deals within the box packaged facial tissues sector. These deals primarily involved smaller companies being acquired by larger players looking to expand their product portfolios or geographical reach.
Box Packaged Facial Tissues Industry Insights & Trends
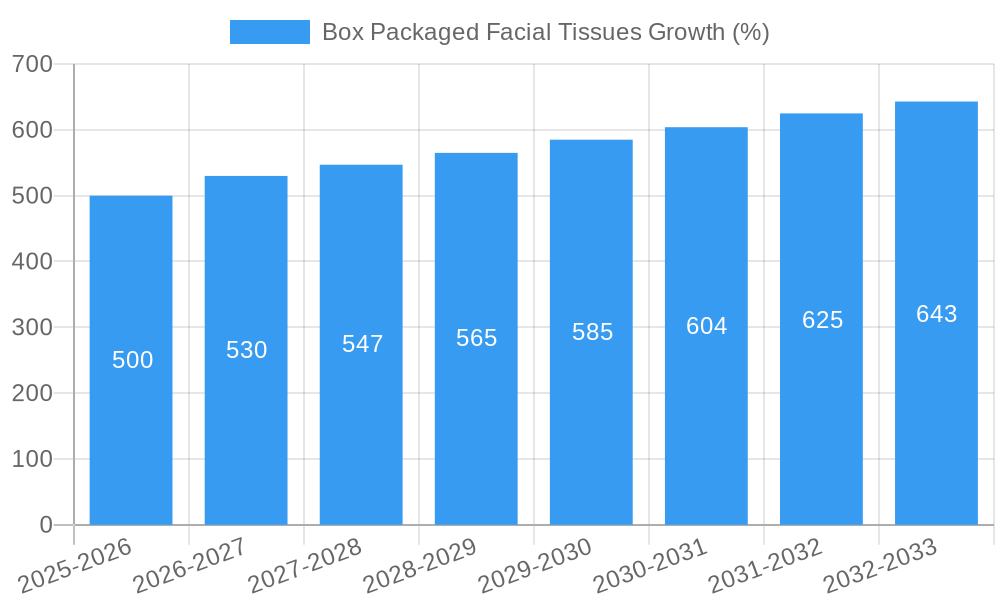
This section details the growth drivers, technological disruptions, and evolving consumer behaviors shaping the box packaged facial tissues market. The market is projected to register a CAGR of xx% during the forecast period (2025-2033).
The market's growth is propelled by factors such as rising disposable incomes, particularly in developing economies, increasing awareness of hygiene, and the continuous demand for convenient and affordable personal care products. Technological disruptions, while not as profound as in other sectors, are focused on improving production efficiency, sustainable manufacturing practices, and innovative packaging solutions. Evolving consumer behaviors highlight a growing preference for eco-friendly products, premium quality, and personalized options, influencing product development and marketing strategies. The global market size in 2025 is estimated at xx million units, indicating significant growth potential.
Key Markets & Segments Leading Box Packaged Facial Tissues
This section identifies the dominant regions, countries, or segments within the box packaged facial tissues market.
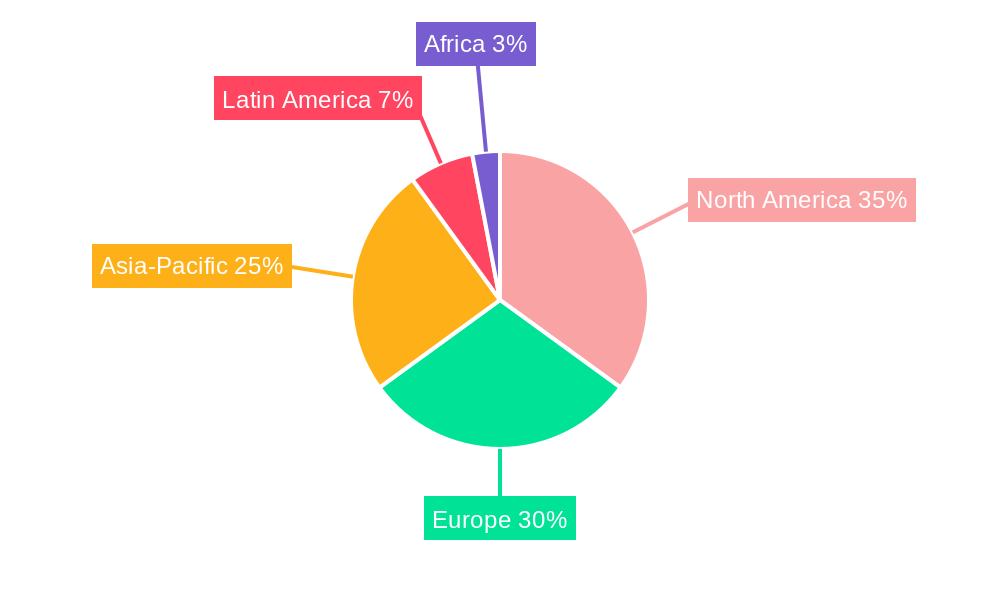
Dominant Region/Country: North America currently holds the largest market share, driven by strong consumer demand and a well-established distribution network. Asia-Pacific is expected to exhibit the highest growth rate during the forecast period.
Growth Drivers by Region:
- North America: High disposable incomes, strong brand loyalty, and established distribution channels.
- Europe: Growing awareness of hygiene and increasing demand for premium products.
- Asia-Pacific: Rapid economic growth, rising disposable incomes, and a large, expanding consumer base.
- Rest of World: Growing awareness of hygiene, but hampered by lower disposable incomes in some regions.
The dominance of North America is primarily attributed to high per capita consumption, a robust retail infrastructure, and established market presence of major players. Asia-Pacific, however, is projected to overtake North America in terms of market size by 2033, driven by rapid urbanization, rising disposable incomes, and a burgeoning middle class.
Box Packaged Facial Tissues Product Developments
Recent product innovations include the introduction of tissues with enhanced softness, improved absorbency, and hypoallergenic properties. Technological advancements in material science and manufacturing processes have facilitated the development of sustainable and eco-friendly options, such as recycled fiber tissues and biodegradable packaging. These innovations aim to meet the evolving needs and preferences of consumers while mitigating the environmental impact of production. Competitive differentiation is increasingly achieved through the incorporation of value-added features, unique designs, and strategic branding.
Challenges in the Box Packaged Facial Tissues Market
The market faces challenges including fluctuating raw material prices, increasing transportation costs, and intensifying competition from substitute products. Stringent environmental regulations and the growing pressure to adopt sustainable practices present additional hurdles. Supply chain disruptions can lead to production delays and increased costs, impacting profitability. The overall market share is impacted by these issues, with a potential loss of xx million units annually due to price fluctuations.
Forces Driving Box Packaged Facial Tissues Growth
Key growth drivers include rising disposable incomes in developing economies, growing awareness of hygiene and health, increasing demand for convenient and affordable personal care products, and the ongoing innovation in product design and packaging. Government initiatives promoting hygiene and public health also positively influence market growth. Specific examples include the growth of the middle class in Asia and increasing awareness of hygiene standards in emerging markets.
Long-Term Growth Catalysts in the Box Packaged Facial Tissues Market
Long-term growth hinges on continuing innovation in product functionality and sustainability, strategic partnerships to expand distribution networks, and expansion into new geographic markets. The development of eco-friendly packaging solutions will play a critical role, as will the continued focus on product differentiation to meet diverse consumer preferences. The increasing adoption of e-commerce platforms also presents a significant growth opportunity.
Emerging Opportunities in Box Packaged Facial Tissues
Emerging opportunities lie in developing specialized tissues for specific needs (e.g., sensitive skin, allergy sufferers), expanding into premium segments with innovative features and enhanced value propositions, and leveraging digital channels to reach a broader consumer base. Exploring new markets with untapped potential in developing economies and creating strategic alliances for market penetration represent significant opportunities.
Leading Players in the Box Packaged Facial Tissues Sector
- Procter & Gamble
- Kimberly-Clark
- Vinda
- Georgia-Pacific
- Cascades
- Kruger Products
Key Milestones in Box Packaged Facial Tissues Industry
- 2020: Increased focus on sustainable packaging and recycled materials by several key players.
- 2021: Launch of several new product lines with enhanced softness and absorbency.
- 2022: Several acquisitions of smaller tissue companies by larger corporations to expand market reach.
- 2023: Increased investment in research and development to develop more sustainable and innovative products.
- 2024: Significant expansion of e-commerce channels by major players.
Strategic Outlook for Box Packaged Facial Tissues Market
The future of the box packaged facial tissues market is bright, driven by a combination of factors including growing global population, rising disposable incomes, increasing hygiene awareness, and the continued innovation in product design and packaging. Strategic opportunities lie in developing sustainable and eco-friendly products, expanding into high-growth markets, and capitalizing on the growing demand for premium and value-added products. The market is poised for robust growth, with significant potential for expansion and profitability.
Box Packaged Facial Tissues Segmentation
-
1. Application
- 1.1. Online Sales
- 1.2. Offline Sales
-
2. Types
- 2.1. Regular Facial Tissues
- 2.2. Anti-Viral Facial Tissues
- 2.3. Recyclable Facial Tissues
Box Packaged Facial Tissues Segmentation By Geography
-
1. North America
- 1.1. United States
- 1.2. Canada
- 1.3. Mexico
-
2. South America
- 2.1. Brazil
- 2.2. Argentina
- 2.3. Rest of South America
-
3. Europe
- 3.1. United Kingdom
- 3.2. Germany
- 3.3. France
- 3.4. Italy
- 3.5. Spain
- 3.6. Russia
- 3.7. Benelux
- 3.8. Nordics
- 3.9. Rest of Europe
-
4. Middle East & Africa
- 4.1. Turkey
- 4.2. Israel
- 4.3. GCC
- 4.4. North Africa
- 4.5. South Africa
- 4.6. Rest of Middle East & Africa
-
5. Asia Pacific
- 5.1. China
- 5.2. India
- 5.3. Japan
- 5.4. South Korea
- 5.5. ASEAN
- 5.6. Oceania
- 5.7. Rest of Asia Pacific
Box Packaged Facial Tissues REPORT HIGHLIGHTS
| Aspects | Details |
|---|---|
| Study Period | 2019-2033 |
| Base Year | 2024 |
| Estimated Year | 2025 |
| Forecast Period | 2025-2033 |
| Historical Period | 2019-2024 |
| Growth Rate | CAGR of XX% from 2019-2033 |
| Segmentation |
|
Table of Contents
- 1. Introduction
- 1.1. Research Scope
- 1.2. Market Segmentation
- 1.3. Research Methodology
- 1.4. Definitions and Assumptions
- 2. Executive Summary
- 2.1. Introduction
- 3. Market Dynamics
- 3.1. Introduction
- 3.2. Market Drivers
- 3.3. Market Restrains
- 3.4. Market Trends
- 4. Market Factor Analysis
- 4.1. Porters Five Forces
- 4.2. Supply/Value Chain
- 4.3. PESTEL analysis
- 4.4. Market Entropy
- 4.5. Patent/Trademark Analysis
- 5. Global Box Packaged Facial Tissues Analysis, Insights and Forecast, 2019-2031
- 5.1. Market Analysis, Insights and Forecast - by Application
- 5.1.1. Online Sales
- 5.1.2. Offline Sales
- 5.2. Market Analysis, Insights and Forecast - by Types
- 5.2.1. Regular Facial Tissues
- 5.2.2. Anti-Viral Facial Tissues
- 5.2.3. Recyclable Facial Tissues
- 5.3. Market Analysis, Insights and Forecast - by Region
- 5.3.1. North America
- 5.3.2. South America
- 5.3.3. Europe
- 5.3.4. Middle East & Africa
- 5.3.5. Asia Pacific
- 5.1. Market Analysis, Insights and Forecast - by Application
- 6. North America Box Packaged Facial Tissues Analysis, Insights and Forecast, 2019-2031
- 6.1. Market Analysis, Insights and Forecast - by Application
- 6.1.1. Online Sales
- 6.1.2. Offline Sales
- 6.2. Market Analysis, Insights and Forecast - by Types
- 6.2.1. Regular Facial Tissues
- 6.2.2. Anti-Viral Facial Tissues
- 6.2.3. Recyclable Facial Tissues
- 6.1. Market Analysis, Insights and Forecast - by Application
- 7. South America Box Packaged Facial Tissues Analysis, Insights and Forecast, 2019-2031
- 7.1. Market Analysis, Insights and Forecast - by Application
- 7.1.1. Online Sales
- 7.1.2. Offline Sales
- 7.2. Market Analysis, Insights and Forecast - by Types
- 7.2.1. Regular Facial Tissues
- 7.2.2. Anti-Viral Facial Tissues
- 7.2.3. Recyclable Facial Tissues
- 7.1. Market Analysis, Insights and Forecast - by Application
- 8. Europe Box Packaged Facial Tissues Analysis, Insights and Forecast, 2019-2031
- 8.1. Market Analysis, Insights and Forecast - by Application
- 8.1.1. Online Sales
- 8.1.2. Offline Sales
- 8.2. Market Analysis, Insights and Forecast - by Types
- 8.2.1. Regular Facial Tissues
- 8.2.2. Anti-Viral Facial Tissues
- 8.2.3. Recyclable Facial Tissues
- 8.1. Market Analysis, Insights and Forecast - by Application
- 9. Middle East & Africa Box Packaged Facial Tissues Analysis, Insights and Forecast, 2019-2031
- 9.1. Market Analysis, Insights and Forecast - by Application
- 9.1.1. Online Sales
- 9.1.2. Offline Sales
- 9.2. Market Analysis, Insights and Forecast - by Types
- 9.2.1. Regular Facial Tissues
- 9.2.2. Anti-Viral Facial Tissues
- 9.2.3. Recyclable Facial Tissues
- 9.1. Market Analysis, Insights and Forecast - by Application
- 10. Asia Pacific Box Packaged Facial Tissues Analysis, Insights and Forecast, 2019-2031
- 10.1. Market Analysis, Insights and Forecast - by Application
- 10.1.1. Online Sales
- 10.1.2. Offline Sales
- 10.2. Market Analysis, Insights and Forecast - by Types
- 10.2.1. Regular Facial Tissues
- 10.2.2. Anti-Viral Facial Tissues
- 10.2.3. Recyclable Facial Tissues
- 10.1. Market Analysis, Insights and Forecast - by Application
- 11. Competitive Analysis
- 11.1. Global Market Share Analysis 2024
- 11.2. Company Profiles
- 11.2.1 Procter and Gamble
- 11.2.1.1. Overview
- 11.2.1.2. Products
- 11.2.1.3. SWOT Analysis
- 11.2.1.4. Recent Developments
- 11.2.1.5. Financials (Based on Availability)
- 11.2.2 Kimberly-Clark
- 11.2.2.1. Overview
- 11.2.2.2. Products
- 11.2.2.3. SWOT Analysis
- 11.2.2.4. Recent Developments
- 11.2.2.5. Financials (Based on Availability)
- 11.2.3 Vinda
- 11.2.3.1. Overview
- 11.2.3.2. Products
- 11.2.3.3. SWOT Analysis
- 11.2.3.4. Recent Developments
- 11.2.3.5. Financials (Based on Availability)
- 11.2.4 Georgia-Pacific
- 11.2.4.1. Overview
- 11.2.4.2. Products
- 11.2.4.3. SWOT Analysis
- 11.2.4.4. Recent Developments
- 11.2.4.5. Financials (Based on Availability)
- 11.2.5 Cascades
- 11.2.5.1. Overview
- 11.2.5.2. Products
- 11.2.5.3. SWOT Analysis
- 11.2.5.4. Recent Developments
- 11.2.5.5. Financials (Based on Availability)
- 11.2.6 Kruger Products
- 11.2.6.1. Overview
- 11.2.6.2. Products
- 11.2.6.3. SWOT Analysis
- 11.2.6.4. Recent Developments
- 11.2.6.5. Financials (Based on Availability)
- 11.2.1 Procter and Gamble
List of Figures
- Figure 1: Global Box Packaged Facial Tissues Revenue Breakdown (million, %) by Region 2024 & 2032
- Figure 2: Global Box Packaged Facial Tissues Volume Breakdown (K, %) by Region 2024 & 2032
- Figure 3: North America Box Packaged Facial Tissues Revenue (million), by Application 2024 & 2032
- Figure 4: North America Box Packaged Facial Tissues Volume (K), by Application 2024 & 2032
- Figure 5: North America Box Packaged Facial Tissues Revenue Share (%), by Application 2024 & 2032
- Figure 6: North America Box Packaged Facial Tissues Volume Share (%), by Application 2024 & 2032
- Figure 7: North America Box Packaged Facial Tissues Revenue (million), by Types 2024 & 2032
- Figure 8: North America Box Packaged Facial Tissues Volume (K), by Types 2024 & 2032
- Figure 9: North America Box Packaged Facial Tissues Revenue Share (%), by Types 2024 & 2032
- Figure 10: North America Box Packaged Facial Tissues Volume Share (%), by Types 2024 & 2032
- Figure 11: North America Box Packaged Facial Tissues Revenue (million), by Country 2024 & 2032
- Figure 12: North America Box Packaged Facial Tissues Volume (K), by Country 2024 & 2032
- Figure 13: North America Box Packaged Facial Tissues Revenue Share (%), by Country 2024 & 2032
- Figure 14: North America Box Packaged Facial Tissues Volume Share (%), by Country 2024 & 2032
- Figure 15: South America Box Packaged Facial Tissues Revenue (million), by Application 2024 & 2032
- Figure 16: South America Box Packaged Facial Tissues Volume (K), by Application 2024 & 2032
- Figure 17: South America Box Packaged Facial Tissues Revenue Share (%), by Application 2024 & 2032
- Figure 18: South America Box Packaged Facial Tissues Volume Share (%), by Application 2024 & 2032
- Figure 19: South America Box Packaged Facial Tissues Revenue (million), by Types 2024 & 2032
- Figure 20: South America Box Packaged Facial Tissues Volume (K), by Types 2024 & 2032
- Figure 21: South America Box Packaged Facial Tissues Revenue Share (%), by Types 2024 & 2032
- Figure 22: South America Box Packaged Facial Tissues Volume Share (%), by Types 2024 & 2032
- Figure 23: South America Box Packaged Facial Tissues Revenue (million), by Country 2024 & 2032
- Figure 24: South America Box Packaged Facial Tissues Volume (K), by Country 2024 & 2032
- Figure 25: South America Box Packaged Facial Tissues Revenue Share (%), by Country 2024 & 2032
- Figure 26: South America Box Packaged Facial Tissues Volume Share (%), by Country 2024 & 2032
- Figure 27: Europe Box Packaged Facial Tissues Revenue (million), by Application 2024 & 2032
- Figure 28: Europe Box Packaged Facial Tissues Volume (K), by Application 2024 & 2032
- Figure 29: Europe Box Packaged Facial Tissues Revenue Share (%), by Application 2024 & 2032
- Figure 30: Europe Box Packaged Facial Tissues Volume Share (%), by Application 2024 & 2032
- Figure 31: Europe Box Packaged Facial Tissues Revenue (million), by Types 2024 & 2032
- Figure 32: Europe Box Packaged Facial Tissues Volume (K), by Types 2024 & 2032
- Figure 33: Europe Box Packaged Facial Tissues Revenue Share (%), by Types 2024 & 2032
- Figure 34: Europe Box Packaged Facial Tissues Volume Share (%), by Types 2024 & 2032
- Figure 35: Europe Box Packaged Facial Tissues Revenue (million), by Country 2024 & 2032
- Figure 36: Europe Box Packaged Facial Tissues Volume (K), by Country 2024 & 2032
- Figure 37: Europe Box Packaged Facial Tissues Revenue Share (%), by Country 2024 & 2032
- Figure 38: Europe Box Packaged Facial Tissues Volume Share (%), by Country 2024 & 2032
- Figure 39: Middle East & Africa Box Packaged Facial Tissues Revenue (million), by Application 2024 & 2032
- Figure 40: Middle East & Africa Box Packaged Facial Tissues Volume (K), by Application 2024 & 2032
- Figure 41: Middle East & Africa Box Packaged Facial Tissues Revenue Share (%), by Application 2024 & 2032
- Figure 42: Middle East & Africa Box Packaged Facial Tissues Volume Share (%), by Application 2024 & 2032
- Figure 43: Middle East & Africa Box Packaged Facial Tissues Revenue (million), by Types 2024 & 2032
- Figure 44: Middle East & Africa Box Packaged Facial Tissues Volume (K), by Types 2024 & 2032
- Figure 45: Middle East & Africa Box Packaged Facial Tissues Revenue Share (%), by Types 2024 & 2032
- Figure 46: Middle East & Africa Box Packaged Facial Tissues Volume Share (%), by Types 2024 & 2032
- Figure 47: Middle East & Africa Box Packaged Facial Tissues Revenue (million), by Country 2024 & 2032
- Figure 48: Middle East & Africa Box Packaged Facial Tissues Volume (K), by Country 2024 & 2032
- Figure 49: Middle East & Africa Box Packaged Facial Tissues Revenue Share (%), by Country 2024 & 2032
- Figure 50: Middle East & Africa Box Packaged Facial Tissues Volume Share (%), by Country 2024 & 2032
- Figure 51: Asia Pacific Box Packaged Facial Tissues Revenue (million), by Application 2024 & 2032
- Figure 52: Asia Pacific Box Packaged Facial Tissues Volume (K), by Application 2024 & 2032
- Figure 53: Asia Pacific Box Packaged Facial Tissues Revenue Share (%), by Application 2024 & 2032
- Figure 54: Asia Pacific Box Packaged Facial Tissues Volume Share (%), by Application 2024 & 2032
- Figure 55: Asia Pacific Box Packaged Facial Tissues Revenue (million), by Types 2024 & 2032
- Figure 56: Asia Pacific Box Packaged Facial Tissues Volume (K), by Types 2024 & 2032
- Figure 57: Asia Pacific Box Packaged Facial Tissues Revenue Share (%), by Types 2024 & 2032
- Figure 58: Asia Pacific Box Packaged Facial Tissues Volume Share (%), by Types 2024 & 2032
- Figure 59: Asia Pacific Box Packaged Facial Tissues Revenue (million), by Country 2024 & 2032
- Figure 60: Asia Pacific Box Packaged Facial Tissues Volume (K), by Country 2024 & 2032
- Figure 61: Asia Pacific Box Packaged Facial Tissues Revenue Share (%), by Country 2024 & 2032
- Figure 62: Asia Pacific Box Packaged Facial Tissues Volume Share (%), by Country 2024 & 2032
List of Tables
- Table 1: Global Box Packaged Facial Tissues Revenue million Forecast, by Region 2019 & 2032
- Table 2: Global Box Packaged Facial Tissues Volume K Forecast, by Region 2019 & 2032
- Table 3: Global Box Packaged Facial Tissues Revenue million Forecast, by Application 2019 & 2032
- Table 4: Global Box Packaged Facial Tissues Volume K Forecast, by Application 2019 & 2032
- Table 5: Global Box Packaged Facial Tissues Revenue million Forecast, by Types 2019 & 2032
- Table 6: Global Box Packaged Facial Tissues Volume K Forecast, by Types 2019 & 2032
- Table 7: Global Box Packaged Facial Tissues Revenue million Forecast, by Region 2019 & 2032
- Table 8: Global Box Packaged Facial Tissues Volume K Forecast, by Region 2019 & 2032
- Table 9: Global Box Packaged Facial Tissues Revenue million Forecast, by Application 2019 & 2032
- Table 10: Global Box Packaged Facial Tissues Volume K Forecast, by Application 2019 & 2032
- Table 11: Global Box Packaged Facial Tissues Revenue million Forecast, by Types 2019 & 2032
- Table 12: Global Box Packaged Facial Tissues Volume K Forecast, by Types 2019 & 2032
- Table 13: Global Box Packaged Facial Tissues Revenue million Forecast, by Country 2019 & 2032
- Table 14: Global Box Packaged Facial Tissues Volume K Forecast, by Country 2019 & 2032
- Table 15: United States Box Packaged Facial Tissues Revenue (million) Forecast, by Application 2019 & 2032
- Table 16: United States Box Packaged Facial Tissues Volume (K) Forecast, by Application 2019 & 2032
- Table 17: Canada Box Packaged Facial Tissues Revenue (million) Forecast, by Application 2019 & 2032
- Table 18: Canada Box Packaged Facial Tissues Volume (K) Forecast, by Application 2019 & 2032
- Table 19: Mexico Box Packaged Facial Tissues Revenue (million) Forecast, by Application 2019 & 2032
- Table 20: Mexico Box Packaged Facial Tissues Volume (K) Forecast, by Application 2019 & 2032
- Table 21: Global Box Packaged Facial Tissues Revenue million Forecast, by Application 2019 & 2032
- Table 22: Global Box Packaged Facial Tissues Volume K Forecast, by Application 2019 & 2032
- Table 23: Global Box Packaged Facial Tissues Revenue million Forecast, by Types 2019 & 2032
- Table 24: Global Box Packaged Facial Tissues Volume K Forecast, by Types 2019 & 2032
- Table 25: Global Box Packaged Facial Tissues Revenue million Forecast, by Country 2019 & 2032
- Table 26: Global Box Packaged Facial Tissues Volume K Forecast, by Country 2019 & 2032
- Table 27: Brazil Box Packaged Facial Tissues Revenue (million) Forecast, by Application 2019 & 2032
- Table 28: Brazil Box Packaged Facial Tissues Volume (K) Forecast, by Application 2019 & 2032
- Table 29: Argentina Box Packaged Facial Tissues Revenue (million) Forecast, by Application 2019 & 2032
- Table 30: Argentina Box Packaged Facial Tissues Volume (K) Forecast, by Application 2019 & 2032
- Table 31: Rest of South America Box Packaged Facial Tissues Revenue (million) Forecast, by Application 2019 & 2032
- Table 32: Rest of South America Box Packaged Facial Tissues Volume (K) Forecast, by Application 2019 & 2032
- Table 33: Global Box Packaged Facial Tissues Revenue million Forecast, by Application 2019 & 2032
- Table 34: Global Box Packaged Facial Tissues Volume K Forecast, by Application 2019 & 2032
- Table 35: Global Box Packaged Facial Tissues Revenue million Forecast, by Types 2019 & 2032
- Table 36: Global Box Packaged Facial Tissues Volume K Forecast, by Types 2019 & 2032
- Table 37: Global Box Packaged Facial Tissues Revenue million Forecast, by Country 2019 & 2032
- Table 38: Global Box Packaged Facial Tissues Volume K Forecast, by Country 2019 & 2032
- Table 39: United Kingdom Box Packaged Facial Tissues Revenue (million) Forecast, by Application 2019 & 2032
- Table 40: United Kingdom Box Packaged Facial Tissues Volume (K) Forecast, by Application 2019 & 2032
- Table 41: Germany Box Packaged Facial Tissues Revenue (million) Forecast, by Application 2019 & 2032
- Table 42: Germany Box Packaged Facial Tissues Volume (K) Forecast, by Application 2019 & 2032
- Table 43: France Box Packaged Facial Tissues Revenue (million) Forecast, by Application 2019 & 2032
- Table 44: France Box Packaged Facial Tissues Volume (K) Forecast, by Application 2019 & 2032
- Table 45: Italy Box Packaged Facial Tissues Revenue (million) Forecast, by Application 2019 & 2032
- Table 46: Italy Box Packaged Facial Tissues Volume (K) Forecast, by Application 2019 & 2032
- Table 47: Spain Box Packaged Facial Tissues Revenue (million) Forecast, by Application 2019 & 2032
- Table 48: Spain Box Packaged Facial Tissues Volume (K) Forecast, by Application 2019 & 2032
- Table 49: Russia Box Packaged Facial Tissues Revenue (million) Forecast, by Application 2019 & 2032
- Table 50: Russia Box Packaged Facial Tissues Volume (K) Forecast, by Application 2019 & 2032
- Table 51: Benelux Box Packaged Facial Tissues Revenue (million) Forecast, by Application 2019 & 2032
- Table 52: Benelux Box Packaged Facial Tissues Volume (K) Forecast, by Application 2019 & 2032
- Table 53: Nordics Box Packaged Facial Tissues Revenue (million) Forecast, by Application 2019 & 2032
- Table 54: Nordics Box Packaged Facial Tissues Volume (K) Forecast, by Application 2019 & 2032
- Table 55: Rest of Europe Box Packaged Facial Tissues Revenue (million) Forecast, by Application 2019 & 2032
- Table 56: Rest of Europe Box Packaged Facial Tissues Volume (K) Forecast, by Application 2019 & 2032
- Table 57: Global Box Packaged Facial Tissues Revenue million Forecast, by Application 2019 & 2032
- Table 58: Global Box Packaged Facial Tissues Volume K Forecast, by Application 2019 & 2032
- Table 59: Global Box Packaged Facial Tissues Revenue million Forecast, by Types 2019 & 2032
- Table 60: Global Box Packaged Facial Tissues Volume K Forecast, by Types 2019 & 2032
- Table 61: Global Box Packaged Facial Tissues Revenue million Forecast, by Country 2019 & 2032
- Table 62: Global Box Packaged Facial Tissues Volume K Forecast, by Country 2019 & 2032
- Table 63: Turkey Box Packaged Facial Tissues Revenue (million) Forecast, by Application 2019 & 2032
- Table 64: Turkey Box Packaged Facial Tissues Volume (K) Forecast, by Application 2019 & 2032
- Table 65: Israel Box Packaged Facial Tissues Revenue (million) Forecast, by Application 2019 & 2032
- Table 66: Israel Box Packaged Facial Tissues Volume (K) Forecast, by Application 2019 & 2032
- Table 67: GCC Box Packaged Facial Tissues Revenue (million) Forecast, by Application 2019 & 2032
- Table 68: GCC Box Packaged Facial Tissues Volume (K) Forecast, by Application 2019 & 2032
- Table 69: North Africa Box Packaged Facial Tissues Revenue (million) Forecast, by Application 2019 & 2032
- Table 70: North Africa Box Packaged Facial Tissues Volume (K) Forecast, by Application 2019 & 2032
- Table 71: South Africa Box Packaged Facial Tissues Revenue (million) Forecast, by Application 2019 & 2032
- Table 72: South Africa Box Packaged Facial Tissues Volume (K) Forecast, by Application 2019 & 2032
- Table 73: Rest of Middle East & Africa Box Packaged Facial Tissues Revenue (million) Forecast, by Application 2019 & 2032
- Table 74: Rest of Middle East & Africa Box Packaged Facial Tissues Volume (K) Forecast, by Application 2019 & 2032
- Table 75: Global Box Packaged Facial Tissues Revenue million Forecast, by Application 2019 & 2032
- Table 76: Global Box Packaged Facial Tissues Volume K Forecast, by Application 2019 & 2032
- Table 77: Global Box Packaged Facial Tissues Revenue million Forecast, by Types 2019 & 2032
- Table 78: Global Box Packaged Facial Tissues Volume K Forecast, by Types 2019 & 2032
- Table 79: Global Box Packaged Facial Tissues Revenue million Forecast, by Country 2019 & 2032
- Table 80: Global Box Packaged Facial Tissues Volume K Forecast, by Country 2019 & 2032
- Table 81: China Box Packaged Facial Tissues Revenue (million) Forecast, by Application 2019 & 2032
- Table 82: China Box Packaged Facial Tissues Volume (K) Forecast, by Application 2019 & 2032
- Table 83: India Box Packaged Facial Tissues Revenue (million) Forecast, by Application 2019 & 2032
- Table 84: India Box Packaged Facial Tissues Volume (K) Forecast, by Application 2019 & 2032
- Table 85: Japan Box Packaged Facial Tissues Revenue (million) Forecast, by Application 2019 & 2032
- Table 86: Japan Box Packaged Facial Tissues Volume (K) Forecast, by Application 2019 & 2032
- Table 87: South Korea Box Packaged Facial Tissues Revenue (million) Forecast, by Application 2019 & 2032
- Table 88: South Korea Box Packaged Facial Tissues Volume (K) Forecast, by Application 2019 & 2032
- Table 89: ASEAN Box Packaged Facial Tissues Revenue (million) Forecast, by Application 2019 & 2032
- Table 90: ASEAN Box Packaged Facial Tissues Volume (K) Forecast, by Application 2019 & 2032
- Table 91: Oceania Box Packaged Facial Tissues Revenue (million) Forecast, by Application 2019 & 2032
- Table 92: Oceania Box Packaged Facial Tissues Volume (K) Forecast, by Application 2019 & 2032
- Table 93: Rest of Asia Pacific Box Packaged Facial Tissues Revenue (million) Forecast, by Application 2019 & 2032
- Table 94: Rest of Asia Pacific Box Packaged Facial Tissues Volume (K) Forecast, by Application 2019 & 2032
Frequently Asked Questions
1. What is the projected Compound Annual Growth Rate (CAGR) of the Box Packaged Facial Tissues?
The projected CAGR is approximately XX%.
2. Which companies are prominent players in the Box Packaged Facial Tissues?
Key companies in the market include Procter and Gamble, Kimberly-Clark, Vinda, Georgia-Pacific, Cascades, Kruger Products.
3. What are the main segments of the Box Packaged Facial Tissues?
The market segments include Application, Types.
4. Can you provide details about the market size?
The market size is estimated to be USD XXX million as of 2022.
5. What are some drivers contributing to market growth?
N/A
6. What are the notable trends driving market growth?
N/A
7. Are there any restraints impacting market growth?
N/A
8. Can you provide examples of recent developments in the market?
N/A
9. What pricing options are available for accessing the report?
Pricing options include single-user, multi-user, and enterprise licenses priced at USD 3350.00, USD 5025.00, and USD 6700.00 respectively.
10. Is the market size provided in terms of value or volume?
The market size is provided in terms of value, measured in million and volume, measured in K.
11. Are there any specific market keywords associated with the report?
Yes, the market keyword associated with the report is "Box Packaged Facial Tissues," which aids in identifying and referencing the specific market segment covered.
12. How do I determine which pricing option suits my needs best?
The pricing options vary based on user requirements and access needs. Individual users may opt for single-user licenses, while businesses requiring broader access may choose multi-user or enterprise licenses for cost-effective access to the report.
13. Are there any additional resources or data provided in the Box Packaged Facial Tissues report?
While the report offers comprehensive insights, it's advisable to review the specific contents or supplementary materials provided to ascertain if additional resources or data are available.
14. How can I stay updated on further developments or reports in the Box Packaged Facial Tissues?
To stay informed about further developments, trends, and reports in the Box Packaged Facial Tissues, consider subscribing to industry newsletters, following relevant companies and organizations, or regularly checking reputable industry news sources and publications.
Methodology
Step 1 - Identification of Relevant Samples Size from Population Database


Step 2 - Approaches for Defining Global Market Size (Value, Volume* & Price*)

Note*: In applicable scenarios
Step 3 - Data Sources
Primary Research
- Web Analytics
- Survey Reports
- Research Institute
- Latest Research Reports
- Opinion Leaders
Secondary Research
- Annual Reports
- White Paper
- Latest Press Release
- Industry Association
- Paid Database
- Investor Presentations

Step 4 - Data Triangulation
Involves using different sources of information in order to increase the validity of a study
These sources are likely to be stakeholders in a program - participants, other researchers, program staff, other community members, and so on.
Then we put all data in single framework & apply various statistical tools to find out the dynamic on the market.
During the analysis stage, feedback from the stakeholder groups would be compared to determine areas of agreement as well as areas of divergence
