

Key Insights
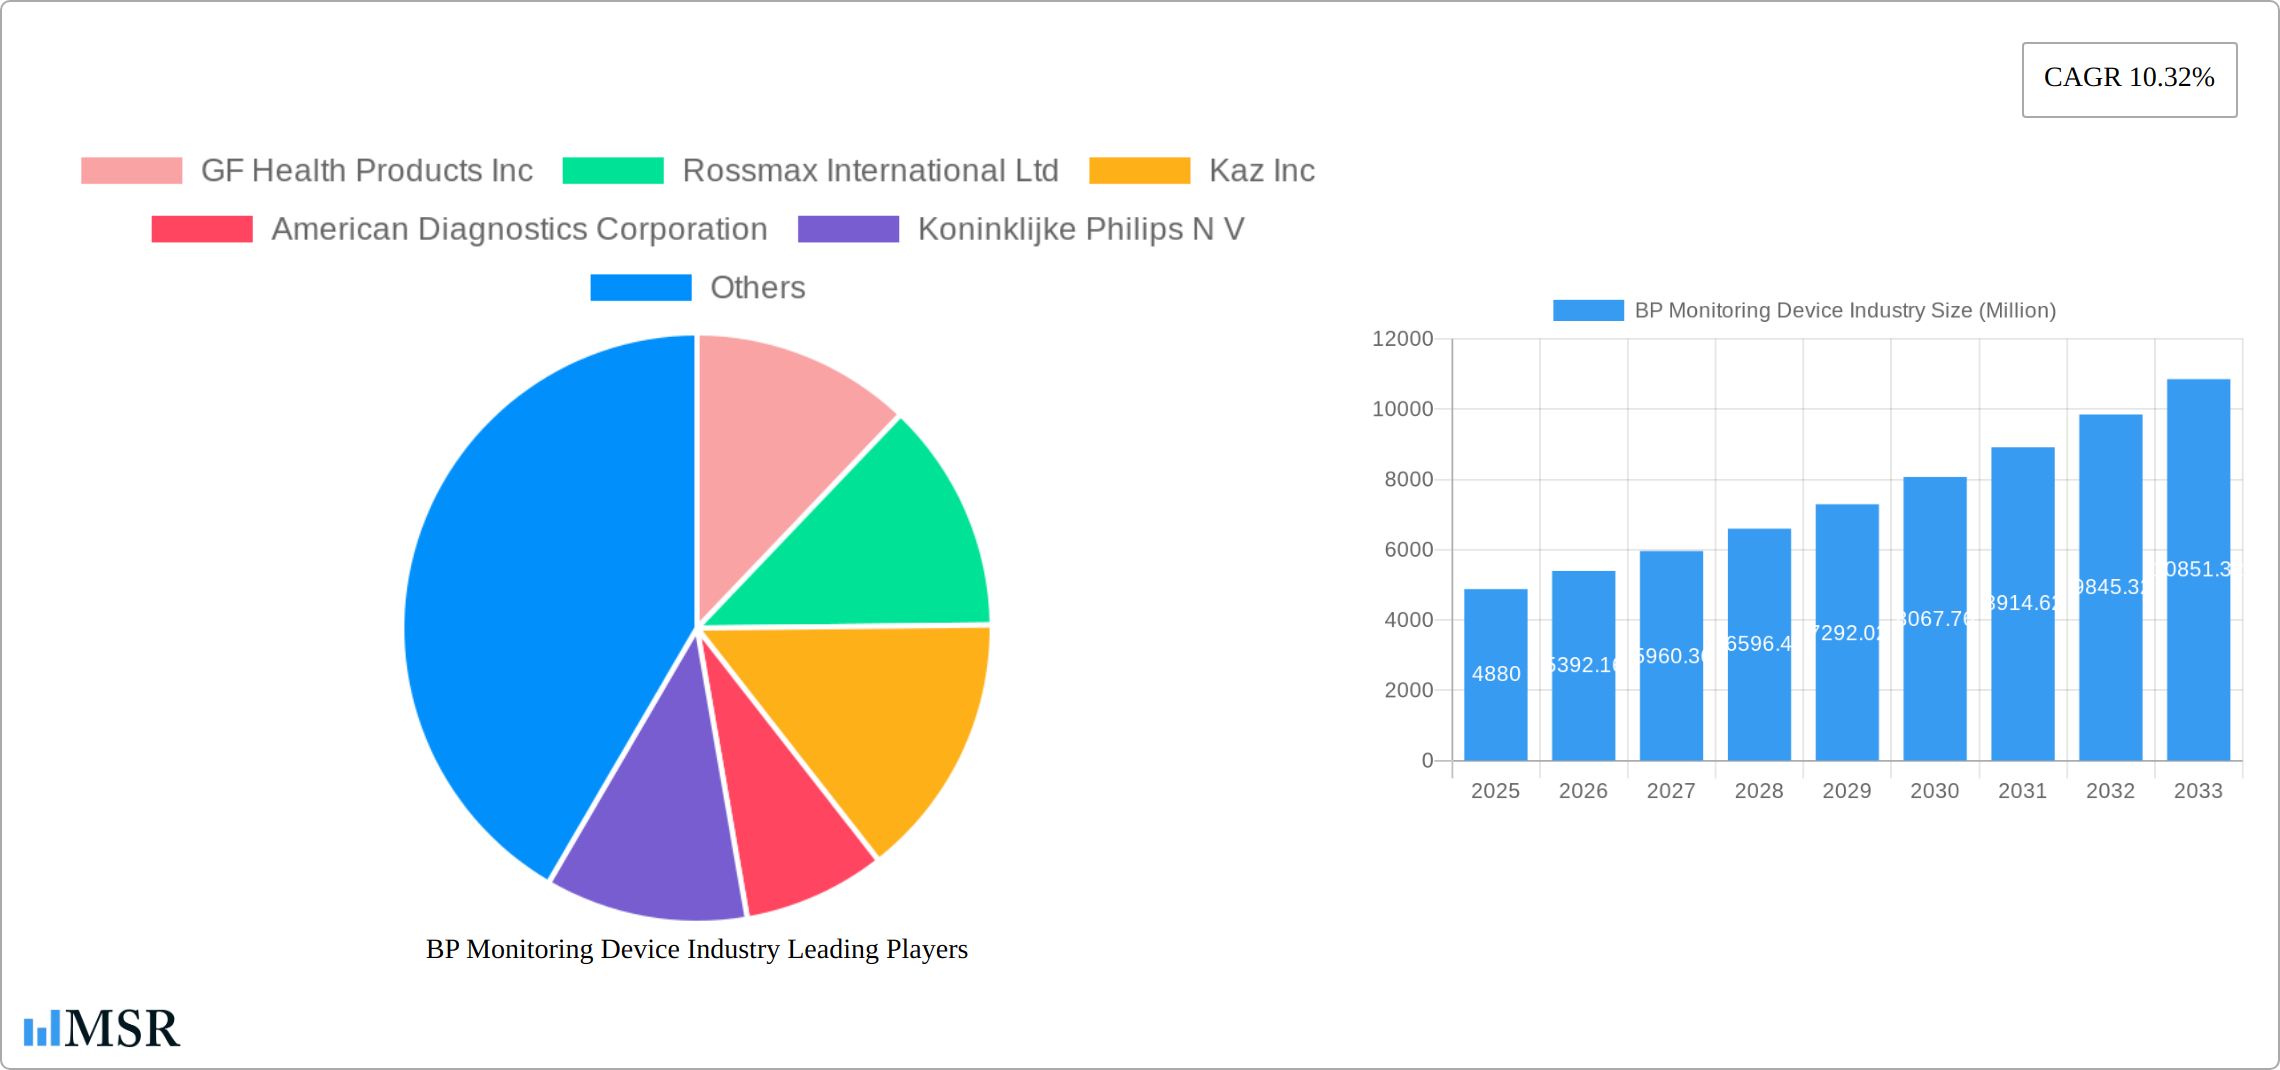
The global blood pressure (BP) monitoring device market, valued at $4.88 billion in 2025, is projected to experience robust growth, driven by rising prevalence of hypertension, increasing geriatric population, and growing awareness about cardiovascular health. Technological advancements, such as the development of more accurate and user-friendly digital and automated BP monitors, are fueling market expansion. The home setting segment is witnessing significant growth, driven by the convenience and cost-effectiveness of self-monitoring, allowing for proactive management of hypertension. This trend is further accelerated by telehealth initiatives and remote patient monitoring programs, which are increasingly integrating BP monitoring data into comprehensive patient care plans. While the market is currently dominated by established players like Omron, Philips, and Microlife, the entry of innovative companies with technologically advanced products presents both opportunities and challenges. The competitive landscape is characterized by a focus on product differentiation through features like advanced connectivity, data analysis capabilities, and improved accuracy.
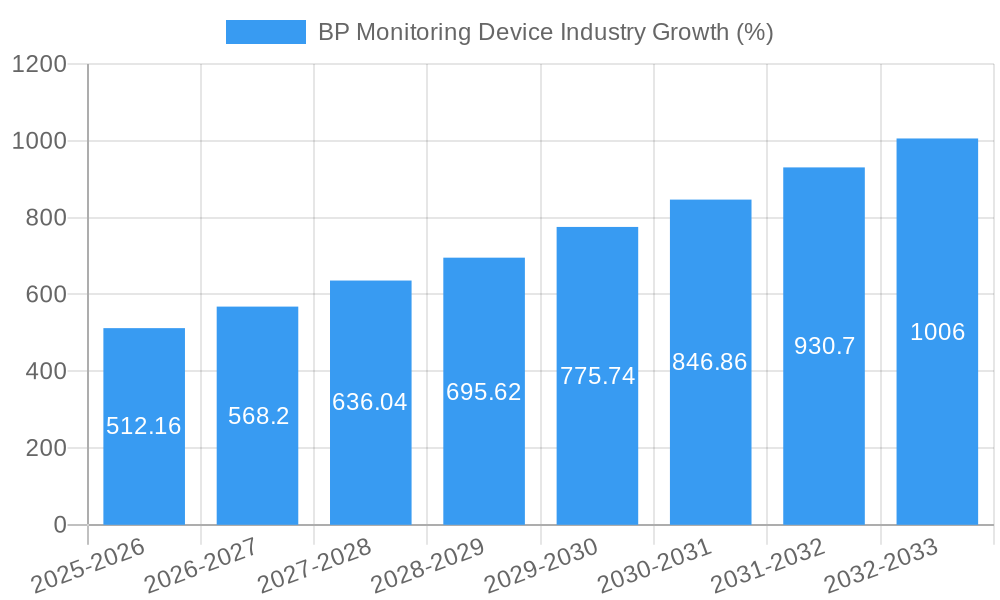
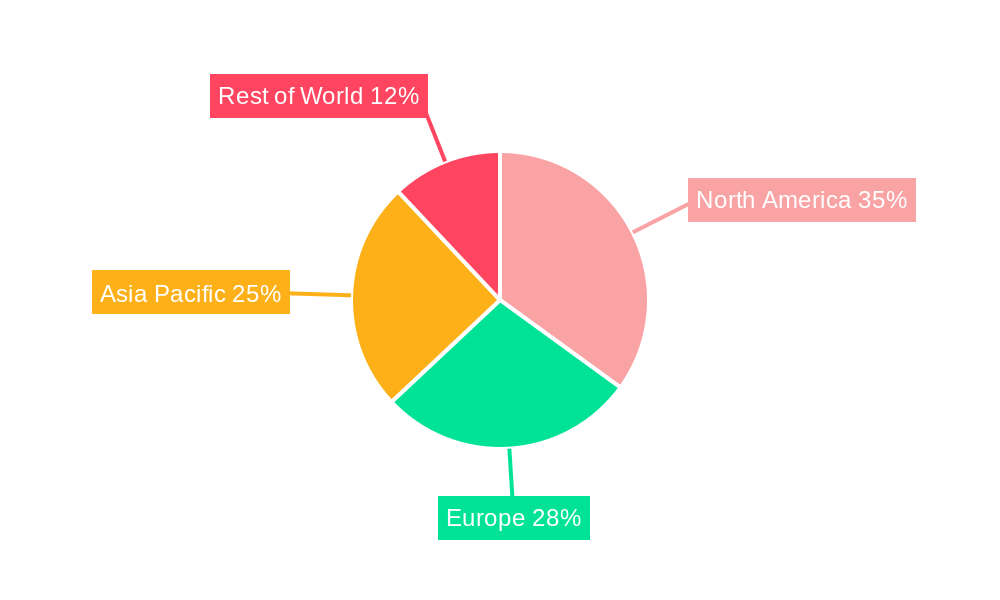
The market segmentation reveals a strong preference for automated/digital blood pressure monitors due to their ease of use and accurate readings compared to traditional aneroid sphygmomanometers. Hospitals and clinics represent a significant portion of the end-user market, but the home setting segment is exhibiting higher growth potential, driven by increased self-monitoring practices and the rising adoption of connected health technologies. Regional variations exist, with North America and Europe holding substantial market shares, owing to higher healthcare expenditure and greater awareness of cardiovascular diseases. However, Asia-Pacific is expected to witness significant growth in the coming years fueled by rising disposable incomes and increasing healthcare infrastructure development. Regulatory approvals and stringent quality standards also play a crucial role in market dynamics, impacting product innovation and market entry for new players. The projected CAGR of 10.32% indicates a promising future for this market, with continued growth anticipated throughout the forecast period (2025-2033).
BP Monitoring Device Industry: Market Report 2019-2033
This comprehensive report provides a detailed analysis of the global BP monitoring device industry, covering market size, growth drivers, key players, and future trends. With a study period spanning 2019-2033, a base year of 2025, and a forecast period of 2025-2033, this report offers invaluable insights for industry stakeholders, investors, and market researchers. The global market is projected to reach xx Million by 2033, exhibiting a CAGR of xx% during the forecast period.
BP Monitoring Device Industry Market Concentration & Dynamics
The global blood pressure (BP) monitoring device market exhibits moderate concentration, with several key players commanding significant market share. While precise figures for 2024 are proprietary, Omron Healthcare Inc. and Koninklijke Philips N.V. are consistently cited as leaders. Other prominent players include GF Health Products Inc., Rossmax International Ltd., Kaz Inc., American Diagnostics Corporation, Withings, A&D Medical Inc., Microlife AG, and General Electric Company (GE Healthcare). The industry is characterized by ongoing mergers and acquisitions (M&A) activity; an estimated [Insert More Precise Number] M&A deals occurred between 2019 and 2024, largely driven by strategies to broaden product lines and expand into new geographic markets. This consolidation is expected to continue shaping the market landscape.
The innovative ecosystem thrives on advancements in sensor technology, miniaturization, and wireless connectivity, resulting in more precise, user-friendly, and portable devices. Stringent regulatory frameworks, notably those established by the FDA and international counterparts, govern device approval and market access. The emergence of substitute products like smartphone-based BP monitoring applications presents competitive pressure; however, the demand for clinically validated devices remains robust. End-user trends are clearly shifting towards home-based monitoring, fueled by an aging global population and a rising awareness of hypertension's prevalence and long-term health implications.
BP Monitoring Device Industry Industry Insights & Trends
The global BP monitoring device market is experiencing robust growth, driven by several key factors. The rising prevalence of hypertension globally is a primary driver, pushing demand for accurate and reliable monitoring solutions. Technological advancements, such as the integration of AI and machine learning for improved data analysis and predictive capabilities, further stimulate market expansion. Changing consumer behaviors, with a preference for convenient, user-friendly, and connected devices, also play a significant role. The market size was estimated at xx Million in 2024 and is projected to reach xx Million by 2033. This growth is attributed to several factors, including:
- Increasing prevalence of hypertension and cardiovascular diseases.
- Growing demand for home healthcare monitoring solutions.
- Technological advancements in BP monitoring technology.
- Rising healthcare expenditure globally.
Key Markets & Segments Leading BP Monitoring Device Industry
North America currently holds the largest share of the global BP monitoring device market, followed by Europe and the Asia-Pacific region. Within product categories, automated/digital blood pressure monitors represent the largest market segment, owing to their user-friendliness and accuracy. The home setting segment exhibits the most rapid growth, driven by the increasing demand for self-monitoring and remote patient monitoring (RPM) solutions. This trend is significantly impacting the market, particularly in regions with strong telehealth infrastructure.
Drivers for Dominant Regions/Segments:
- North America: High healthcare expenditure, sophisticated healthcare infrastructure, and a notably high prevalence of hypertension.
- Automated/Digital BP Monitors: Ease of use, precision, and advanced features such as data logging and connectivity capabilities.
- Home Setting: Growing preference for self-monitoring, convenience, and the expanding availability and adoption of remote patient monitoring programs coupled with improved reimbursement models.
Market analysis projects the automated/digital blood pressure monitor segment to experience the most substantial growth throughout the forecast period, fueled by continuous technological improvements and increasing affordability. The home setting segment also shows significant growth potential due to the widespread adoption of remote patient monitoring programs and the increasing emphasis on preventative healthcare.
BP Monitoring Device Industry Product Developments
Recent years have witnessed remarkable innovation in BP monitoring devices. Manufacturers are focusing on creating smaller, more portable devices with enhanced accuracy and connectivity features. The integration of Bluetooth and Wi-Fi enables seamless data transmission to smartphones and cloud-based platforms, facilitating remote patient monitoring and improved health management. Wearable BP monitoring devices are gaining significant traction, offering continuous monitoring and the potential for earlier detection of hypertension. These advancements enhance the accuracy, convenience, and accessibility of BP monitoring, leading to better patient outcomes and streamlined healthcare management. The incorporation of Artificial Intelligence (AI) for data analysis and predictive modeling represents a significant frontier in this field.
Challenges in the BP Monitoring Device Industry Market
The BP monitoring device market faces several key challenges. Strict regulatory requirements for medical device approval represent a considerable barrier to entry for new market participants. Supply chain disruptions and fluctuations in raw material costs impact production expenses and profitability. Intense competition among established industry players and the rapid emergence of new technologies necessitate continuous innovation and adaptation to retain market share. These factors can collectively impede market growth, potentially leading to a [Insert More Precise Percentage or Range]% reduction in projected sales during periods of significant disruption.
Forces Driving BP Monitoring Device Industry Growth
Technological progress, such as the development of AI-powered devices and continuous ambulatory blood pressure monitoring (ABPM) systems, are major drivers of market expansion. The globally rising prevalence of hypertension and cardiovascular diseases fuels increased demand for BP monitoring devices. Supportive regulatory policies and increasing healthcare spending further stimulate market growth. The expanding adoption of telemedicine and remote patient monitoring solutions, particularly within the home-based monitoring segment, is a significant catalyst for market expansion. The increasing focus on preventative care and chronic disease management further contributes to this positive growth trajectory.
Long-Term Growth Catalysts in the BP Monitoring Device Industry
Long-term growth will be driven by continued innovation in areas like non-invasive and continuous BP monitoring technologies. Strategic partnerships between device manufacturers and healthcare providers will facilitate wider adoption and integration into existing healthcare systems. Expansion into emerging markets with growing healthcare infrastructure and a rising prevalence of hypertension will provide significant opportunities for market growth.
Emerging Opportunities in BP Monitoring Device Industry
Emerging opportunities include the development of AI-powered diagnostic tools and personalized BP management solutions. Integration of BP monitoring data with other health metrics, creating comprehensive health profiles, is another significant area of growth. Expanding into underserved markets and developing affordable, accessible devices for low-income populations can also drive significant market expansion.
Leading Players in the BP Monitoring Device Industry Sector
- GF Health Products Inc
- Rossmax International Ltd
- Kaz Inc
- American Diagnostics Corporation
- Koninklijke Philips N V
- Withings
- A&D Medical Inc
- Microlife AG
- General Electric Company (GE Healthcare)
- Omron Healthcare Inc
Key Milestones in BP Monitoring Device Industry Industry
- May 2021: Biobeat launched a new wearable continuous ambulatory blood pressure monitoring (ABPM) chest-monitoring device, expanding the market for continuous monitoring solutions.
- January 2020: SunTech Medical Inc. announced a collaboration agreement to develop new blood pressure measurement solutions, highlighting industry partnerships focused on innovation and enhanced patient safety.
Strategic Outlook for BP Monitoring Device Industry Market
The future of the BP monitoring device market is promising, with continued growth driven by technological advancements, increasing prevalence of hypertension, and the expanding adoption of remote patient monitoring. Strategic opportunities exist in developing innovative products, forging strategic partnerships, and expanding into new markets to capture significant market share and revenue. The market’s potential for growth remains substantial, driven by unmet needs in accurate, convenient, and accessible BP monitoring solutions.
BP Monitoring Device Industry Segmentation
-
1. Product
- 1.1. Sphygmomanometer/Aneroid BP Monitor
-
1.2. Automated/Digital Blood Pressure Monitor
- 1.2.1. Portable (Wrist, Upper Arm, Finger)
- 1.2.2. Non-Portable (Upper Arm)
- 1.3. Instrument Accessories
-
2. End User
- 2.1. Hospitals and Clinics
- 2.2. Ambulatory Surgical Centers
- 2.3. Home Setting
BP Monitoring Device Industry Segmentation By Geography
-
1. North America
- 1.1. United States
- 1.2. Canada
- 1.3. Mexico
-
2. Europe
- 2.1. Germany
- 2.2. United Kingdom
- 2.3. France
- 2.4. Italy
- 2.5. Spain
- 2.6. Rest of Europe
-
3. Asia Pacific
- 3.1. China
- 3.2. Japan
- 3.3. India
- 3.4. Australia
- 3.5. South Korea
- 3.6. Rest of Asia Pacific
-
4. Middle East and Africa
- 4.1. GCC
- 4.2. South Africa
- 4.3. Rest of Middle East and Africa
-
5. South America
- 5.1. Brazil
- 5.2. Argentina
- 5.3. Rest of South America
BP Monitoring Device Industry REPORT HIGHLIGHTS
| Aspects | Details |
|---|---|
| Study Period | 2019-2033 |
| Base Year | 2024 |
| Estimated Year | 2025 |
| Forecast Period | 2025-2033 |
| Historical Period | 2019-2024 |
| Growth Rate | CAGR of 10.32% from 2019-2033 |
| Segmentation |
|
Table of Contents
- 1. Introduction
- 1.1. Research Scope
- 1.2. Market Segmentation
- 1.3. Research Methodology
- 1.4. Definitions and Assumptions
- 2. Executive Summary
- 2.1. Introduction
- 3. Market Dynamics
- 3.1. Introduction
- 3.2. Market Drivers
- 3.2.1. Surging Burden of Cardiovascular Disorders; Technological Advancements
- 3.3. Market Restrains
- 3.3.1. Excessive Cost for Technological Developments
- 3.4. Market Trends
- 3.4.1. Automated/Digital Blood Pressure Monitor is Expected to Witness a Growth Over the Forecast Period
- 4. Market Factor Analysis
- 4.1. Porters Five Forces
- 4.2. Supply/Value Chain
- 4.3. PESTEL analysis
- 4.4. Market Entropy
- 4.5. Patent/Trademark Analysis
- 5. Global BP Monitoring Device Industry Analysis, Insights and Forecast, 2019-2031
- 5.1. Market Analysis, Insights and Forecast - by Product
- 5.1.1. Sphygmomanometer/Aneroid BP Monitor
- 5.1.2. Automated/Digital Blood Pressure Monitor
- 5.1.2.1. Portable (Wrist, Upper Arm, Finger)
- 5.1.2.2. Non-Portable (Upper Arm)
- 5.1.3. Instrument Accessories
- 5.2. Market Analysis, Insights and Forecast - by End User
- 5.2.1. Hospitals and Clinics
- 5.2.2. Ambulatory Surgical Centers
- 5.2.3. Home Setting
- 5.3. Market Analysis, Insights and Forecast - by Region
- 5.3.1. North America
- 5.3.2. Europe
- 5.3.3. Asia Pacific
- 5.3.4. Middle East and Africa
- 5.3.5. South America
- 5.1. Market Analysis, Insights and Forecast - by Product
- 6. North America BP Monitoring Device Industry Analysis, Insights and Forecast, 2019-2031
- 6.1. Market Analysis, Insights and Forecast - by Product
- 6.1.1. Sphygmomanometer/Aneroid BP Monitor
- 6.1.2. Automated/Digital Blood Pressure Monitor
- 6.1.2.1. Portable (Wrist, Upper Arm, Finger)
- 6.1.2.2. Non-Portable (Upper Arm)
- 6.1.3. Instrument Accessories
- 6.2. Market Analysis, Insights and Forecast - by End User
- 6.2.1. Hospitals and Clinics
- 6.2.2. Ambulatory Surgical Centers
- 6.2.3. Home Setting
- 6.1. Market Analysis, Insights and Forecast - by Product
- 7. Europe BP Monitoring Device Industry Analysis, Insights and Forecast, 2019-2031
- 7.1. Market Analysis, Insights and Forecast - by Product
- 7.1.1. Sphygmomanometer/Aneroid BP Monitor
- 7.1.2. Automated/Digital Blood Pressure Monitor
- 7.1.2.1. Portable (Wrist, Upper Arm, Finger)
- 7.1.2.2. Non-Portable (Upper Arm)
- 7.1.3. Instrument Accessories
- 7.2. Market Analysis, Insights and Forecast - by End User
- 7.2.1. Hospitals and Clinics
- 7.2.2. Ambulatory Surgical Centers
- 7.2.3. Home Setting
- 7.1. Market Analysis, Insights and Forecast - by Product
- 8. Asia Pacific BP Monitoring Device Industry Analysis, Insights and Forecast, 2019-2031
- 8.1. Market Analysis, Insights and Forecast - by Product
- 8.1.1. Sphygmomanometer/Aneroid BP Monitor
- 8.1.2. Automated/Digital Blood Pressure Monitor
- 8.1.2.1. Portable (Wrist, Upper Arm, Finger)
- 8.1.2.2. Non-Portable (Upper Arm)
- 8.1.3. Instrument Accessories
- 8.2. Market Analysis, Insights and Forecast - by End User
- 8.2.1. Hospitals and Clinics
- 8.2.2. Ambulatory Surgical Centers
- 8.2.3. Home Setting
- 8.1. Market Analysis, Insights and Forecast - by Product
- 9. Middle East and Africa BP Monitoring Device Industry Analysis, Insights and Forecast, 2019-2031
- 9.1. Market Analysis, Insights and Forecast - by Product
- 9.1.1. Sphygmomanometer/Aneroid BP Monitor
- 9.1.2. Automated/Digital Blood Pressure Monitor
- 9.1.2.1. Portable (Wrist, Upper Arm, Finger)
- 9.1.2.2. Non-Portable (Upper Arm)
- 9.1.3. Instrument Accessories
- 9.2. Market Analysis, Insights and Forecast - by End User
- 9.2.1. Hospitals and Clinics
- 9.2.2. Ambulatory Surgical Centers
- 9.2.3. Home Setting
- 9.1. Market Analysis, Insights and Forecast - by Product
- 10. South America BP Monitoring Device Industry Analysis, Insights and Forecast, 2019-2031
- 10.1. Market Analysis, Insights and Forecast - by Product
- 10.1.1. Sphygmomanometer/Aneroid BP Monitor
- 10.1.2. Automated/Digital Blood Pressure Monitor
- 10.1.2.1. Portable (Wrist, Upper Arm, Finger)
- 10.1.2.2. Non-Portable (Upper Arm)
- 10.1.3. Instrument Accessories
- 10.2. Market Analysis, Insights and Forecast - by End User
- 10.2.1. Hospitals and Clinics
- 10.2.2. Ambulatory Surgical Centers
- 10.2.3. Home Setting
- 10.1. Market Analysis, Insights and Forecast - by Product
- 11. North America BP Monitoring Device Industry Analysis, Insights and Forecast, 2019-2031
- 11.1. Market Analysis, Insights and Forecast - By Country/Sub-region
- 11.1.1 United States
- 11.1.2 Canada
- 11.1.3 Mexico
- 12. South America BP Monitoring Device Industry Analysis, Insights and Forecast, 2019-2031
- 12.1. Market Analysis, Insights and Forecast - By Country/Sub-region
- 12.1.1 Brazil
- 12.1.2 Mexico
- 12.1.3 Rest of South America
- 13. Europe BP Monitoring Device Industry Analysis, Insights and Forecast, 2019-2031
- 13.1. Market Analysis, Insights and Forecast - By Country/Sub-region
- 13.1.1 United Kingdom
- 13.1.2 Germany
- 13.1.3 France
- 13.1.4 Italy
- 13.1.5 Spain
- 13.1.6 Russia
- 13.1.7 Rest of Europe
- 14. Asia Pacific BP Monitoring Device Industry Analysis, Insights and Forecast, 2019-2031
- 14.1. Market Analysis, Insights and Forecast - By Country/Sub-region
- 14.1.1 China
- 14.1.2 Japan
- 14.1.3 India
- 14.1.4 South Korea
- 14.1.5 Taiwan
- 14.1.6 Australia
- 14.1.7 Rest of Asia-Pacific
- 15. MEA BP Monitoring Device Industry Analysis, Insights and Forecast, 2019-2031
- 15.1. Market Analysis, Insights and Forecast - By Country/Sub-region
- 15.1.1 Middle East
- 15.1.2 Africa
- 16. Competitive Analysis
- 16.1. Global Market Share Analysis 2024
- 16.2. Company Profiles
- 16.2.1 GF Health Products Inc
- 16.2.1.1. Overview
- 16.2.1.2. Products
- 16.2.1.3. SWOT Analysis
- 16.2.1.4. Recent Developments
- 16.2.1.5. Financials (Based on Availability)
- 16.2.2 Rossmax International Ltd
- 16.2.2.1. Overview
- 16.2.2.2. Products
- 16.2.2.3. SWOT Analysis
- 16.2.2.4. Recent Developments
- 16.2.2.5. Financials (Based on Availability)
- 16.2.3 Kaz Inc
- 16.2.3.1. Overview
- 16.2.3.2. Products
- 16.2.3.3. SWOT Analysis
- 16.2.3.4. Recent Developments
- 16.2.3.5. Financials (Based on Availability)
- 16.2.4 American Diagnostics Corporation
- 16.2.4.1. Overview
- 16.2.4.2. Products
- 16.2.4.3. SWOT Analysis
- 16.2.4.4. Recent Developments
- 16.2.4.5. Financials (Based on Availability)
- 16.2.5 Koninklijke Philips N V
- 16.2.5.1. Overview
- 16.2.5.2. Products
- 16.2.5.3. SWOT Analysis
- 16.2.5.4. Recent Developments
- 16.2.5.5. Financials (Based on Availability)
- 16.2.6 Withings*List Not Exhaustive
- 16.2.6.1. Overview
- 16.2.6.2. Products
- 16.2.6.3. SWOT Analysis
- 16.2.6.4. Recent Developments
- 16.2.6.5. Financials (Based on Availability)
- 16.2.7 A&D Medical Inc
- 16.2.7.1. Overview
- 16.2.7.2. Products
- 16.2.7.3. SWOT Analysis
- 16.2.7.4. Recent Developments
- 16.2.7.5. Financials (Based on Availability)
- 16.2.8 Microlife AG
- 16.2.8.1. Overview
- 16.2.8.2. Products
- 16.2.8.3. SWOT Analysis
- 16.2.8.4. Recent Developments
- 16.2.8.5. Financials (Based on Availability)
- 16.2.9 General Electric Company (GE Healthcare)
- 16.2.9.1. Overview
- 16.2.9.2. Products
- 16.2.9.3. SWOT Analysis
- 16.2.9.4. Recent Developments
- 16.2.9.5. Financials (Based on Availability)
- 16.2.10 Omron Healthcare Inc
- 16.2.10.1. Overview
- 16.2.10.2. Products
- 16.2.10.3. SWOT Analysis
- 16.2.10.4. Recent Developments
- 16.2.10.5. Financials (Based on Availability)
- 16.2.1 GF Health Products Inc
List of Figures
- Figure 1: Global BP Monitoring Device Industry Revenue Breakdown (Million, %) by Region 2024 & 2032
- Figure 2: Global BP Monitoring Device Industry Volume Breakdown (K Units, %) by Region 2024 & 2032
- Figure 3: North America BP Monitoring Device Industry Revenue (Million), by Country 2024 & 2032
- Figure 4: North America BP Monitoring Device Industry Volume (K Units), by Country 2024 & 2032
- Figure 5: North America BP Monitoring Device Industry Revenue Share (%), by Country 2024 & 2032
- Figure 6: North America BP Monitoring Device Industry Volume Share (%), by Country 2024 & 2032
- Figure 7: South America BP Monitoring Device Industry Revenue (Million), by Country 2024 & 2032
- Figure 8: South America BP Monitoring Device Industry Volume (K Units), by Country 2024 & 2032
- Figure 9: South America BP Monitoring Device Industry Revenue Share (%), by Country 2024 & 2032
- Figure 10: South America BP Monitoring Device Industry Volume Share (%), by Country 2024 & 2032
- Figure 11: Europe BP Monitoring Device Industry Revenue (Million), by Country 2024 & 2032
- Figure 12: Europe BP Monitoring Device Industry Volume (K Units), by Country 2024 & 2032
- Figure 13: Europe BP Monitoring Device Industry Revenue Share (%), by Country 2024 & 2032
- Figure 14: Europe BP Monitoring Device Industry Volume Share (%), by Country 2024 & 2032
- Figure 15: Asia Pacific BP Monitoring Device Industry Revenue (Million), by Country 2024 & 2032
- Figure 16: Asia Pacific BP Monitoring Device Industry Volume (K Units), by Country 2024 & 2032
- Figure 17: Asia Pacific BP Monitoring Device Industry Revenue Share (%), by Country 2024 & 2032
- Figure 18: Asia Pacific BP Monitoring Device Industry Volume Share (%), by Country 2024 & 2032
- Figure 19: MEA BP Monitoring Device Industry Revenue (Million), by Country 2024 & 2032
- Figure 20: MEA BP Monitoring Device Industry Volume (K Units), by Country 2024 & 2032
- Figure 21: MEA BP Monitoring Device Industry Revenue Share (%), by Country 2024 & 2032
- Figure 22: MEA BP Monitoring Device Industry Volume Share (%), by Country 2024 & 2032
- Figure 23: North America BP Monitoring Device Industry Revenue (Million), by Product 2024 & 2032
- Figure 24: North America BP Monitoring Device Industry Volume (K Units), by Product 2024 & 2032
- Figure 25: North America BP Monitoring Device Industry Revenue Share (%), by Product 2024 & 2032
- Figure 26: North America BP Monitoring Device Industry Volume Share (%), by Product 2024 & 2032
- Figure 27: North America BP Monitoring Device Industry Revenue (Million), by End User 2024 & 2032
- Figure 28: North America BP Monitoring Device Industry Volume (K Units), by End User 2024 & 2032
- Figure 29: North America BP Monitoring Device Industry Revenue Share (%), by End User 2024 & 2032
- Figure 30: North America BP Monitoring Device Industry Volume Share (%), by End User 2024 & 2032
- Figure 31: North America BP Monitoring Device Industry Revenue (Million), by Country 2024 & 2032
- Figure 32: North America BP Monitoring Device Industry Volume (K Units), by Country 2024 & 2032
- Figure 33: North America BP Monitoring Device Industry Revenue Share (%), by Country 2024 & 2032
- Figure 34: North America BP Monitoring Device Industry Volume Share (%), by Country 2024 & 2032
- Figure 35: Europe BP Monitoring Device Industry Revenue (Million), by Product 2024 & 2032
- Figure 36: Europe BP Monitoring Device Industry Volume (K Units), by Product 2024 & 2032
- Figure 37: Europe BP Monitoring Device Industry Revenue Share (%), by Product 2024 & 2032
- Figure 38: Europe BP Monitoring Device Industry Volume Share (%), by Product 2024 & 2032
- Figure 39: Europe BP Monitoring Device Industry Revenue (Million), by End User 2024 & 2032
- Figure 40: Europe BP Monitoring Device Industry Volume (K Units), by End User 2024 & 2032
- Figure 41: Europe BP Monitoring Device Industry Revenue Share (%), by End User 2024 & 2032
- Figure 42: Europe BP Monitoring Device Industry Volume Share (%), by End User 2024 & 2032
- Figure 43: Europe BP Monitoring Device Industry Revenue (Million), by Country 2024 & 2032
- Figure 44: Europe BP Monitoring Device Industry Volume (K Units), by Country 2024 & 2032
- Figure 45: Europe BP Monitoring Device Industry Revenue Share (%), by Country 2024 & 2032
- Figure 46: Europe BP Monitoring Device Industry Volume Share (%), by Country 2024 & 2032
- Figure 47: Asia Pacific BP Monitoring Device Industry Revenue (Million), by Product 2024 & 2032
- Figure 48: Asia Pacific BP Monitoring Device Industry Volume (K Units), by Product 2024 & 2032
- Figure 49: Asia Pacific BP Monitoring Device Industry Revenue Share (%), by Product 2024 & 2032
- Figure 50: Asia Pacific BP Monitoring Device Industry Volume Share (%), by Product 2024 & 2032
- Figure 51: Asia Pacific BP Monitoring Device Industry Revenue (Million), by End User 2024 & 2032
- Figure 52: Asia Pacific BP Monitoring Device Industry Volume (K Units), by End User 2024 & 2032
- Figure 53: Asia Pacific BP Monitoring Device Industry Revenue Share (%), by End User 2024 & 2032
- Figure 54: Asia Pacific BP Monitoring Device Industry Volume Share (%), by End User 2024 & 2032
- Figure 55: Asia Pacific BP Monitoring Device Industry Revenue (Million), by Country 2024 & 2032
- Figure 56: Asia Pacific BP Monitoring Device Industry Volume (K Units), by Country 2024 & 2032
- Figure 57: Asia Pacific BP Monitoring Device Industry Revenue Share (%), by Country 2024 & 2032
- Figure 58: Asia Pacific BP Monitoring Device Industry Volume Share (%), by Country 2024 & 2032
- Figure 59: Middle East and Africa BP Monitoring Device Industry Revenue (Million), by Product 2024 & 2032
- Figure 60: Middle East and Africa BP Monitoring Device Industry Volume (K Units), by Product 2024 & 2032
- Figure 61: Middle East and Africa BP Monitoring Device Industry Revenue Share (%), by Product 2024 & 2032
- Figure 62: Middle East and Africa BP Monitoring Device Industry Volume Share (%), by Product 2024 & 2032
- Figure 63: Middle East and Africa BP Monitoring Device Industry Revenue (Million), by End User 2024 & 2032
- Figure 64: Middle East and Africa BP Monitoring Device Industry Volume (K Units), by End User 2024 & 2032
- Figure 65: Middle East and Africa BP Monitoring Device Industry Revenue Share (%), by End User 2024 & 2032
- Figure 66: Middle East and Africa BP Monitoring Device Industry Volume Share (%), by End User 2024 & 2032
- Figure 67: Middle East and Africa BP Monitoring Device Industry Revenue (Million), by Country 2024 & 2032
- Figure 68: Middle East and Africa BP Monitoring Device Industry Volume (K Units), by Country 2024 & 2032
- Figure 69: Middle East and Africa BP Monitoring Device Industry Revenue Share (%), by Country 2024 & 2032
- Figure 70: Middle East and Africa BP Monitoring Device Industry Volume Share (%), by Country 2024 & 2032
- Figure 71: South America BP Monitoring Device Industry Revenue (Million), by Product 2024 & 2032
- Figure 72: South America BP Monitoring Device Industry Volume (K Units), by Product 2024 & 2032
- Figure 73: South America BP Monitoring Device Industry Revenue Share (%), by Product 2024 & 2032
- Figure 74: South America BP Monitoring Device Industry Volume Share (%), by Product 2024 & 2032
- Figure 75: South America BP Monitoring Device Industry Revenue (Million), by End User 2024 & 2032
- Figure 76: South America BP Monitoring Device Industry Volume (K Units), by End User 2024 & 2032
- Figure 77: South America BP Monitoring Device Industry Revenue Share (%), by End User 2024 & 2032
- Figure 78: South America BP Monitoring Device Industry Volume Share (%), by End User 2024 & 2032
- Figure 79: South America BP Monitoring Device Industry Revenue (Million), by Country 2024 & 2032
- Figure 80: South America BP Monitoring Device Industry Volume (K Units), by Country 2024 & 2032
- Figure 81: South America BP Monitoring Device Industry Revenue Share (%), by Country 2024 & 2032
- Figure 82: South America BP Monitoring Device Industry Volume Share (%), by Country 2024 & 2032
List of Tables
- Table 1: Global BP Monitoring Device Industry Revenue Million Forecast, by Region 2019 & 2032
- Table 2: Global BP Monitoring Device Industry Volume K Units Forecast, by Region 2019 & 2032
- Table 3: Global BP Monitoring Device Industry Revenue Million Forecast, by Product 2019 & 2032
- Table 4: Global BP Monitoring Device Industry Volume K Units Forecast, by Product 2019 & 2032
- Table 5: Global BP Monitoring Device Industry Revenue Million Forecast, by End User 2019 & 2032
- Table 6: Global BP Monitoring Device Industry Volume K Units Forecast, by End User 2019 & 2032
- Table 7: Global BP Monitoring Device Industry Revenue Million Forecast, by Region 2019 & 2032
- Table 8: Global BP Monitoring Device Industry Volume K Units Forecast, by Region 2019 & 2032
- Table 9: Global BP Monitoring Device Industry Revenue Million Forecast, by Country 2019 & 2032
- Table 10: Global BP Monitoring Device Industry Volume K Units Forecast, by Country 2019 & 2032
- Table 11: United States BP Monitoring Device Industry Revenue (Million) Forecast, by Application 2019 & 2032
- Table 12: United States BP Monitoring Device Industry Volume (K Units) Forecast, by Application 2019 & 2032
- Table 13: Canada BP Monitoring Device Industry Revenue (Million) Forecast, by Application 2019 & 2032
- Table 14: Canada BP Monitoring Device Industry Volume (K Units) Forecast, by Application 2019 & 2032
- Table 15: Mexico BP Monitoring Device Industry Revenue (Million) Forecast, by Application 2019 & 2032
- Table 16: Mexico BP Monitoring Device Industry Volume (K Units) Forecast, by Application 2019 & 2032
- Table 17: Global BP Monitoring Device Industry Revenue Million Forecast, by Country 2019 & 2032
- Table 18: Global BP Monitoring Device Industry Volume K Units Forecast, by Country 2019 & 2032
- Table 19: Brazil BP Monitoring Device Industry Revenue (Million) Forecast, by Application 2019 & 2032
- Table 20: Brazil BP Monitoring Device Industry Volume (K Units) Forecast, by Application 2019 & 2032
- Table 21: Mexico BP Monitoring Device Industry Revenue (Million) Forecast, by Application 2019 & 2032
- Table 22: Mexico BP Monitoring Device Industry Volume (K Units) Forecast, by Application 2019 & 2032
- Table 23: Rest of South America BP Monitoring Device Industry Revenue (Million) Forecast, by Application 2019 & 2032
- Table 24: Rest of South America BP Monitoring Device Industry Volume (K Units) Forecast, by Application 2019 & 2032
- Table 25: Global BP Monitoring Device Industry Revenue Million Forecast, by Country 2019 & 2032
- Table 26: Global BP Monitoring Device Industry Volume K Units Forecast, by Country 2019 & 2032
- Table 27: United Kingdom BP Monitoring Device Industry Revenue (Million) Forecast, by Application 2019 & 2032
- Table 28: United Kingdom BP Monitoring Device Industry Volume (K Units) Forecast, by Application 2019 & 2032
- Table 29: Germany BP Monitoring Device Industry Revenue (Million) Forecast, by Application 2019 & 2032
- Table 30: Germany BP Monitoring Device Industry Volume (K Units) Forecast, by Application 2019 & 2032
- Table 31: France BP Monitoring Device Industry Revenue (Million) Forecast, by Application 2019 & 2032
- Table 32: France BP Monitoring Device Industry Volume (K Units) Forecast, by Application 2019 & 2032
- Table 33: Italy BP Monitoring Device Industry Revenue (Million) Forecast, by Application 2019 & 2032
- Table 34: Italy BP Monitoring Device Industry Volume (K Units) Forecast, by Application 2019 & 2032
- Table 35: Spain BP Monitoring Device Industry Revenue (Million) Forecast, by Application 2019 & 2032
- Table 36: Spain BP Monitoring Device Industry Volume (K Units) Forecast, by Application 2019 & 2032
- Table 37: Russia BP Monitoring Device Industry Revenue (Million) Forecast, by Application 2019 & 2032
- Table 38: Russia BP Monitoring Device Industry Volume (K Units) Forecast, by Application 2019 & 2032
- Table 39: Rest of Europe BP Monitoring Device Industry Revenue (Million) Forecast, by Application 2019 & 2032
- Table 40: Rest of Europe BP Monitoring Device Industry Volume (K Units) Forecast, by Application 2019 & 2032
- Table 41: Global BP Monitoring Device Industry Revenue Million Forecast, by Country 2019 & 2032
- Table 42: Global BP Monitoring Device Industry Volume K Units Forecast, by Country 2019 & 2032
- Table 43: China BP Monitoring Device Industry Revenue (Million) Forecast, by Application 2019 & 2032
- Table 44: China BP Monitoring Device Industry Volume (K Units) Forecast, by Application 2019 & 2032
- Table 45: Japan BP Monitoring Device Industry Revenue (Million) Forecast, by Application 2019 & 2032
- Table 46: Japan BP Monitoring Device Industry Volume (K Units) Forecast, by Application 2019 & 2032
- Table 47: India BP Monitoring Device Industry Revenue (Million) Forecast, by Application 2019 & 2032
- Table 48: India BP Monitoring Device Industry Volume (K Units) Forecast, by Application 2019 & 2032
- Table 49: South Korea BP Monitoring Device Industry Revenue (Million) Forecast, by Application 2019 & 2032
- Table 50: South Korea BP Monitoring Device Industry Volume (K Units) Forecast, by Application 2019 & 2032
- Table 51: Taiwan BP Monitoring Device Industry Revenue (Million) Forecast, by Application 2019 & 2032
- Table 52: Taiwan BP Monitoring Device Industry Volume (K Units) Forecast, by Application 2019 & 2032
- Table 53: Australia BP Monitoring Device Industry Revenue (Million) Forecast, by Application 2019 & 2032
- Table 54: Australia BP Monitoring Device Industry Volume (K Units) Forecast, by Application 2019 & 2032
- Table 55: Rest of Asia-Pacific BP Monitoring Device Industry Revenue (Million) Forecast, by Application 2019 & 2032
- Table 56: Rest of Asia-Pacific BP Monitoring Device Industry Volume (K Units) Forecast, by Application 2019 & 2032
- Table 57: Global BP Monitoring Device Industry Revenue Million Forecast, by Country 2019 & 2032
- Table 58: Global BP Monitoring Device Industry Volume K Units Forecast, by Country 2019 & 2032
- Table 59: Middle East BP Monitoring Device Industry Revenue (Million) Forecast, by Application 2019 & 2032
- Table 60: Middle East BP Monitoring Device Industry Volume (K Units) Forecast, by Application 2019 & 2032
- Table 61: Africa BP Monitoring Device Industry Revenue (Million) Forecast, by Application 2019 & 2032
- Table 62: Africa BP Monitoring Device Industry Volume (K Units) Forecast, by Application 2019 & 2032
- Table 63: Global BP Monitoring Device Industry Revenue Million Forecast, by Product 2019 & 2032
- Table 64: Global BP Monitoring Device Industry Volume K Units Forecast, by Product 2019 & 2032
- Table 65: Global BP Monitoring Device Industry Revenue Million Forecast, by End User 2019 & 2032
- Table 66: Global BP Monitoring Device Industry Volume K Units Forecast, by End User 2019 & 2032
- Table 67: Global BP Monitoring Device Industry Revenue Million Forecast, by Country 2019 & 2032
- Table 68: Global BP Monitoring Device Industry Volume K Units Forecast, by Country 2019 & 2032
- Table 69: United States BP Monitoring Device Industry Revenue (Million) Forecast, by Application 2019 & 2032
- Table 70: United States BP Monitoring Device Industry Volume (K Units) Forecast, by Application 2019 & 2032
- Table 71: Canada BP Monitoring Device Industry Revenue (Million) Forecast, by Application 2019 & 2032
- Table 72: Canada BP Monitoring Device Industry Volume (K Units) Forecast, by Application 2019 & 2032
- Table 73: Mexico BP Monitoring Device Industry Revenue (Million) Forecast, by Application 2019 & 2032
- Table 74: Mexico BP Monitoring Device Industry Volume (K Units) Forecast, by Application 2019 & 2032
- Table 75: Global BP Monitoring Device Industry Revenue Million Forecast, by Product 2019 & 2032
- Table 76: Global BP Monitoring Device Industry Volume K Units Forecast, by Product 2019 & 2032
- Table 77: Global BP Monitoring Device Industry Revenue Million Forecast, by End User 2019 & 2032
- Table 78: Global BP Monitoring Device Industry Volume K Units Forecast, by End User 2019 & 2032
- Table 79: Global BP Monitoring Device Industry Revenue Million Forecast, by Country 2019 & 2032
- Table 80: Global BP Monitoring Device Industry Volume K Units Forecast, by Country 2019 & 2032
- Table 81: Germany BP Monitoring Device Industry Revenue (Million) Forecast, by Application 2019 & 2032
- Table 82: Germany BP Monitoring Device Industry Volume (K Units) Forecast, by Application 2019 & 2032
- Table 83: United Kingdom BP Monitoring Device Industry Revenue (Million) Forecast, by Application 2019 & 2032
- Table 84: United Kingdom BP Monitoring Device Industry Volume (K Units) Forecast, by Application 2019 & 2032
- Table 85: France BP Monitoring Device Industry Revenue (Million) Forecast, by Application 2019 & 2032
- Table 86: France BP Monitoring Device Industry Volume (K Units) Forecast, by Application 2019 & 2032
- Table 87: Italy BP Monitoring Device Industry Revenue (Million) Forecast, by Application 2019 & 2032
- Table 88: Italy BP Monitoring Device Industry Volume (K Units) Forecast, by Application 2019 & 2032
- Table 89: Spain BP Monitoring Device Industry Revenue (Million) Forecast, by Application 2019 & 2032
- Table 90: Spain BP Monitoring Device Industry Volume (K Units) Forecast, by Application 2019 & 2032
- Table 91: Rest of Europe BP Monitoring Device Industry Revenue (Million) Forecast, by Application 2019 & 2032
- Table 92: Rest of Europe BP Monitoring Device Industry Volume (K Units) Forecast, by Application 2019 & 2032
- Table 93: Global BP Monitoring Device Industry Revenue Million Forecast, by Product 2019 & 2032
- Table 94: Global BP Monitoring Device Industry Volume K Units Forecast, by Product 2019 & 2032
- Table 95: Global BP Monitoring Device Industry Revenue Million Forecast, by End User 2019 & 2032
- Table 96: Global BP Monitoring Device Industry Volume K Units Forecast, by End User 2019 & 2032
- Table 97: Global BP Monitoring Device Industry Revenue Million Forecast, by Country 2019 & 2032
- Table 98: Global BP Monitoring Device Industry Volume K Units Forecast, by Country 2019 & 2032
- Table 99: China BP Monitoring Device Industry Revenue (Million) Forecast, by Application 2019 & 2032
- Table 100: China BP Monitoring Device Industry Volume (K Units) Forecast, by Application 2019 & 2032
- Table 101: Japan BP Monitoring Device Industry Revenue (Million) Forecast, by Application 2019 & 2032
- Table 102: Japan BP Monitoring Device Industry Volume (K Units) Forecast, by Application 2019 & 2032
- Table 103: India BP Monitoring Device Industry Revenue (Million) Forecast, by Application 2019 & 2032
- Table 104: India BP Monitoring Device Industry Volume (K Units) Forecast, by Application 2019 & 2032
- Table 105: Australia BP Monitoring Device Industry Revenue (Million) Forecast, by Application 2019 & 2032
- Table 106: Australia BP Monitoring Device Industry Volume (K Units) Forecast, by Application 2019 & 2032
- Table 107: South Korea BP Monitoring Device Industry Revenue (Million) Forecast, by Application 2019 & 2032
- Table 108: South Korea BP Monitoring Device Industry Volume (K Units) Forecast, by Application 2019 & 2032
- Table 109: Rest of Asia Pacific BP Monitoring Device Industry Revenue (Million) Forecast, by Application 2019 & 2032
- Table 110: Rest of Asia Pacific BP Monitoring Device Industry Volume (K Units) Forecast, by Application 2019 & 2032
- Table 111: Global BP Monitoring Device Industry Revenue Million Forecast, by Product 2019 & 2032
- Table 112: Global BP Monitoring Device Industry Volume K Units Forecast, by Product 2019 & 2032
- Table 113: Global BP Monitoring Device Industry Revenue Million Forecast, by End User 2019 & 2032
- Table 114: Global BP Monitoring Device Industry Volume K Units Forecast, by End User 2019 & 2032
- Table 115: Global BP Monitoring Device Industry Revenue Million Forecast, by Country 2019 & 2032
- Table 116: Global BP Monitoring Device Industry Volume K Units Forecast, by Country 2019 & 2032
- Table 117: GCC BP Monitoring Device Industry Revenue (Million) Forecast, by Application 2019 & 2032
- Table 118: GCC BP Monitoring Device Industry Volume (K Units) Forecast, by Application 2019 & 2032
- Table 119: South Africa BP Monitoring Device Industry Revenue (Million) Forecast, by Application 2019 & 2032
- Table 120: South Africa BP Monitoring Device Industry Volume (K Units) Forecast, by Application 2019 & 2032
- Table 121: Rest of Middle East and Africa BP Monitoring Device Industry Revenue (Million) Forecast, by Application 2019 & 2032
- Table 122: Rest of Middle East and Africa BP Monitoring Device Industry Volume (K Units) Forecast, by Application 2019 & 2032
- Table 123: Global BP Monitoring Device Industry Revenue Million Forecast, by Product 2019 & 2032
- Table 124: Global BP Monitoring Device Industry Volume K Units Forecast, by Product 2019 & 2032
- Table 125: Global BP Monitoring Device Industry Revenue Million Forecast, by End User 2019 & 2032
- Table 126: Global BP Monitoring Device Industry Volume K Units Forecast, by End User 2019 & 2032
- Table 127: Global BP Monitoring Device Industry Revenue Million Forecast, by Country 2019 & 2032
- Table 128: Global BP Monitoring Device Industry Volume K Units Forecast, by Country 2019 & 2032
- Table 129: Brazil BP Monitoring Device Industry Revenue (Million) Forecast, by Application 2019 & 2032
- Table 130: Brazil BP Monitoring Device Industry Volume (K Units) Forecast, by Application 2019 & 2032
- Table 131: Argentina BP Monitoring Device Industry Revenue (Million) Forecast, by Application 2019 & 2032
- Table 132: Argentina BP Monitoring Device Industry Volume (K Units) Forecast, by Application 2019 & 2032
- Table 133: Rest of South America BP Monitoring Device Industry Revenue (Million) Forecast, by Application 2019 & 2032
- Table 134: Rest of South America BP Monitoring Device Industry Volume (K Units) Forecast, by Application 2019 & 2032
Frequently Asked Questions
1. What is the projected Compound Annual Growth Rate (CAGR) of the BP Monitoring Device Industry?
The projected CAGR is approximately 10.32%.
2. Which companies are prominent players in the BP Monitoring Device Industry?
Key companies in the market include GF Health Products Inc, Rossmax International Ltd, Kaz Inc, American Diagnostics Corporation, Koninklijke Philips N V, Withings*List Not Exhaustive, A&D Medical Inc, Microlife AG, General Electric Company (GE Healthcare), Omron Healthcare Inc.
3. What are the main segments of the BP Monitoring Device Industry?
The market segments include Product, End User.
4. Can you provide details about the market size?
The market size is estimated to be USD 4.88 Million as of 2022.
5. What are some drivers contributing to market growth?
Surging Burden of Cardiovascular Disorders; Technological Advancements.
6. What are the notable trends driving market growth?
Automated/Digital Blood Pressure Monitor is Expected to Witness a Growth Over the Forecast Period.
7. Are there any restraints impacting market growth?
Excessive Cost for Technological Developments.
8. Can you provide examples of recent developments in the market?
In May 2021, Biobeat announced the launch of its new wearable and continuous ambulatory blood pressure monitoring (ABPM) chest-monitoring device.
9. What pricing options are available for accessing the report?
Pricing options include single-user, multi-user, and enterprise licenses priced at USD 4750, USD 5250, and USD 8750 respectively.
10. Is the market size provided in terms of value or volume?
The market size is provided in terms of value, measured in Million and volume, measured in K Units.
11. Are there any specific market keywords associated with the report?
Yes, the market keyword associated with the report is "BP Monitoring Device Industry," which aids in identifying and referencing the specific market segment covered.
12. How do I determine which pricing option suits my needs best?
The pricing options vary based on user requirements and access needs. Individual users may opt for single-user licenses, while businesses requiring broader access may choose multi-user or enterprise licenses for cost-effective access to the report.
13. Are there any additional resources or data provided in the BP Monitoring Device Industry report?
While the report offers comprehensive insights, it's advisable to review the specific contents or supplementary materials provided to ascertain if additional resources or data are available.
14. How can I stay updated on further developments or reports in the BP Monitoring Device Industry?
To stay informed about further developments, trends, and reports in the BP Monitoring Device Industry, consider subscribing to industry newsletters, following relevant companies and organizations, or regularly checking reputable industry news sources and publications.
Methodology
Step 1 - Identification of Relevant Samples Size from Population Database


Step 2 - Approaches for Defining Global Market Size (Value, Volume* & Price*)

Note*: In applicable scenarios
Step 3 - Data Sources
Primary Research
- Web Analytics
- Survey Reports
- Research Institute
- Latest Research Reports
- Opinion Leaders
Secondary Research
- Annual Reports
- White Paper
- Latest Press Release
- Industry Association
- Paid Database
- Investor Presentations

Step 4 - Data Triangulation
Involves using different sources of information in order to increase the validity of a study
These sources are likely to be stakeholders in a program - participants, other researchers, program staff, other community members, and so on.
Then we put all data in single framework & apply various statistical tools to find out the dynamic on the market.
During the analysis stage, feedback from the stakeholder groups would be compared to determine areas of agreement as well as areas of divergence
