

Key Insights
The global Cash and Liquidity Management market is poised for robust expansion, projected to reach USD 15.32 billion by 2025, exhibiting a compelling Compound Annual Growth Rate (CAGR) of 6.26% over the forecast period of 2025-2033. This significant growth is primarily fueled by an increasing emphasis on optimizing working capital, enhancing treasury operations, and mitigating financial risks within corporations and government bodies. Businesses are increasingly recognizing the strategic imperative of efficient cash flow management to maintain operational continuity, seize investment opportunities, and navigate economic volatilities. The digital transformation within the financial sector, characterized by the adoption of advanced technologies like AI, machine learning, and blockchain, is further augmenting the capabilities of cash and liquidity management solutions, enabling real-time insights, automated processes, and improved decision-making. This technological infusion is crucial for handling complex financial landscapes and meeting evolving regulatory requirements.
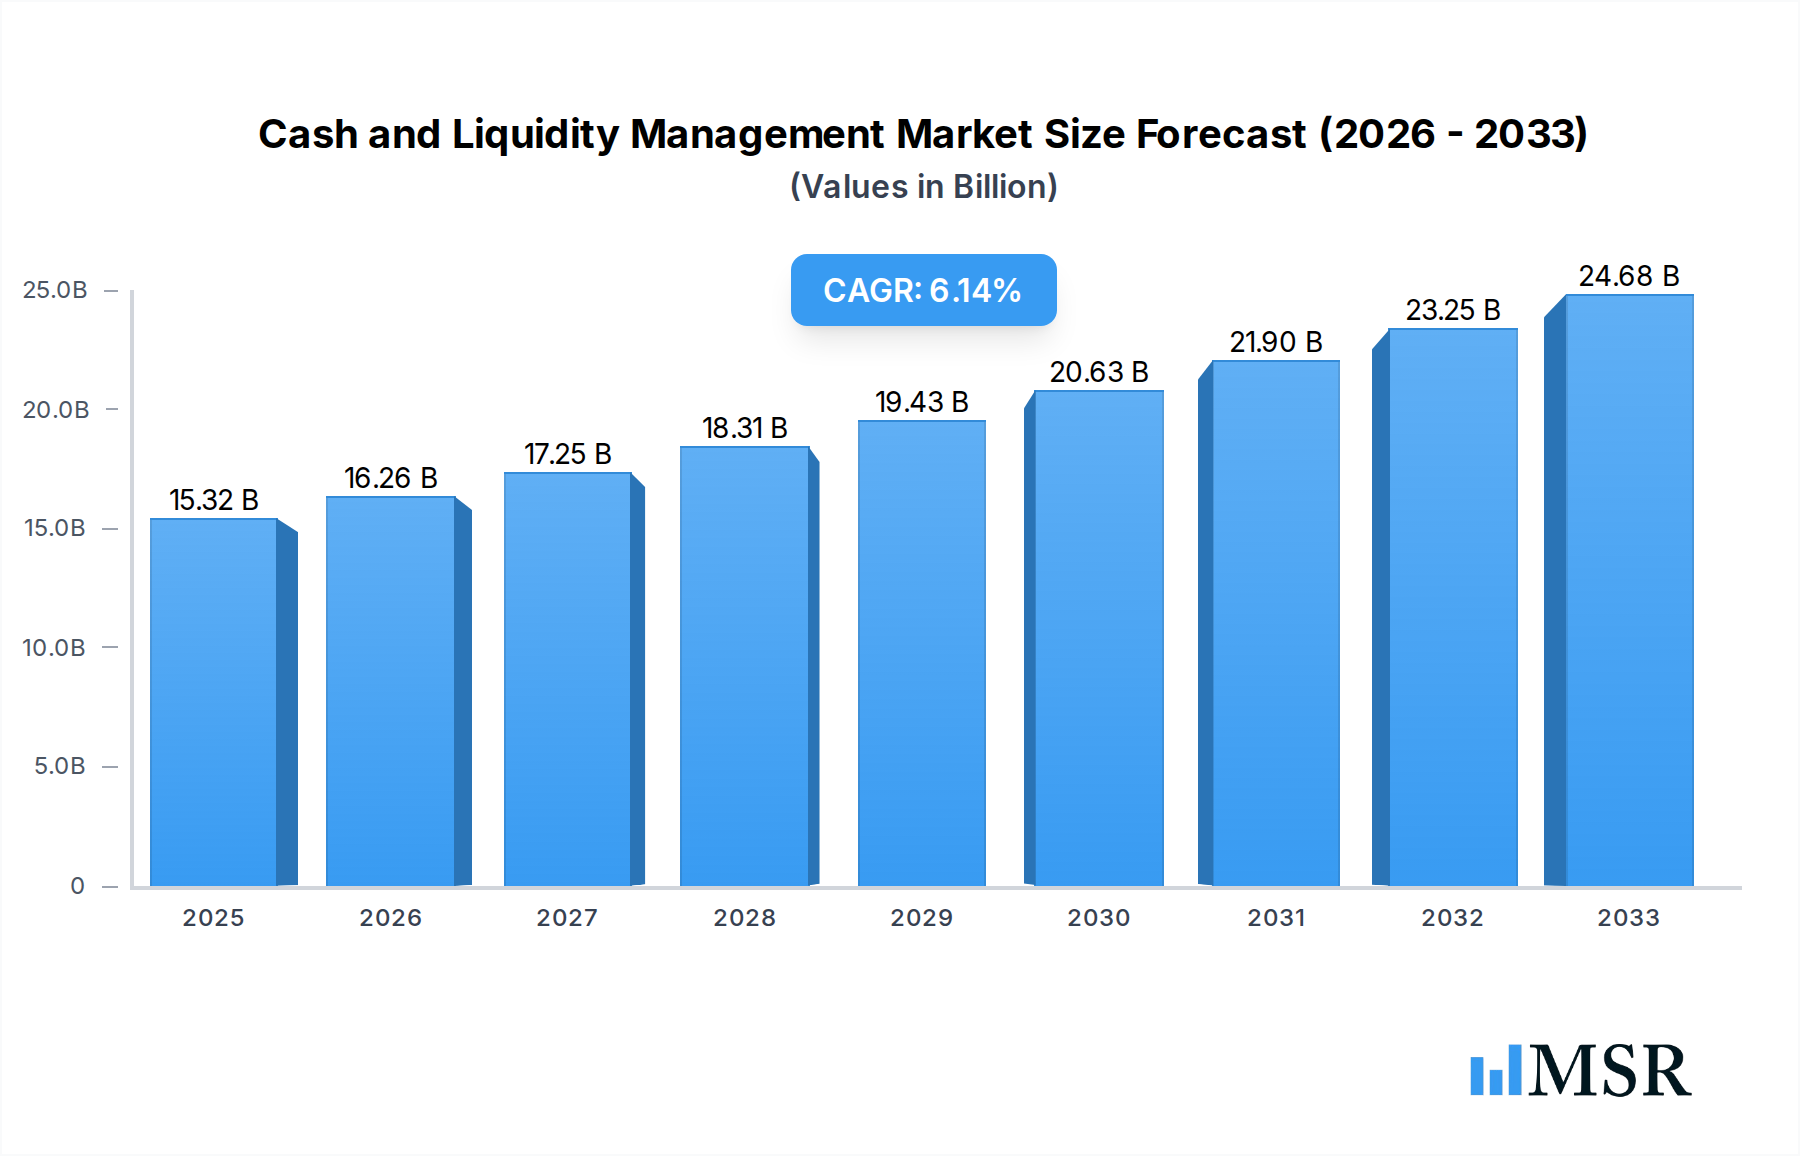
Cash and Liquidity Management Market Size (In Billion)
The market is experiencing a strong impetus from the growing need for sophisticated risk management tools, especially in the wake of global economic uncertainties and evolving regulatory frameworks. Companies are actively seeking solutions that offer enhanced visibility into their liquidity positions, allowing for proactive identification and mitigation of potential shortfalls or excesses. The Payments segment, driven by the surge in digital transactions and cross-border commerce, is a significant contributor to market growth. Furthermore, the expansion of Treasury Management functionalities, encompassing forecasting, planning, and reporting, is critical for organizations aiming to achieve greater financial agility. While the market benefits from these drivers, potential restraints such as the high implementation costs of advanced solutions and concerns surrounding data security and privacy could pose challenges. However, the sustained demand for improved financial control and operational efficiency across diverse applications like Corporate Cash Management, Government Cash Management, and others, coupled with the presence of major global financial institutions in the competitive landscape, indicates a promising trajectory for the Cash and Liquidity Management market.

Cash and Liquidity Management Company Market Share
Unlock unparalleled insights into the global Cash and Liquidity Management market with this definitive report. Spanning a critical study period from 2019 to 2033, with a base and estimated year of 2025 and a forecast period of 2025-2033, this analysis delves into the core dynamics, emerging trends, and strategic opportunities shaping this vital financial sector. We dissect market concentration, industry innovations, regulatory landscapes, and evolving end-user needs, providing actionable intelligence for corporate treasurers, financial institutions, government bodies, and investors. Discover the market size, CAGR, key growth drivers, technological disruptions, and competitive strategies of leading players like BNP Paribas, Bank of China, Citigroup Inc, China Exim Bank, ICBC, JPMorgan Chase & Co, Mizuho Financial Group, Standard Chartered, MUFG, Sumitomo Mitsui Banking Corporation, Credit Agricole, Commerzbank, HSBC, Riyad Bank, Saudi British Bank, ANZ, EBRD, Japan Exim Bank, Banque Saudi Fransi, Afreximbank, AlAhli Bank, and Export-Import Bank of India.
Cash and Liquidity Management Market Concentration & Dynamics
The global Cash and Liquidity Management market is characterized by a moderate to high concentration, with a few dominant players holding significant market share. This concentration is driven by the capital-intensive nature of the industry, the need for robust technological infrastructure, and stringent regulatory compliance. Innovation ecosystems are flourishing, particularly in areas like real-time payments, artificial intelligence for fraud detection, and automated treasury solutions. Regulatory frameworks, such as PSD2 and evolving open banking initiatives, are fundamentally reshaping how financial institutions and corporations manage their liquidity and payments. Substitute products are emerging, including decentralized finance (DeFi) solutions and advanced fintech platforms, though traditional cash and liquidity management tools remain indispensable for large-scale corporate and government operations. End-user trends indicate a growing demand for integrated digital solutions, enhanced visibility across global operations, and sophisticated risk management capabilities. Mergers and Acquisitions (M&A) activities are a key driver of market consolidation, with significant deal counts observed as larger entities seek to expand their service offerings and geographic reach. For instance, recent M&A activities have targeted fintech firms specializing in cross-border payments and AI-driven forecasting, indicating a strategic push towards digital transformation and efficiency.
Cash and Liquidity Management Industry Insights & Trends
The Cash and Liquidity Management industry is experiencing robust growth, projected to reach an estimated market size of US$ 2.5 trillion by 2025, with a Compound Annual Growth Rate (CAGR) of 7.2% from 2019 to 2033. This expansion is propelled by a confluence of factors, including the increasing complexity of global financial markets, the imperative for corporations to optimize working capital, and the growing demand for sophisticated treasury management solutions. Technological disruptions are at the forefront of this evolution, with advancements in cloud computing, big data analytics, and artificial intelligence transforming the way liquidity is managed and transactions are processed. Real-time payment networks are gaining traction, enabling instant settlement and improved cash flow forecasting. Evolving consumer behaviors, particularly among large enterprises and governments, are driving the adoption of digital-first solutions that offer enhanced transparency, automation, and efficiency. The shift towards a digital economy necessitates robust liquidity management to ensure seamless transactions and mitigate financial risks. Furthermore, the increasing frequency of global economic volatility and geopolitical uncertainties underscores the critical importance of effective cash and liquidity management strategies for business continuity and resilience. The focus on environmental, social, and governance (ESG) factors is also influencing investment decisions and product development within the liquidity management space.
Key Markets & Segments Leading Cash and Liquidity Management
The Corporate Cash Management segment is a dominant force in the global Cash and Liquidity Management market, driven by the intricate financial operations of multinational corporations and the increasing need for efficient working capital optimization. The Treasury Management type is particularly influential, encompassing a broad range of functions from cash forecasting and investment to risk mitigation.
Dominant Region: North America and Europe currently lead the market due to their mature financial infrastructures, advanced technological adoption, and the presence of numerous large multinational corporations.
Key Market Drivers:
- Economic Growth: Robust economic expansion in emerging markets fuels increased business activity and, consequently, higher demand for cash and liquidity management services.
- Infrastructure Development: Investments in digital payment systems and banking infrastructure across various regions facilitate the adoption of advanced liquidity management tools.
- Globalization: The increasing interconnectedness of global economies necessitates sophisticated solutions to manage cross-border cash flows and foreign exchange risks.
- Regulatory Compliance: Evolving regulatory mandates, such as those related to anti-money laundering (AML) and Know Your Customer (KYC), drive the need for robust and transparent cash management systems.
Dominance Analysis: Corporate entities, from small and medium-sized enterprises (SMEs) to global conglomerates, rely heavily on optimized cash and liquidity management to ensure operational efficiency, fund growth initiatives, and maintain financial stability. The treasury departments of these organizations are increasingly leveraging sophisticated software and services to gain real-time visibility into their cash positions, forecast future liquidity needs, and manage financial risks effectively. The adoption of cloud-based treasury management systems has been a significant enabler, offering scalability, accessibility, and enhanced data analytics. Payments as a type within Cash and Liquidity Management is also experiencing substantial growth, fueled by the transition to real-time payment networks and the rise of e-commerce. This segment is critical for ensuring timely and secure transactions, both domestically and internationally.
Cash and Liquidity Management Product Developments
Recent product developments in Cash and Liquidity Management are heavily focused on enhancing automation, real-time insights, and security. Innovations include AI-powered cash flow forecasting tools that predict future liquidity needs with greater accuracy, reducing reliance on manual calculations and mitigating forecasting errors. Cloud-based treasury platforms are gaining prominence, offering scalable solutions that can be accessed from anywhere, facilitating seamless global operations. The integration of blockchain technology is being explored for secure and transparent cross-border payments and improved reconciliation processes. Furthermore, advancements in APIs are enabling better integration between corporate ERP systems and banking platforms, leading to more streamlined payment initiation and reconciliation. These technological advancements provide a competitive edge by enabling faster decision-making, reduced operational costs, and enhanced risk mitigation for businesses.
Challenges in the Cash and Liquidity Management Market
The Cash and Liquidity Management market faces several significant challenges. Regulatory hurdles continue to be a primary concern, with evolving compliance requirements across different jurisdictions demanding constant adaptation and investment in new systems. Cybersecurity threats pose a substantial risk, as the increasing digitization of financial transactions makes systems vulnerable to sophisticated attacks, potentially leading to significant financial losses and reputational damage. Legacy system integration presents another obstacle, as many organizations struggle to integrate modern liquidity management solutions with their existing, often outdated, IT infrastructure. Finally, economic volatility and geopolitical uncertainties create unpredictable cash flow patterns, making accurate forecasting and proactive liquidity planning more challenging, with estimated disruptions impacting liquidity buffers by up to 15% in volatile periods.
Forces Driving Cash and Liquidity Management Growth
Several key forces are driving the growth of the Cash and Liquidity Management market. The accelerating adoption of digital transformation across industries necessitates more sophisticated digital payment and liquidity solutions to manage increasingly complex financial flows. The globalization of trade and commerce requires robust tools for managing cross-border transactions, foreign exchange exposure, and diverse regulatory environments. Increasing emphasis on working capital optimization by corporations to improve financial health and unlock investment capital is a significant driver. Furthermore, evolving regulatory landscapes, while posing challenges, also spur innovation by demanding greater transparency, efficiency, and security in financial operations, leading to the development of advanced compliance-enabling technologies.
Challenges in the Cash and Liquidity Management Market
Long-term growth catalysts for the Cash and Liquidity Management market include the continued development and adoption of artificial intelligence and machine learning for predictive analytics, fraud detection, and automated decision-making in liquidity provision. Strategic partnerships between traditional financial institutions and fintech companies are fostering innovation, leading to more integrated and customer-centric solutions. The expansion of real-time payment networks globally is creating new opportunities for instant settlement and enhanced liquidity management. Moreover, the growing focus on sustainability and ESG factors is influencing the development of liquidity management solutions that support responsible investment and corporate governance.
Emerging Opportunities in Cash and Liquidity Management
Emerging opportunities in Cash and Liquidity Management are abundant, driven by technological advancements and shifting market demands. The decentralized finance (DeFi) landscape presents a nascent but potentially disruptive area, offering new avenues for liquidity provision and asset management, albeit with its own set of regulatory considerations. The increasing adoption of central bank digital currencies (CBDCs) could fundamentally alter payment infrastructures and liquidity dynamics, creating new markets for management and integration services. Furthermore, the growing need for real-time, cross-border payment solutions for SMEs represents a significant untapped market. The application of advanced analytics and predictive modeling to identify and mitigate emerging financial risks is another critical growth area, enhancing the resilience of businesses.
Leading Players in the Cash and Liquidity Management Sector
- BNP Paribas
- Bank of China
- Citigroup Inc
- China Exim Bank
- ICBC
- JPMorgan Chase & Co
- Mizuho Financial Group
- Standard Chartered
- MUFG
- Sumitomo Mitsui Banking Corporation
- Credit Agricole
- Commerzbank
- HSBC
- Riyad Bank
- Saudi British Bank
- ANZ
- EBRD
- Japan Exim Bank
- Banque Saudi Fransi
- Afreximbank
- AlAhli Bank
- Export-Import Bank of India
Key Milestones in Cash and Liquidity Management Industry
- 2019: Widespread adoption of real-time payment systems in several key markets, impacting domestic liquidity management.
- 2020: Increased focus on digital treasury solutions due to the COVID-19 pandemic, accelerating cloud adoption and remote work capabilities.
- 2021: Significant regulatory advancements in open banking, driving API integration and data sharing for enhanced liquidity visibility.
- 2022: Growing investment in AI and machine learning for predictive cash flow forecasting and fraud detection.
- 2023: Expansion of cross-border payment networks and introduction of new multi-currency account solutions.
- 2024: Increased M&A activity targeting fintechs specializing in treasury automation and supply chain finance.
Strategic Outlook for Cash and Liquidity Management Market
The strategic outlook for the Cash and Liquidity Management market is overwhelmingly positive, driven by continuous technological innovation and increasing global financial integration. Future growth will be accelerated by the widespread adoption of AI-driven treasury automation, enabling unprecedented levels of efficiency and predictive accuracy. The ongoing expansion of real-time payment infrastructures globally will further streamline cash flows and reduce settlement times. Strategic opportunities lie in developing integrated solutions that address the evolving needs of corporate treasuries, including enhanced risk management, cybersecurity resilience, and sustainability reporting. The market is poised for significant expansion as businesses increasingly prioritize robust liquidity management for operational resilience and strategic advantage in an ever-changing global economic landscape.
Cash and Liquidity Management Segmentation
-
1. Application
- 1.1. Corporate Cash Management
- 1.2. Government Cash Management
- 1.3. Others
-
2. Types
- 2.1. Treasury Management
- 2.2. Risk Management
- 2.3. Payments
- 2.4. Working Capital
- 2.5. Others
Cash and Liquidity Management Segmentation By Geography
-
1. North America
- 1.1. United States
- 1.2. Canada
- 1.3. Mexico
-
2. South America
- 2.1. Brazil
- 2.2. Argentina
- 2.3. Rest of South America
-
3. Europe
- 3.1. United Kingdom
- 3.2. Germany
- 3.3. France
- 3.4. Italy
- 3.5. Spain
- 3.6. Russia
- 3.7. Benelux
- 3.8. Nordics
- 3.9. Rest of Europe
-
4. Middle East & Africa
- 4.1. Turkey
- 4.2. Israel
- 4.3. GCC
- 4.4. North Africa
- 4.5. South Africa
- 4.6. Rest of Middle East & Africa
-
5. Asia Pacific
- 5.1. China
- 5.2. India
- 5.3. Japan
- 5.4. South Korea
- 5.5. ASEAN
- 5.6. Oceania
- 5.7. Rest of Asia Pacific
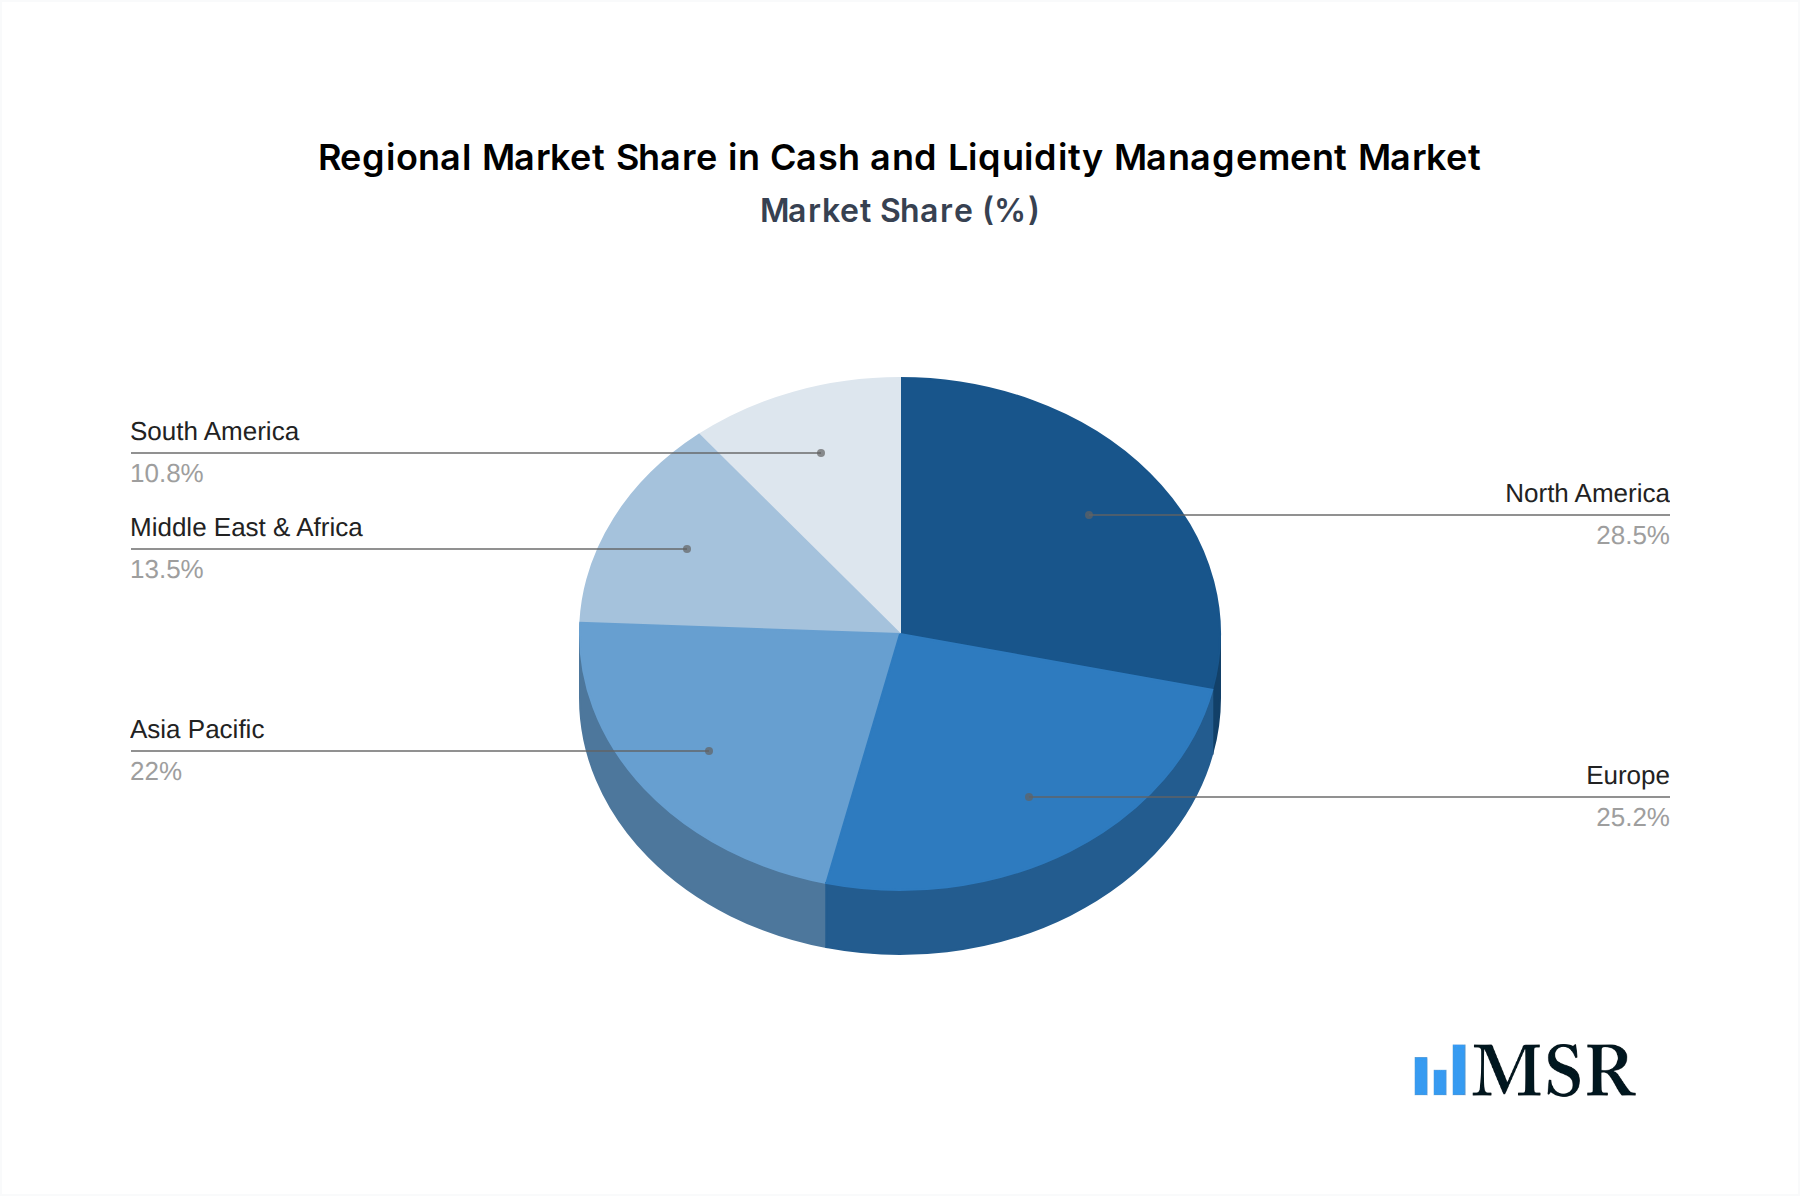
Cash and Liquidity Management Regional Market Share
Geographic Coverage of Cash and Liquidity Management
Cash and Liquidity Management REPORT HIGHLIGHTS
| Aspects | Details |
|---|---|
| Study Period | 2020-2034 |
| Base Year | 2025 |
| Estimated Year | 2026 |
| Forecast Period | 2026-2034 |
| Historical Period | 2020-2025 |
| Growth Rate | CAGR of 6.26% from 2020-2034 |
| Segmentation |
|
Table of Contents
- 1. Introduction
- 1.1. Research Scope
- 1.2. Market Segmentation
- 1.3. Research Objective
- 1.4. Definitions and Assumptions
- 2. Executive Summary
- 2.1. Market Snapshot
- 3. Market Dynamics
- 3.1. Market Drivers
- 3.2. Market Restrains
- 3.3. Market Trends
- 3.4. Market Opportunities
- 4. Market Factor Analysis
- 4.1. Porters Five Forces
- 4.1.1. Bargaining Power of Suppliers
- 4.1.2. Bargaining Power of Buyers
- 4.1.3. Threat of New Entrants
- 4.1.4. Threat of Substitutes
- 4.1.5. Competitive Rivalry
- 4.2. PESTEL analysis
- 4.3. BCG Analysis
- 4.3.1. Stars (High Growth, High Market Share)
- 4.3.2. Cash Cows (Low Growth, High Market Share)
- 4.3.3. Question Mark (High Growth, Low Market Share)
- 4.3.4. Dogs (Low Growth, Low Market Share)
- 4.4. Ansoff Matrix Analysis
- 4.5. Supply Chain Analysis
- 4.6. Regulatory Landscape
- 4.7. Current Market Potential and Opportunity Assessment (TAM–SAM–SOM Framework)
- 4.8. MSR Analyst Note
- 4.1. Porters Five Forces
- 5. Market Analysis, Insights and Forecast 2021-2033
- 5.1. Market Analysis, Insights and Forecast - by Application
- 5.1.1. Corporate Cash Management
- 5.1.2. Government Cash Management
- 5.1.3. Others
- 5.2. Market Analysis, Insights and Forecast - by Types
- 5.2.1. Treasury Management
- 5.2.2. Risk Management
- 5.2.3. Payments
- 5.2.4. Working Capital
- 5.2.5. Others
- 5.3. Market Analysis, Insights and Forecast - by Region
- 5.3.1. North America
- 5.3.2. South America
- 5.3.3. Europe
- 5.3.4. Middle East & Africa
- 5.3.5. Asia Pacific
- 5.1. Market Analysis, Insights and Forecast - by Application
- 6. Global Cash and Liquidity Management Analysis, Insights and Forecast, 2021-2033
- 6.1. Market Analysis, Insights and Forecast - by Application
- 6.1.1. Corporate Cash Management
- 6.1.2. Government Cash Management
- 6.1.3. Others
- 6.2. Market Analysis, Insights and Forecast - by Types
- 6.2.1. Treasury Management
- 6.2.2. Risk Management
- 6.2.3. Payments
- 6.2.4. Working Capital
- 6.2.5. Others
- 6.1. Market Analysis, Insights and Forecast - by Application
- 7. North America Cash and Liquidity Management Analysis, Insights and Forecast, 2020-2032
- 7.1. Market Analysis, Insights and Forecast - by Application
- 7.1.1. Corporate Cash Management
- 7.1.2. Government Cash Management
- 7.1.3. Others
- 7.2. Market Analysis, Insights and Forecast - by Types
- 7.2.1. Treasury Management
- 7.2.2. Risk Management
- 7.2.3. Payments
- 7.2.4. Working Capital
- 7.2.5. Others
- 7.1. Market Analysis, Insights and Forecast - by Application
- 8. South America Cash and Liquidity Management Analysis, Insights and Forecast, 2020-2032
- 8.1. Market Analysis, Insights and Forecast - by Application
- 8.1.1. Corporate Cash Management
- 8.1.2. Government Cash Management
- 8.1.3. Others
- 8.2. Market Analysis, Insights and Forecast - by Types
- 8.2.1. Treasury Management
- 8.2.2. Risk Management
- 8.2.3. Payments
- 8.2.4. Working Capital
- 8.2.5. Others
- 8.1. Market Analysis, Insights and Forecast - by Application
- 9. Europe Cash and Liquidity Management Analysis, Insights and Forecast, 2020-2032
- 9.1. Market Analysis, Insights and Forecast - by Application
- 9.1.1. Corporate Cash Management
- 9.1.2. Government Cash Management
- 9.1.3. Others
- 9.2. Market Analysis, Insights and Forecast - by Types
- 9.2.1. Treasury Management
- 9.2.2. Risk Management
- 9.2.3. Payments
- 9.2.4. Working Capital
- 9.2.5. Others
- 9.1. Market Analysis, Insights and Forecast - by Application
- 10. Middle East & Africa Cash and Liquidity Management Analysis, Insights and Forecast, 2020-2032
- 10.1. Market Analysis, Insights and Forecast - by Application
- 10.1.1. Corporate Cash Management
- 10.1.2. Government Cash Management
- 10.1.3. Others
- 10.2. Market Analysis, Insights and Forecast - by Types
- 10.2.1. Treasury Management
- 10.2.2. Risk Management
- 10.2.3. Payments
- 10.2.4. Working Capital
- 10.2.5. Others
- 10.1. Market Analysis, Insights and Forecast - by Application
- 11. Asia Pacific Cash and Liquidity Management Analysis, Insights and Forecast, 2020-2032
- 11.1. Market Analysis, Insights and Forecast - by Application
- 11.1.1. Corporate Cash Management
- 11.1.2. Government Cash Management
- 11.1.3. Others
- 11.2. Market Analysis, Insights and Forecast - by Types
- 11.2.1. Treasury Management
- 11.2.2. Risk Management
- 11.2.3. Payments
- 11.2.4. Working Capital
- 11.2.5. Others
- 11.1. Market Analysis, Insights and Forecast - by Application
- 12. Competitive Analysis
- 12.1. Company Profiles
- 12.1.1 BNP Paribas
- 12.1.1.1. Company Overview
- 12.1.1.2. Products
- 12.1.1.3. Company Financials
- 12.1.1.4. SWOT Analysis
- 12.1.2 Bank of China
- 12.1.2.1. Company Overview
- 12.1.2.2. Products
- 12.1.2.3. Company Financials
- 12.1.2.4. SWOT Analysis
- 12.1.3 Citigroup Inc
- 12.1.3.1. Company Overview
- 12.1.3.2. Products
- 12.1.3.3. Company Financials
- 12.1.3.4. SWOT Analysis
- 12.1.4 China Exim Bank
- 12.1.4.1. Company Overview
- 12.1.4.2. Products
- 12.1.4.3. Company Financials
- 12.1.4.4. SWOT Analysis
- 12.1.5 ICBC
- 12.1.5.1. Company Overview
- 12.1.5.2. Products
- 12.1.5.3. Company Financials
- 12.1.5.4. SWOT Analysis
- 12.1.6 JPMorgan Chase & Co
- 12.1.6.1. Company Overview
- 12.1.6.2. Products
- 12.1.6.3. Company Financials
- 12.1.6.4. SWOT Analysis
- 12.1.7 Mizuho Financial Group
- 12.1.7.1. Company Overview
- 12.1.7.2. Products
- 12.1.7.3. Company Financials
- 12.1.7.4. SWOT Analysis
- 12.1.8 Standard Chartered
- 12.1.8.1. Company Overview
- 12.1.8.2. Products
- 12.1.8.3. Company Financials
- 12.1.8.4. SWOT Analysis
- 12.1.9 MUFG
- 12.1.9.1. Company Overview
- 12.1.9.2. Products
- 12.1.9.3. Company Financials
- 12.1.9.4. SWOT Analysis
- 12.1.10 Sumitomo Mitsui Banking Corporation
- 12.1.10.1. Company Overview
- 12.1.10.2. Products
- 12.1.10.3. Company Financials
- 12.1.10.4. SWOT Analysis
- 12.1.11 Credit Agricole
- 12.1.11.1. Company Overview
- 12.1.11.2. Products
- 12.1.11.3. Company Financials
- 12.1.11.4. SWOT Analysis
- 12.1.12 Commerzbank
- 12.1.12.1. Company Overview
- 12.1.12.2. Products
- 12.1.12.3. Company Financials
- 12.1.12.4. SWOT Analysis
- 12.1.13 HSBC
- 12.1.13.1. Company Overview
- 12.1.13.2. Products
- 12.1.13.3. Company Financials
- 12.1.13.4. SWOT Analysis
- 12.1.14 Riyad Bank
- 12.1.14.1. Company Overview
- 12.1.14.2. Products
- 12.1.14.3. Company Financials
- 12.1.14.4. SWOT Analysis
- 12.1.15 Saudi British Bank
- 12.1.15.1. Company Overview
- 12.1.15.2. Products
- 12.1.15.3. Company Financials
- 12.1.15.4. SWOT Analysis
- 12.1.16 ANZ
- 12.1.16.1. Company Overview
- 12.1.16.2. Products
- 12.1.16.3. Company Financials
- 12.1.16.4. SWOT Analysis
- 12.1.17 EBRD
- 12.1.17.1. Company Overview
- 12.1.17.2. Products
- 12.1.17.3. Company Financials
- 12.1.17.4. SWOT Analysis
- 12.1.18 Japan Exim Bank
- 12.1.18.1. Company Overview
- 12.1.18.2. Products
- 12.1.18.3. Company Financials
- 12.1.18.4. SWOT Analysis
- 12.1.19 Banque Saudi Fransi
- 12.1.19.1. Company Overview
- 12.1.19.2. Products
- 12.1.19.3. Company Financials
- 12.1.19.4. SWOT Analysis
- 12.1.20 Afreximbank
- 12.1.20.1. Company Overview
- 12.1.20.2. Products
- 12.1.20.3. Company Financials
- 12.1.20.4. SWOT Analysis
- 12.1.21 AlAhli Bank
- 12.1.21.1. Company Overview
- 12.1.21.2. Products
- 12.1.21.3. Company Financials
- 12.1.21.4. SWOT Analysis
- 12.1.22 Export-Import Bank of India
- 12.1.22.1. Company Overview
- 12.1.22.2. Products
- 12.1.22.3. Company Financials
- 12.1.22.4. SWOT Analysis
- 12.1.1 BNP Paribas
- 12.2. Market Entropy
- 12.2.1 Company's Key Areas Served
- 12.2.2 Recent Developments
- 12.3. Company Market Share Analysis 2025
- 12.3.1 Top 5 Companies Market Share Analysis
- 12.3.2 Top 3 Companies Market Share Analysis
- 12.4. List of Potential Customers
- 13. Research Methodology
List of Figures
- Figure 1: Global Cash and Liquidity Management Revenue Breakdown (billion, %) by Region 2025 & 2033
- Figure 2: North America Cash and Liquidity Management Revenue (billion), by Application 2025 & 2033
- Figure 3: North America Cash and Liquidity Management Revenue Share (%), by Application 2025 & 2033
- Figure 4: North America Cash and Liquidity Management Revenue (billion), by Types 2025 & 2033
- Figure 5: North America Cash and Liquidity Management Revenue Share (%), by Types 2025 & 2033
- Figure 6: North America Cash and Liquidity Management Revenue (billion), by Country 2025 & 2033
- Figure 7: North America Cash and Liquidity Management Revenue Share (%), by Country 2025 & 2033
- Figure 8: South America Cash and Liquidity Management Revenue (billion), by Application 2025 & 2033
- Figure 9: South America Cash and Liquidity Management Revenue Share (%), by Application 2025 & 2033
- Figure 10: South America Cash and Liquidity Management Revenue (billion), by Types 2025 & 2033
- Figure 11: South America Cash and Liquidity Management Revenue Share (%), by Types 2025 & 2033
- Figure 12: South America Cash and Liquidity Management Revenue (billion), by Country 2025 & 2033
- Figure 13: South America Cash and Liquidity Management Revenue Share (%), by Country 2025 & 2033
- Figure 14: Europe Cash and Liquidity Management Revenue (billion), by Application 2025 & 2033
- Figure 15: Europe Cash and Liquidity Management Revenue Share (%), by Application 2025 & 2033
- Figure 16: Europe Cash and Liquidity Management Revenue (billion), by Types 2025 & 2033
- Figure 17: Europe Cash and Liquidity Management Revenue Share (%), by Types 2025 & 2033
- Figure 18: Europe Cash and Liquidity Management Revenue (billion), by Country 2025 & 2033
- Figure 19: Europe Cash and Liquidity Management Revenue Share (%), by Country 2025 & 2033
- Figure 20: Middle East & Africa Cash and Liquidity Management Revenue (billion), by Application 2025 & 2033
- Figure 21: Middle East & Africa Cash and Liquidity Management Revenue Share (%), by Application 2025 & 2033
- Figure 22: Middle East & Africa Cash and Liquidity Management Revenue (billion), by Types 2025 & 2033
- Figure 23: Middle East & Africa Cash and Liquidity Management Revenue Share (%), by Types 2025 & 2033
- Figure 24: Middle East & Africa Cash and Liquidity Management Revenue (billion), by Country 2025 & 2033
- Figure 25: Middle East & Africa Cash and Liquidity Management Revenue Share (%), by Country 2025 & 2033
- Figure 26: Asia Pacific Cash and Liquidity Management Revenue (billion), by Application 2025 & 2033
- Figure 27: Asia Pacific Cash and Liquidity Management Revenue Share (%), by Application 2025 & 2033
- Figure 28: Asia Pacific Cash and Liquidity Management Revenue (billion), by Types 2025 & 2033
- Figure 29: Asia Pacific Cash and Liquidity Management Revenue Share (%), by Types 2025 & 2033
- Figure 30: Asia Pacific Cash and Liquidity Management Revenue (billion), by Country 2025 & 2033
- Figure 31: Asia Pacific Cash and Liquidity Management Revenue Share (%), by Country 2025 & 2033
List of Tables
- Table 1: Global Cash and Liquidity Management Revenue billion Forecast, by Application 2020 & 2033
- Table 2: Global Cash and Liquidity Management Revenue billion Forecast, by Types 2020 & 2033
- Table 3: Global Cash and Liquidity Management Revenue billion Forecast, by Region 2020 & 2033
- Table 4: Global Cash and Liquidity Management Revenue billion Forecast, by Application 2020 & 2033
- Table 5: Global Cash and Liquidity Management Revenue billion Forecast, by Types 2020 & 2033
- Table 6: Global Cash and Liquidity Management Revenue billion Forecast, by Country 2020 & 2033
- Table 7: United States Cash and Liquidity Management Revenue (billion) Forecast, by Application 2020 & 2033
- Table 8: Canada Cash and Liquidity Management Revenue (billion) Forecast, by Application 2020 & 2033
- Table 9: Mexico Cash and Liquidity Management Revenue (billion) Forecast, by Application 2020 & 2033
- Table 10: Global Cash and Liquidity Management Revenue billion Forecast, by Application 2020 & 2033
- Table 11: Global Cash and Liquidity Management Revenue billion Forecast, by Types 2020 & 2033
- Table 12: Global Cash and Liquidity Management Revenue billion Forecast, by Country 2020 & 2033
- Table 13: Brazil Cash and Liquidity Management Revenue (billion) Forecast, by Application 2020 & 2033
- Table 14: Argentina Cash and Liquidity Management Revenue (billion) Forecast, by Application 2020 & 2033
- Table 15: Rest of South America Cash and Liquidity Management Revenue (billion) Forecast, by Application 2020 & 2033
- Table 16: Global Cash and Liquidity Management Revenue billion Forecast, by Application 2020 & 2033
- Table 17: Global Cash and Liquidity Management Revenue billion Forecast, by Types 2020 & 2033
- Table 18: Global Cash and Liquidity Management Revenue billion Forecast, by Country 2020 & 2033
- Table 19: United Kingdom Cash and Liquidity Management Revenue (billion) Forecast, by Application 2020 & 2033
- Table 20: Germany Cash and Liquidity Management Revenue (billion) Forecast, by Application 2020 & 2033
- Table 21: France Cash and Liquidity Management Revenue (billion) Forecast, by Application 2020 & 2033
- Table 22: Italy Cash and Liquidity Management Revenue (billion) Forecast, by Application 2020 & 2033
- Table 23: Spain Cash and Liquidity Management Revenue (billion) Forecast, by Application 2020 & 2033
- Table 24: Russia Cash and Liquidity Management Revenue (billion) Forecast, by Application 2020 & 2033
- Table 25: Benelux Cash and Liquidity Management Revenue (billion) Forecast, by Application 2020 & 2033
- Table 26: Nordics Cash and Liquidity Management Revenue (billion) Forecast, by Application 2020 & 2033
- Table 27: Rest of Europe Cash and Liquidity Management Revenue (billion) Forecast, by Application 2020 & 2033
- Table 28: Global Cash and Liquidity Management Revenue billion Forecast, by Application 2020 & 2033
- Table 29: Global Cash and Liquidity Management Revenue billion Forecast, by Types 2020 & 2033
- Table 30: Global Cash and Liquidity Management Revenue billion Forecast, by Country 2020 & 2033
- Table 31: Turkey Cash and Liquidity Management Revenue (billion) Forecast, by Application 2020 & 2033
- Table 32: Israel Cash and Liquidity Management Revenue (billion) Forecast, by Application 2020 & 2033
- Table 33: GCC Cash and Liquidity Management Revenue (billion) Forecast, by Application 2020 & 2033
- Table 34: North Africa Cash and Liquidity Management Revenue (billion) Forecast, by Application 2020 & 2033
- Table 35: South Africa Cash and Liquidity Management Revenue (billion) Forecast, by Application 2020 & 2033
- Table 36: Rest of Middle East & Africa Cash and Liquidity Management Revenue (billion) Forecast, by Application 2020 & 2033
- Table 37: Global Cash and Liquidity Management Revenue billion Forecast, by Application 2020 & 2033
- Table 38: Global Cash and Liquidity Management Revenue billion Forecast, by Types 2020 & 2033
- Table 39: Global Cash and Liquidity Management Revenue billion Forecast, by Country 2020 & 2033
- Table 40: China Cash and Liquidity Management Revenue (billion) Forecast, by Application 2020 & 2033
- Table 41: India Cash and Liquidity Management Revenue (billion) Forecast, by Application 2020 & 2033
- Table 42: Japan Cash and Liquidity Management Revenue (billion) Forecast, by Application 2020 & 2033
- Table 43: South Korea Cash and Liquidity Management Revenue (billion) Forecast, by Application 2020 & 2033
- Table 44: ASEAN Cash and Liquidity Management Revenue (billion) Forecast, by Application 2020 & 2033
- Table 45: Oceania Cash and Liquidity Management Revenue (billion) Forecast, by Application 2020 & 2033
- Table 46: Rest of Asia Pacific Cash and Liquidity Management Revenue (billion) Forecast, by Application 2020 & 2033
Frequently Asked Questions
1. What is the projected Compound Annual Growth Rate (CAGR) of the Cash and Liquidity Management?
The projected CAGR is approximately 6.26%.
2. Which companies are prominent players in the Cash and Liquidity Management?
Key companies in the market include BNP Paribas, Bank of China, Citigroup Inc, China Exim Bank, ICBC, JPMorgan Chase & Co, Mizuho Financial Group, Standard Chartered, MUFG, Sumitomo Mitsui Banking Corporation, Credit Agricole, Commerzbank, HSBC, Riyad Bank, Saudi British Bank, ANZ, EBRD, Japan Exim Bank, Banque Saudi Fransi, Afreximbank, AlAhli Bank, Export-Import Bank of India.
3. What are the main segments of the Cash and Liquidity Management?
The market segments include Application, Types.
4. Can you provide details about the market size?
The market size is estimated to be USD 15.32 billion as of 2022.
5. What are some drivers contributing to market growth?
N/A
6. What are the notable trends driving market growth?
N/A
7. Are there any restraints impacting market growth?
N/A
8. Can you provide examples of recent developments in the market?
N/A
9. What pricing options are available for accessing the report?
Pricing options include single-user, multi-user, and enterprise licenses priced at USD 3950.00, USD 5925.00, and USD 7900.00 respectively.
10. Is the market size provided in terms of value or volume?
The market size is provided in terms of value, measured in billion.
11. Are there any specific market keywords associated with the report?
Yes, the market keyword associated with the report is "Cash and Liquidity Management," which aids in identifying and referencing the specific market segment covered.
12. How do I determine which pricing option suits my needs best?
The pricing options vary based on user requirements and access needs. Individual users may opt for single-user licenses, while businesses requiring broader access may choose multi-user or enterprise licenses for cost-effective access to the report.
13. Are there any additional resources or data provided in the Cash and Liquidity Management report?
While the report offers comprehensive insights, it's advisable to review the specific contents or supplementary materials provided to ascertain if additional resources or data are available.
14. How can I stay updated on further developments or reports in the Cash and Liquidity Management?
To stay informed about further developments, trends, and reports in the Cash and Liquidity Management, consider subscribing to industry newsletters, following relevant companies and organizations, or regularly checking reputable industry news sources and publications.
Methodology
Step 1 - Identification of Relevant Samples Size from Population Database


Step 2 - Approaches for Defining Global Market Size (Value, Volume* & Price*)

Note*: In applicable scenarios
Step 3 - Data Sources
Primary Research
- Web Analytics
- Survey Reports
- Research Institute
- Latest Research Reports
- Opinion Leaders
Secondary Research
- Annual Reports
- White Paper
- Latest Press Release
- Industry Association
- Paid Database
- Investor Presentations

Step 4 - Data Triangulation
Involves using different sources of information in order to increase the validity of a study
These sources are likely to be stakeholders in a program - participants, other researchers, program staff, other community members, and so on.
Then we put all data in single framework & apply various statistical tools to find out the dynamic on the market.
During the analysis stage, feedback from the stakeholder groups would be compared to determine areas of agreement as well as areas of divergence