

Key Insights
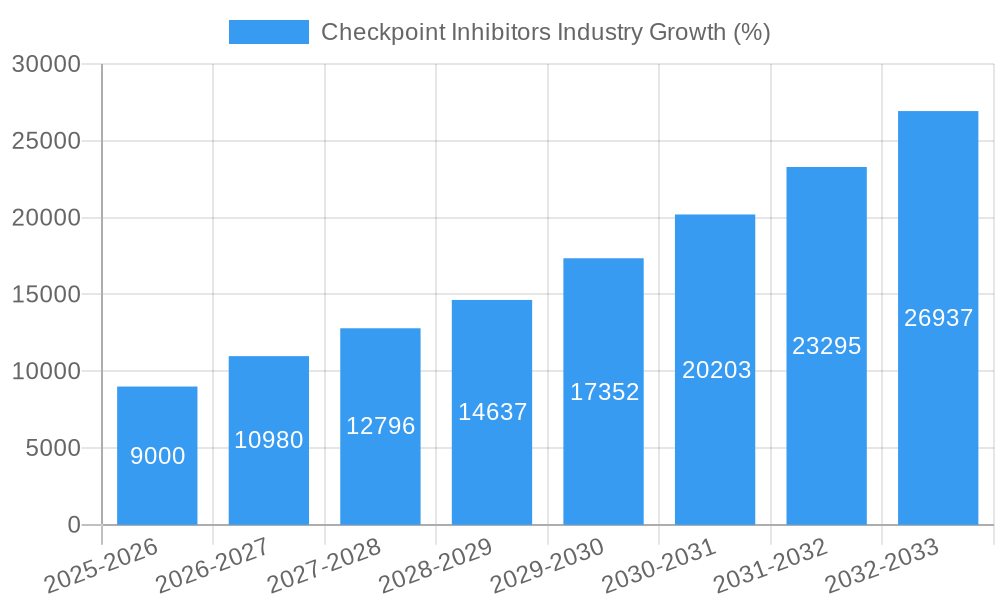
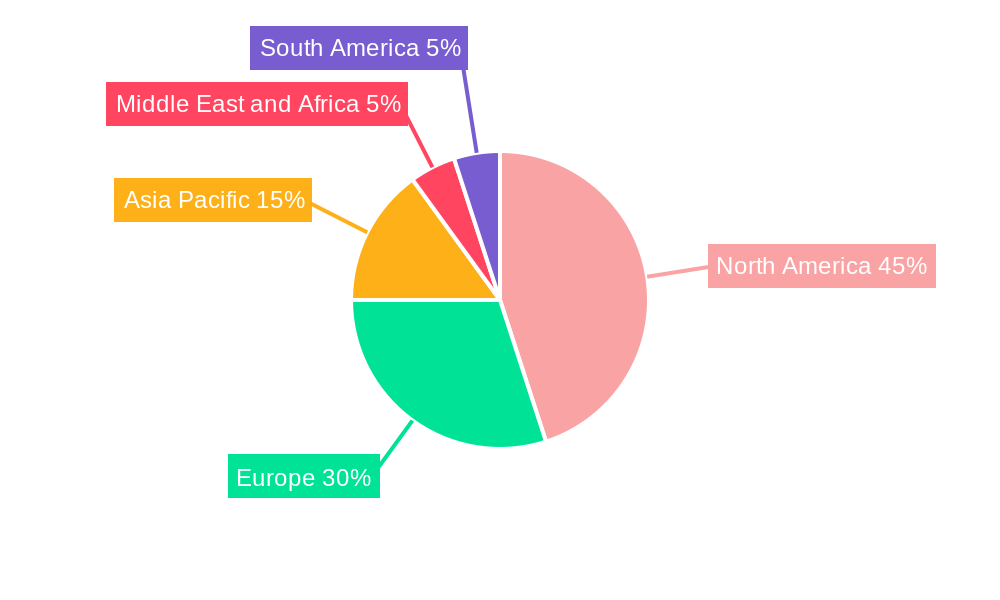
The Checkpoint Inhibitors market is experiencing robust growth, projected to reach a substantial size due to the increasing prevalence of cancers like lung, kidney, and melanoma, coupled with the rising success rates of immunotherapy treatments. The market's Compound Annual Growth Rate (CAGR) of 18% from 2019 to 2024 indicates a significant upward trajectory. This growth is fueled by several key drivers, including the continuous development of novel checkpoint inhibitors targeting various cancer types, increased investments in research and development by pharmaceutical companies, and expanding awareness among healthcare professionals and patients regarding the efficacy of these therapies. The market segmentation highlights the dominance of PD-1 and CTLA-4 inhibitors, with a substantial portion of the revenue attributed to their use in treating Hodgkin lymphoma, Non-small cell lung cancer, and melanoma. Hospital pharmacies currently represent the largest distribution channel, reflecting the complexity of administering these therapies. However, the increasing accessibility and convenience of online pharmacies is expected to contribute to market expansion in the coming years. Geographical analysis suggests North America currently holds a significant market share, driven by high healthcare expenditure and technological advancements, but the Asia-Pacific region is projected to show substantial growth due to increasing healthcare awareness and improving healthcare infrastructure.
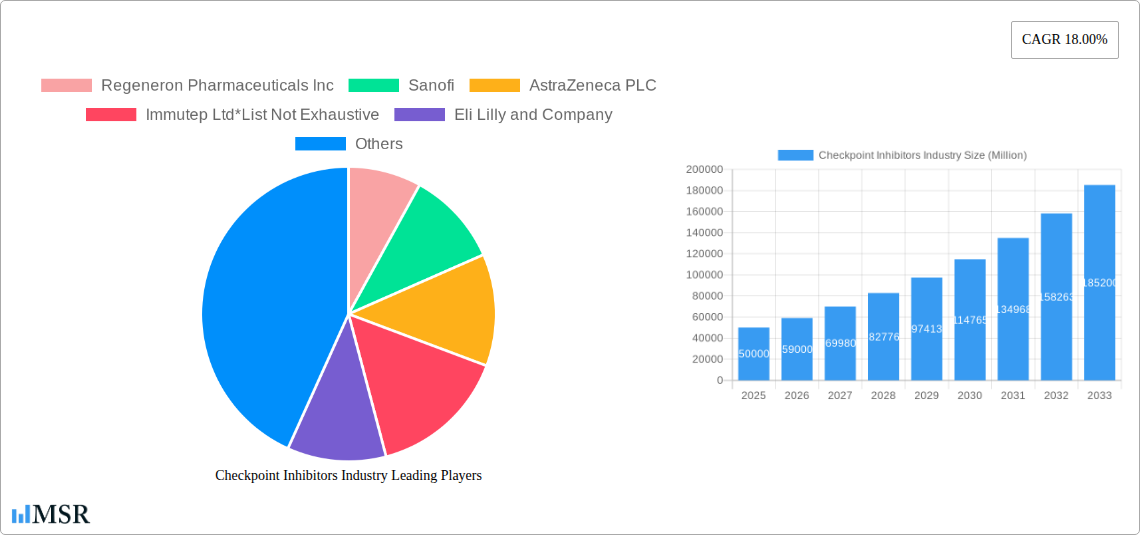
The competitive landscape is highly dynamic, with key players such as Regeneron Pharmaceuticals, Sanofi, AstraZeneca, Eli Lilly, Roche, and Bristol-Myers Squibb actively involved in developing and commercializing innovative checkpoint inhibitors. Strategic alliances, mergers and acquisitions, and a focus on personalized medicine are prominent strategies employed by these companies to maintain their market positions. While the market faces certain restraints, including high treatment costs, potential adverse effects, and the development of resistance mechanisms, ongoing research into combination therapies and improved drug delivery systems is expected to address these challenges and continue fueling the market's growth. This expansion will likely continue throughout the forecast period (2025-2033), solidifying the position of checkpoint inhibitors as a cornerstone of cancer treatment. Continued research into improving efficacy and reducing side effects will likely further drive market growth.
Checkpoint Inhibitors Industry: A Comprehensive Market Report (2019-2033)
This comprehensive report provides an in-depth analysis of the Checkpoint Inhibitors industry, encompassing market size, segmentation, key players, growth drivers, and future outlook. The study period covers 2019-2033, with 2025 as the base and estimated year. This report is crucial for investors, industry stakeholders, and researchers seeking a complete understanding of this rapidly evolving sector. The global market value is projected to reach xx Million by 2033.
Checkpoint Inhibitors Industry Market Concentration & Dynamics
The Checkpoint Inhibitors market exhibits a moderately concentrated landscape, with a few key players holding significant market share. The industry is characterized by intense competition, driven by continuous innovation and the introduction of novel therapies. This competitive environment fuels mergers and acquisitions (M&A) activity, as larger companies seek to expand their portfolios and enhance their market position. The global market share of the top 5 players is estimated at xx%, while the remaining market share is distributed among numerous smaller companies.
Market Dynamics:
- Innovation Ecosystem: Significant investments in R&D are driving the development of next-generation checkpoint inhibitors, including combination therapies targeting multiple immune checkpoints and personalized medicine approaches.
- Regulatory Frameworks: Regulatory approvals for new therapies play a vital role in shaping market dynamics. Stringent regulatory processes ensure patient safety and efficacy, which can impact market entry timelines and product lifecycles.
- Substitute Products: While currently limited, the development of alternative cancer therapies might pose a potential threat in the long term.
- End-User Trends: Growing awareness of immunotherapy and the increasing prevalence of cancer are key factors driving market growth. Patient preferences and treatment outcomes further influence market dynamics.
- M&A Activities: The number of M&A deals in the Checkpoint Inhibitors industry has increased significantly over the past five years, averaging approximately xx deals annually. These deals are driven by the desire to gain access to innovative technologies, expand market reach, and strengthen competitive positions.
Checkpoint Inhibitors Industry Insights & Trends
The Checkpoint Inhibitors market is experiencing robust growth, fueled by several key factors. The market size is projected to reach xx Million by 2033, exhibiting a Compound Annual Growth Rate (CAGR) of xx% during the forecast period (2025-2033). Technological advancements, such as the development of novel combinations of checkpoint inhibitors and their use with other cancer therapies, are driving innovation and expanding treatment options.
Increased adoption of targeted therapies and personalized medicine is another major trend, tailoring treatment approaches to individual patient profiles for improved outcomes. Rising prevalence of various cancer types, such as melanoma, lung cancer, and kidney cancer, contribute significantly to market expansion. The rising geriatric population globally also increases the market demand for advanced cancer treatment options.
Key Markets & Segments Leading Checkpoint Inhibitors Industry
The North American region dominates the Checkpoint Inhibitors market, driven by factors like high healthcare expenditure, robust research and development activities, and early adoption of innovative therapies. Within this region, the United States holds the largest market share due to its advanced healthcare infrastructure, high prevalence of cancer, and high reimbursement rates.
Key Market Drivers:
- By Type of Inhibitors: PD-1 Inhibitors currently represent the largest segment, followed by CTLA-4 Inhibitors. Other types of inhibitors are also witnessing growth due to ongoing research and development.
- By Application: Melanoma, Non-small cell lung cancer, and kidney cancers are the leading application segments due to their high prevalence and the established efficacy of checkpoint inhibitors in these cancer types. Hodgkin Lymphoma is also a growing segment for checkpoint inhibitor usage.
- By Distribution Channel: Hospital pharmacies are the dominant distribution channel, reflecting the complexity of administering these therapies and the need for specialized healthcare professionals. However, retail and online pharmacies are gaining traction.
Dominance Analysis:
The US market dominance is attributed to high cancer incidence rates, robust healthcare infrastructure and investments in R&D, early adoption of innovative cancer therapies and high healthcare expenditure. The European market, while also significant, lags behind the US in market size, influenced by variations in healthcare systems and reimbursement policies. Asian markets show significant growth potential owing to increasing awareness and infrastructure development.
Checkpoint Inhibitors Industry Product Developments
Significant advancements in checkpoint inhibitor technology are ongoing, focusing on improving efficacy, reducing side effects, and expanding therapeutic applications. Combination therapies involving multiple checkpoint inhibitors or combining checkpoint inhibitors with other cancer treatments are gaining momentum. Personalized medicine approaches, tailoring treatment to individual patient genetic profiles, are also advancing the field, leading to better outcomes and improved patient selection criteria. This results in improved treatment efficacy and reduced side effects, enhancing their competitive advantage in the market.
Challenges in the Checkpoint Inhibitors Industry Market
The Checkpoint Inhibitors market faces challenges such as high development costs, stringent regulatory requirements, and potential for adverse events. The high cost of therapy can limit patient access, especially in regions with limited healthcare resources. Supply chain disruptions can affect availability, while intense competition among major players necessitates continuous innovation to maintain a competitive edge. The complexities of manufacturing and storage of these sensitive biological drugs present logistic hurdles impacting global accessibility. The market growth is impacted by the limited number of approved indications, which means these drugs are not applicable to all cancer types.
Forces Driving Checkpoint Inhibitors Industry Growth
Several factors drive the growth of the Checkpoint Inhibitors market. These include technological advancements like improved formulations and combination therapies, leading to better efficacy and reduced side effects. Economic factors, such as increased healthcare spending and insurance coverage, expand market access. Favorable regulatory frameworks, including expedited approval pathways for innovative therapies, accelerate market entry. The increased prevalence of various cancer types fuels market expansion.
Long-Term Growth Catalysts in the Checkpoint Inhibitors Industry
Long-term growth is fueled by continuous innovation in drug development, leading to more effective and targeted therapies. Strategic partnerships between pharmaceutical companies and research institutions enhance R&D capabilities and speed up the development process. Expansion into new markets with growing cancer prevalence and increasing healthcare spending presents significant growth opportunities. Development of combination therapies and personalized medicine approaches improves patient outcomes, further boosting market growth.
Emerging Opportunities in Checkpoint Inhibitors Industry
Emerging opportunities exist in the development of next-generation checkpoint inhibitors with enhanced efficacy and safety profiles. Expansion into new therapeutic areas beyond oncology, such as autoimmune diseases, presents promising growth avenues. Personalized medicine approaches, utilizing biomarker testing to identify patients who will benefit most from treatment, are opening up new possibilities. Growing adoption of advanced diagnostic technologies for precise patient selection further enhances market expansion.
Leading Players in the Checkpoint Inhibitors Industry Sector
- Regeneron Pharmaceuticals Inc
- Sanofi
- AstraZeneca PLC
- Immutep Ltd
- Eli Lilly and Company
- F Hoffmann-La Roche AG
- BeiGene Ltd
- Shanghai Jhunsi Biosciences Ltd
- Merck & Co
- Bristol-Myers Squibb Company
- GlaxoSmithKline PLC
Key Milestones in Checkpoint Inhibitors Industry Industry
- April 2022: Bristol Myers Squibb received European Commission approval for Opdivo (nivolumab) with chemotherapy as a first-line treatment for unresectable advanced, recurrent, or metastatic esophageal squamous cell carcinoma with tumor cell PD-L1 expression of 1%. This expanded the treatment options and market for Opdivo significantly.
- March 2022: Merck announced FDA approval of KEYTRUDA (pembrolizumab), its anti-PD-1 therapy, as a single agent for treating patients with advanced endometrial carcinoma that is MSI-H or dMMR, who have disease progression following prior systemic therapy and are not candidates for curative surgery or radiation. This approval broadened KEYTRUDA's applicability and boosted its market share.
Strategic Outlook for Checkpoint Inhibitors Industry Market
The Checkpoint Inhibitors market presents significant growth potential over the next decade, driven by continuous innovation, expanding therapeutic applications, and increasing market penetration. Strategic partnerships, targeted R&D investments, and early market entry for novel therapies will be critical for success. Focusing on personalized medicine approaches and addressing unmet medical needs are key to capturing substantial market share and driving sustainable growth. A focus on streamlined manufacturing and efficient supply chains is also necessary to maintain global accessibility and affordability for this life-saving therapy.
Checkpoint Inhibitors Industry Segmentation
-
1. Type of Inhibitors
- 1.1. CTLA-4 Inhibitors
- 1.2. PD-1 Inhibitors
- 1.3. Other Types of Inhibitors
-
2. Application
- 2.1. Hodgkin Lymphoma
- 2.2. Kidney Cancers
- 2.3. Melanoma
- 2.4. Non-small Cell Lung Cancer
- 2.5. Other Applications
-
3. Distribution Channel
- 3.1. Hospital Pharmacies
- 3.2. Retail Pharmacies
- 3.3. Online Pharmacies
Checkpoint Inhibitors Industry Segmentation By Geography
-
1. North America
- 1.1. United states
- 1.2. Canada
- 1.3. Mexico
-
2. Europe
- 2.1. Germany
- 2.2. United Kingdom
- 2.3. France
- 2.4. Italy
- 2.5. Spain
- 2.6. Rest of Europe
-
3. Asia Pacific
- 3.1. China
- 3.2. Japan
- 3.3. India
- 3.4. Australia
- 3.5. South Korea
- 3.6. Rest of Asia Pacific
-
4. Middle East and Africa
- 4.1. GCC
- 4.2. South Africa
- 4.3. Rest of Middle East and Africa
-
5. South America
- 5.1. Brazil
- 5.2. Argentina
- 5.3. Rest of South America
Checkpoint Inhibitors Industry REPORT HIGHLIGHTS
| Aspects | Details |
|---|---|
| Study Period | 2019-2033 |
| Base Year | 2024 |
| Estimated Year | 2025 |
| Forecast Period | 2025-2033 |
| Historical Period | 2019-2024 |
| Growth Rate | CAGR of 18.00% from 2019-2033 |
| Segmentation |
|
Table of Contents
- 1. Introduction
- 1.1. Research Scope
- 1.2. Market Segmentation
- 1.3. Research Methodology
- 1.4. Definitions and Assumptions
- 2. Executive Summary
- 2.1. Introduction
- 3. Market Dynamics
- 3.1. Introduction
- 3.2. Market Drivers
- 3.2.1. Rising Investments in R&D and Clinical Trials by the Biopharmaceutical Industry to Develop these Products; Increased Product Approvals by Regulatory Authorities and Special Designations for New Drug Molecules
- 3.3. Market Restrains
- 3.3.1. Higher Risk of Complications Associated with the Expensive Oncology Treatment
- 3.4. Market Trends
- 3.4.1. The PD-1 Inhibitors Segment is Expected to Hold the Largest Market Share in the Immune Checkpoint Inhibitors Market
- 4. Market Factor Analysis
- 4.1. Porters Five Forces
- 4.2. Supply/Value Chain
- 4.3. PESTEL analysis
- 4.4. Market Entropy
- 4.5. Patent/Trademark Analysis
- 5. Global Checkpoint Inhibitors Industry Analysis, Insights and Forecast, 2019-2031
- 5.1. Market Analysis, Insights and Forecast - by Type of Inhibitors
- 5.1.1. CTLA-4 Inhibitors
- 5.1.2. PD-1 Inhibitors
- 5.1.3. Other Types of Inhibitors
- 5.2. Market Analysis, Insights and Forecast - by Application
- 5.2.1. Hodgkin Lymphoma
- 5.2.2. Kidney Cancers
- 5.2.3. Melanoma
- 5.2.4. Non-small Cell Lung Cancer
- 5.2.5. Other Applications
- 5.3. Market Analysis, Insights and Forecast - by Distribution Channel
- 5.3.1. Hospital Pharmacies
- 5.3.2. Retail Pharmacies
- 5.3.3. Online Pharmacies
- 5.4. Market Analysis, Insights and Forecast - by Region
- 5.4.1. North America
- 5.4.2. Europe
- 5.4.3. Asia Pacific
- 5.4.4. Middle East and Africa
- 5.4.5. South America
- 5.1. Market Analysis, Insights and Forecast - by Type of Inhibitors
- 6. North America Checkpoint Inhibitors Industry Analysis, Insights and Forecast, 2019-2031
- 6.1. Market Analysis, Insights and Forecast - by Type of Inhibitors
- 6.1.1. CTLA-4 Inhibitors
- 6.1.2. PD-1 Inhibitors
- 6.1.3. Other Types of Inhibitors
- 6.2. Market Analysis, Insights and Forecast - by Application
- 6.2.1. Hodgkin Lymphoma
- 6.2.2. Kidney Cancers
- 6.2.3. Melanoma
- 6.2.4. Non-small Cell Lung Cancer
- 6.2.5. Other Applications
- 6.3. Market Analysis, Insights and Forecast - by Distribution Channel
- 6.3.1. Hospital Pharmacies
- 6.3.2. Retail Pharmacies
- 6.3.3. Online Pharmacies
- 6.1. Market Analysis, Insights and Forecast - by Type of Inhibitors
- 7. Europe Checkpoint Inhibitors Industry Analysis, Insights and Forecast, 2019-2031
- 7.1. Market Analysis, Insights and Forecast - by Type of Inhibitors
- 7.1.1. CTLA-4 Inhibitors
- 7.1.2. PD-1 Inhibitors
- 7.1.3. Other Types of Inhibitors
- 7.2. Market Analysis, Insights and Forecast - by Application
- 7.2.1. Hodgkin Lymphoma
- 7.2.2. Kidney Cancers
- 7.2.3. Melanoma
- 7.2.4. Non-small Cell Lung Cancer
- 7.2.5. Other Applications
- 7.3. Market Analysis, Insights and Forecast - by Distribution Channel
- 7.3.1. Hospital Pharmacies
- 7.3.2. Retail Pharmacies
- 7.3.3. Online Pharmacies
- 7.1. Market Analysis, Insights and Forecast - by Type of Inhibitors
- 8. Asia Pacific Checkpoint Inhibitors Industry Analysis, Insights and Forecast, 2019-2031
- 8.1. Market Analysis, Insights and Forecast - by Type of Inhibitors
- 8.1.1. CTLA-4 Inhibitors
- 8.1.2. PD-1 Inhibitors
- 8.1.3. Other Types of Inhibitors
- 8.2. Market Analysis, Insights and Forecast - by Application
- 8.2.1. Hodgkin Lymphoma
- 8.2.2. Kidney Cancers
- 8.2.3. Melanoma
- 8.2.4. Non-small Cell Lung Cancer
- 8.2.5. Other Applications
- 8.3. Market Analysis, Insights and Forecast - by Distribution Channel
- 8.3.1. Hospital Pharmacies
- 8.3.2. Retail Pharmacies
- 8.3.3. Online Pharmacies
- 8.1. Market Analysis, Insights and Forecast - by Type of Inhibitors
- 9. Middle East and Africa Checkpoint Inhibitors Industry Analysis, Insights and Forecast, 2019-2031
- 9.1. Market Analysis, Insights and Forecast - by Type of Inhibitors
- 9.1.1. CTLA-4 Inhibitors
- 9.1.2. PD-1 Inhibitors
- 9.1.3. Other Types of Inhibitors
- 9.2. Market Analysis, Insights and Forecast - by Application
- 9.2.1. Hodgkin Lymphoma
- 9.2.2. Kidney Cancers
- 9.2.3. Melanoma
- 9.2.4. Non-small Cell Lung Cancer
- 9.2.5. Other Applications
- 9.3. Market Analysis, Insights and Forecast - by Distribution Channel
- 9.3.1. Hospital Pharmacies
- 9.3.2. Retail Pharmacies
- 9.3.3. Online Pharmacies
- 9.1. Market Analysis, Insights and Forecast - by Type of Inhibitors
- 10. South America Checkpoint Inhibitors Industry Analysis, Insights and Forecast, 2019-2031
- 10.1. Market Analysis, Insights and Forecast - by Type of Inhibitors
- 10.1.1. CTLA-4 Inhibitors
- 10.1.2. PD-1 Inhibitors
- 10.1.3. Other Types of Inhibitors
- 10.2. Market Analysis, Insights and Forecast - by Application
- 10.2.1. Hodgkin Lymphoma
- 10.2.2. Kidney Cancers
- 10.2.3. Melanoma
- 10.2.4. Non-small Cell Lung Cancer
- 10.2.5. Other Applications
- 10.3. Market Analysis, Insights and Forecast - by Distribution Channel
- 10.3.1. Hospital Pharmacies
- 10.3.2. Retail Pharmacies
- 10.3.3. Online Pharmacies
- 10.1. Market Analysis, Insights and Forecast - by Type of Inhibitors
- 11. North America Checkpoint Inhibitors Industry Analysis, Insights and Forecast, 2019-2031
- 11.1. Market Analysis, Insights and Forecast - By Country/Sub-region
- 11.1.1 United states
- 11.1.2 Canada
- 11.1.3 Mexico
- 12. Europe Checkpoint Inhibitors Industry Analysis, Insights and Forecast, 2019-2031
- 12.1. Market Analysis, Insights and Forecast - By Country/Sub-region
- 12.1.1 Germany
- 12.1.2 United Kingdom
- 12.1.3 France
- 12.1.4 Italy
- 12.1.5 Spain
- 12.1.6 Rest of Europe
- 13. Asia Pacific Checkpoint Inhibitors Industry Analysis, Insights and Forecast, 2019-2031
- 13.1. Market Analysis, Insights and Forecast - By Country/Sub-region
- 13.1.1 China
- 13.1.2 Japan
- 13.1.3 India
- 13.1.4 Australia
- 13.1.5 South Korea
- 13.1.6 Rest of Asia Pacific
- 14. Middle East and Africa Checkpoint Inhibitors Industry Analysis, Insights and Forecast, 2019-2031
- 14.1. Market Analysis, Insights and Forecast - By Country/Sub-region
- 14.1.1 GCC
- 14.1.2 South Africa
- 14.1.3 Rest of Middle East and Africa
- 15. South America Checkpoint Inhibitors Industry Analysis, Insights and Forecast, 2019-2031
- 15.1. Market Analysis, Insights and Forecast - By Country/Sub-region
- 15.1.1 Brazil
- 15.1.2 Argentina
- 15.1.3 Rest of South America
- 16. Competitive Analysis
- 16.1. Global Market Share Analysis 2024
- 16.2. Company Profiles
- 16.2.1 Regeneron Pharmaceuticals Inc
- 16.2.1.1. Overview
- 16.2.1.2. Products
- 16.2.1.3. SWOT Analysis
- 16.2.1.4. Recent Developments
- 16.2.1.5. Financials (Based on Availability)
- 16.2.2 Sanofi
- 16.2.2.1. Overview
- 16.2.2.2. Products
- 16.2.2.3. SWOT Analysis
- 16.2.2.4. Recent Developments
- 16.2.2.5. Financials (Based on Availability)
- 16.2.3 AstraZeneca PLC
- 16.2.3.1. Overview
- 16.2.3.2. Products
- 16.2.3.3. SWOT Analysis
- 16.2.3.4. Recent Developments
- 16.2.3.5. Financials (Based on Availability)
- 16.2.4 Immutep Ltd*List Not Exhaustive
- 16.2.4.1. Overview
- 16.2.4.2. Products
- 16.2.4.3. SWOT Analysis
- 16.2.4.4. Recent Developments
- 16.2.4.5. Financials (Based on Availability)
- 16.2.5 Eli Lilly and Company
- 16.2.5.1. Overview
- 16.2.5.2. Products
- 16.2.5.3. SWOT Analysis
- 16.2.5.4. Recent Developments
- 16.2.5.5. Financials (Based on Availability)
- 16.2.6 F Hoffmann-La Roche AG
- 16.2.6.1. Overview
- 16.2.6.2. Products
- 16.2.6.3. SWOT Analysis
- 16.2.6.4. Recent Developments
- 16.2.6.5. Financials (Based on Availability)
- 16.2.7 BeiGene Ltd
- 16.2.7.1. Overview
- 16.2.7.2. Products
- 16.2.7.3. SWOT Analysis
- 16.2.7.4. Recent Developments
- 16.2.7.5. Financials (Based on Availability)
- 16.2.8 Shanghai Jhunsi Biosciences Ltd
- 16.2.8.1. Overview
- 16.2.8.2. Products
- 16.2.8.3. SWOT Analysis
- 16.2.8.4. Recent Developments
- 16.2.8.5. Financials (Based on Availability)
- 16.2.9 Merck & Co
- 16.2.9.1. Overview
- 16.2.9.2. Products
- 16.2.9.3. SWOT Analysis
- 16.2.9.4. Recent Developments
- 16.2.9.5. Financials (Based on Availability)
- 16.2.10 Bristol-Myers Squibb Company
- 16.2.10.1. Overview
- 16.2.10.2. Products
- 16.2.10.3. SWOT Analysis
- 16.2.10.4. Recent Developments
- 16.2.10.5. Financials (Based on Availability)
- 16.2.11 GlaxoSmithKline PLC
- 16.2.11.1. Overview
- 16.2.11.2. Products
- 16.2.11.3. SWOT Analysis
- 16.2.11.4. Recent Developments
- 16.2.11.5. Financials (Based on Availability)
- 16.2.1 Regeneron Pharmaceuticals Inc
List of Figures
- Figure 1: Global Checkpoint Inhibitors Industry Revenue Breakdown (Million, %) by Region 2024 & 2032
- Figure 2: North America Checkpoint Inhibitors Industry Revenue (Million), by Country 2024 & 2032
- Figure 3: North America Checkpoint Inhibitors Industry Revenue Share (%), by Country 2024 & 2032
- Figure 4: Europe Checkpoint Inhibitors Industry Revenue (Million), by Country 2024 & 2032
- Figure 5: Europe Checkpoint Inhibitors Industry Revenue Share (%), by Country 2024 & 2032
- Figure 6: Asia Pacific Checkpoint Inhibitors Industry Revenue (Million), by Country 2024 & 2032
- Figure 7: Asia Pacific Checkpoint Inhibitors Industry Revenue Share (%), by Country 2024 & 2032
- Figure 8: Middle East and Africa Checkpoint Inhibitors Industry Revenue (Million), by Country 2024 & 2032
- Figure 9: Middle East and Africa Checkpoint Inhibitors Industry Revenue Share (%), by Country 2024 & 2032
- Figure 10: South America Checkpoint Inhibitors Industry Revenue (Million), by Country 2024 & 2032
- Figure 11: South America Checkpoint Inhibitors Industry Revenue Share (%), by Country 2024 & 2032
- Figure 12: North America Checkpoint Inhibitors Industry Revenue (Million), by Type of Inhibitors 2024 & 2032
- Figure 13: North America Checkpoint Inhibitors Industry Revenue Share (%), by Type of Inhibitors 2024 & 2032
- Figure 14: North America Checkpoint Inhibitors Industry Revenue (Million), by Application 2024 & 2032
- Figure 15: North America Checkpoint Inhibitors Industry Revenue Share (%), by Application 2024 & 2032
- Figure 16: North America Checkpoint Inhibitors Industry Revenue (Million), by Distribution Channel 2024 & 2032
- Figure 17: North America Checkpoint Inhibitors Industry Revenue Share (%), by Distribution Channel 2024 & 2032
- Figure 18: North America Checkpoint Inhibitors Industry Revenue (Million), by Country 2024 & 2032
- Figure 19: North America Checkpoint Inhibitors Industry Revenue Share (%), by Country 2024 & 2032
- Figure 20: Europe Checkpoint Inhibitors Industry Revenue (Million), by Type of Inhibitors 2024 & 2032
- Figure 21: Europe Checkpoint Inhibitors Industry Revenue Share (%), by Type of Inhibitors 2024 & 2032
- Figure 22: Europe Checkpoint Inhibitors Industry Revenue (Million), by Application 2024 & 2032
- Figure 23: Europe Checkpoint Inhibitors Industry Revenue Share (%), by Application 2024 & 2032
- Figure 24: Europe Checkpoint Inhibitors Industry Revenue (Million), by Distribution Channel 2024 & 2032
- Figure 25: Europe Checkpoint Inhibitors Industry Revenue Share (%), by Distribution Channel 2024 & 2032
- Figure 26: Europe Checkpoint Inhibitors Industry Revenue (Million), by Country 2024 & 2032
- Figure 27: Europe Checkpoint Inhibitors Industry Revenue Share (%), by Country 2024 & 2032
- Figure 28: Asia Pacific Checkpoint Inhibitors Industry Revenue (Million), by Type of Inhibitors 2024 & 2032
- Figure 29: Asia Pacific Checkpoint Inhibitors Industry Revenue Share (%), by Type of Inhibitors 2024 & 2032
- Figure 30: Asia Pacific Checkpoint Inhibitors Industry Revenue (Million), by Application 2024 & 2032
- Figure 31: Asia Pacific Checkpoint Inhibitors Industry Revenue Share (%), by Application 2024 & 2032
- Figure 32: Asia Pacific Checkpoint Inhibitors Industry Revenue (Million), by Distribution Channel 2024 & 2032
- Figure 33: Asia Pacific Checkpoint Inhibitors Industry Revenue Share (%), by Distribution Channel 2024 & 2032
- Figure 34: Asia Pacific Checkpoint Inhibitors Industry Revenue (Million), by Country 2024 & 2032
- Figure 35: Asia Pacific Checkpoint Inhibitors Industry Revenue Share (%), by Country 2024 & 2032
- Figure 36: Middle East and Africa Checkpoint Inhibitors Industry Revenue (Million), by Type of Inhibitors 2024 & 2032
- Figure 37: Middle East and Africa Checkpoint Inhibitors Industry Revenue Share (%), by Type of Inhibitors 2024 & 2032
- Figure 38: Middle East and Africa Checkpoint Inhibitors Industry Revenue (Million), by Application 2024 & 2032
- Figure 39: Middle East and Africa Checkpoint Inhibitors Industry Revenue Share (%), by Application 2024 & 2032
- Figure 40: Middle East and Africa Checkpoint Inhibitors Industry Revenue (Million), by Distribution Channel 2024 & 2032
- Figure 41: Middle East and Africa Checkpoint Inhibitors Industry Revenue Share (%), by Distribution Channel 2024 & 2032
- Figure 42: Middle East and Africa Checkpoint Inhibitors Industry Revenue (Million), by Country 2024 & 2032
- Figure 43: Middle East and Africa Checkpoint Inhibitors Industry Revenue Share (%), by Country 2024 & 2032
- Figure 44: South America Checkpoint Inhibitors Industry Revenue (Million), by Type of Inhibitors 2024 & 2032
- Figure 45: South America Checkpoint Inhibitors Industry Revenue Share (%), by Type of Inhibitors 2024 & 2032
- Figure 46: South America Checkpoint Inhibitors Industry Revenue (Million), by Application 2024 & 2032
- Figure 47: South America Checkpoint Inhibitors Industry Revenue Share (%), by Application 2024 & 2032
- Figure 48: South America Checkpoint Inhibitors Industry Revenue (Million), by Distribution Channel 2024 & 2032
- Figure 49: South America Checkpoint Inhibitors Industry Revenue Share (%), by Distribution Channel 2024 & 2032
- Figure 50: South America Checkpoint Inhibitors Industry Revenue (Million), by Country 2024 & 2032
- Figure 51: South America Checkpoint Inhibitors Industry Revenue Share (%), by Country 2024 & 2032
List of Tables
- Table 1: Global Checkpoint Inhibitors Industry Revenue Million Forecast, by Region 2019 & 2032
- Table 2: Global Checkpoint Inhibitors Industry Revenue Million Forecast, by Type of Inhibitors 2019 & 2032
- Table 3: Global Checkpoint Inhibitors Industry Revenue Million Forecast, by Application 2019 & 2032
- Table 4: Global Checkpoint Inhibitors Industry Revenue Million Forecast, by Distribution Channel 2019 & 2032
- Table 5: Global Checkpoint Inhibitors Industry Revenue Million Forecast, by Region 2019 & 2032
- Table 6: Global Checkpoint Inhibitors Industry Revenue Million Forecast, by Country 2019 & 2032
- Table 7: United states Checkpoint Inhibitors Industry Revenue (Million) Forecast, by Application 2019 & 2032
- Table 8: Canada Checkpoint Inhibitors Industry Revenue (Million) Forecast, by Application 2019 & 2032
- Table 9: Mexico Checkpoint Inhibitors Industry Revenue (Million) Forecast, by Application 2019 & 2032
- Table 10: Global Checkpoint Inhibitors Industry Revenue Million Forecast, by Country 2019 & 2032
- Table 11: Germany Checkpoint Inhibitors Industry Revenue (Million) Forecast, by Application 2019 & 2032
- Table 12: United Kingdom Checkpoint Inhibitors Industry Revenue (Million) Forecast, by Application 2019 & 2032
- Table 13: France Checkpoint Inhibitors Industry Revenue (Million) Forecast, by Application 2019 & 2032
- Table 14: Italy Checkpoint Inhibitors Industry Revenue (Million) Forecast, by Application 2019 & 2032
- Table 15: Spain Checkpoint Inhibitors Industry Revenue (Million) Forecast, by Application 2019 & 2032
- Table 16: Rest of Europe Checkpoint Inhibitors Industry Revenue (Million) Forecast, by Application 2019 & 2032
- Table 17: Global Checkpoint Inhibitors Industry Revenue Million Forecast, by Country 2019 & 2032
- Table 18: China Checkpoint Inhibitors Industry Revenue (Million) Forecast, by Application 2019 & 2032
- Table 19: Japan Checkpoint Inhibitors Industry Revenue (Million) Forecast, by Application 2019 & 2032
- Table 20: India Checkpoint Inhibitors Industry Revenue (Million) Forecast, by Application 2019 & 2032
- Table 21: Australia Checkpoint Inhibitors Industry Revenue (Million) Forecast, by Application 2019 & 2032
- Table 22: South Korea Checkpoint Inhibitors Industry Revenue (Million) Forecast, by Application 2019 & 2032
- Table 23: Rest of Asia Pacific Checkpoint Inhibitors Industry Revenue (Million) Forecast, by Application 2019 & 2032
- Table 24: Global Checkpoint Inhibitors Industry Revenue Million Forecast, by Country 2019 & 2032
- Table 25: GCC Checkpoint Inhibitors Industry Revenue (Million) Forecast, by Application 2019 & 2032
- Table 26: South Africa Checkpoint Inhibitors Industry Revenue (Million) Forecast, by Application 2019 & 2032
- Table 27: Rest of Middle East and Africa Checkpoint Inhibitors Industry Revenue (Million) Forecast, by Application 2019 & 2032
- Table 28: Global Checkpoint Inhibitors Industry Revenue Million Forecast, by Country 2019 & 2032
- Table 29: Brazil Checkpoint Inhibitors Industry Revenue (Million) Forecast, by Application 2019 & 2032
- Table 30: Argentina Checkpoint Inhibitors Industry Revenue (Million) Forecast, by Application 2019 & 2032
- Table 31: Rest of South America Checkpoint Inhibitors Industry Revenue (Million) Forecast, by Application 2019 & 2032
- Table 32: Global Checkpoint Inhibitors Industry Revenue Million Forecast, by Type of Inhibitors 2019 & 2032
- Table 33: Global Checkpoint Inhibitors Industry Revenue Million Forecast, by Application 2019 & 2032
- Table 34: Global Checkpoint Inhibitors Industry Revenue Million Forecast, by Distribution Channel 2019 & 2032
- Table 35: Global Checkpoint Inhibitors Industry Revenue Million Forecast, by Country 2019 & 2032
- Table 36: United states Checkpoint Inhibitors Industry Revenue (Million) Forecast, by Application 2019 & 2032
- Table 37: Canada Checkpoint Inhibitors Industry Revenue (Million) Forecast, by Application 2019 & 2032
- Table 38: Mexico Checkpoint Inhibitors Industry Revenue (Million) Forecast, by Application 2019 & 2032
- Table 39: Global Checkpoint Inhibitors Industry Revenue Million Forecast, by Type of Inhibitors 2019 & 2032
- Table 40: Global Checkpoint Inhibitors Industry Revenue Million Forecast, by Application 2019 & 2032
- Table 41: Global Checkpoint Inhibitors Industry Revenue Million Forecast, by Distribution Channel 2019 & 2032
- Table 42: Global Checkpoint Inhibitors Industry Revenue Million Forecast, by Country 2019 & 2032
- Table 43: Germany Checkpoint Inhibitors Industry Revenue (Million) Forecast, by Application 2019 & 2032
- Table 44: United Kingdom Checkpoint Inhibitors Industry Revenue (Million) Forecast, by Application 2019 & 2032
- Table 45: France Checkpoint Inhibitors Industry Revenue (Million) Forecast, by Application 2019 & 2032
- Table 46: Italy Checkpoint Inhibitors Industry Revenue (Million) Forecast, by Application 2019 & 2032
- Table 47: Spain Checkpoint Inhibitors Industry Revenue (Million) Forecast, by Application 2019 & 2032
- Table 48: Rest of Europe Checkpoint Inhibitors Industry Revenue (Million) Forecast, by Application 2019 & 2032
- Table 49: Global Checkpoint Inhibitors Industry Revenue Million Forecast, by Type of Inhibitors 2019 & 2032
- Table 50: Global Checkpoint Inhibitors Industry Revenue Million Forecast, by Application 2019 & 2032
- Table 51: Global Checkpoint Inhibitors Industry Revenue Million Forecast, by Distribution Channel 2019 & 2032
- Table 52: Global Checkpoint Inhibitors Industry Revenue Million Forecast, by Country 2019 & 2032
- Table 53: China Checkpoint Inhibitors Industry Revenue (Million) Forecast, by Application 2019 & 2032
- Table 54: Japan Checkpoint Inhibitors Industry Revenue (Million) Forecast, by Application 2019 & 2032
- Table 55: India Checkpoint Inhibitors Industry Revenue (Million) Forecast, by Application 2019 & 2032
- Table 56: Australia Checkpoint Inhibitors Industry Revenue (Million) Forecast, by Application 2019 & 2032
- Table 57: South Korea Checkpoint Inhibitors Industry Revenue (Million) Forecast, by Application 2019 & 2032
- Table 58: Rest of Asia Pacific Checkpoint Inhibitors Industry Revenue (Million) Forecast, by Application 2019 & 2032
- Table 59: Global Checkpoint Inhibitors Industry Revenue Million Forecast, by Type of Inhibitors 2019 & 2032
- Table 60: Global Checkpoint Inhibitors Industry Revenue Million Forecast, by Application 2019 & 2032
- Table 61: Global Checkpoint Inhibitors Industry Revenue Million Forecast, by Distribution Channel 2019 & 2032
- Table 62: Global Checkpoint Inhibitors Industry Revenue Million Forecast, by Country 2019 & 2032
- Table 63: GCC Checkpoint Inhibitors Industry Revenue (Million) Forecast, by Application 2019 & 2032
- Table 64: South Africa Checkpoint Inhibitors Industry Revenue (Million) Forecast, by Application 2019 & 2032
- Table 65: Rest of Middle East and Africa Checkpoint Inhibitors Industry Revenue (Million) Forecast, by Application 2019 & 2032
- Table 66: Global Checkpoint Inhibitors Industry Revenue Million Forecast, by Type of Inhibitors 2019 & 2032
- Table 67: Global Checkpoint Inhibitors Industry Revenue Million Forecast, by Application 2019 & 2032
- Table 68: Global Checkpoint Inhibitors Industry Revenue Million Forecast, by Distribution Channel 2019 & 2032
- Table 69: Global Checkpoint Inhibitors Industry Revenue Million Forecast, by Country 2019 & 2032
- Table 70: Brazil Checkpoint Inhibitors Industry Revenue (Million) Forecast, by Application 2019 & 2032
- Table 71: Argentina Checkpoint Inhibitors Industry Revenue (Million) Forecast, by Application 2019 & 2032
- Table 72: Rest of South America Checkpoint Inhibitors Industry Revenue (Million) Forecast, by Application 2019 & 2032
Frequently Asked Questions
1. What is the projected Compound Annual Growth Rate (CAGR) of the Checkpoint Inhibitors Industry?
The projected CAGR is approximately 18.00%.
2. Which companies are prominent players in the Checkpoint Inhibitors Industry?
Key companies in the market include Regeneron Pharmaceuticals Inc, Sanofi, AstraZeneca PLC, Immutep Ltd*List Not Exhaustive, Eli Lilly and Company, F Hoffmann-La Roche AG, BeiGene Ltd, Shanghai Jhunsi Biosciences Ltd, Merck & Co, Bristol-Myers Squibb Company, GlaxoSmithKline PLC.
3. What are the main segments of the Checkpoint Inhibitors Industry?
The market segments include Type of Inhibitors, Application, Distribution Channel.
4. Can you provide details about the market size?
The market size is estimated to be USD XX Million as of 2022.
5. What are some drivers contributing to market growth?
Rising Investments in R&D and Clinical Trials by the Biopharmaceutical Industry to Develop these Products; Increased Product Approvals by Regulatory Authorities and Special Designations for New Drug Molecules.
6. What are the notable trends driving market growth?
The PD-1 Inhibitors Segment is Expected to Hold the Largest Market Share in the Immune Checkpoint Inhibitors Market.
7. Are there any restraints impacting market growth?
Higher Risk of Complications Associated with the Expensive Oncology Treatment.
8. Can you provide examples of recent developments in the market?
April 2022: Bristol Myers Squibb received the European Commission approval for opdivo (nivolumab) with chemotherapy as first-line treatment for patients with unresectable advanced, recurrent or metastatic esophageal squamous cell carcinoma with tumor cell PD-L1 expression of 1%.
9. What pricing options are available for accessing the report?
Pricing options include single-user, multi-user, and enterprise licenses priced at USD 4750, USD 5250, and USD 8750 respectively.
10. Is the market size provided in terms of value or volume?
The market size is provided in terms of value, measured in Million.
11. Are there any specific market keywords associated with the report?
Yes, the market keyword associated with the report is "Checkpoint Inhibitors Industry," which aids in identifying and referencing the specific market segment covered.
12. How do I determine which pricing option suits my needs best?
The pricing options vary based on user requirements and access needs. Individual users may opt for single-user licenses, while businesses requiring broader access may choose multi-user or enterprise licenses for cost-effective access to the report.
13. Are there any additional resources or data provided in the Checkpoint Inhibitors Industry report?
While the report offers comprehensive insights, it's advisable to review the specific contents or supplementary materials provided to ascertain if additional resources or data are available.
14. How can I stay updated on further developments or reports in the Checkpoint Inhibitors Industry?
To stay informed about further developments, trends, and reports in the Checkpoint Inhibitors Industry, consider subscribing to industry newsletters, following relevant companies and organizations, or regularly checking reputable industry news sources and publications.
Methodology
Step 1 - Identification of Relevant Samples Size from Population Database


Step 2 - Approaches for Defining Global Market Size (Value, Volume* & Price*)

Note*: In applicable scenarios
Step 3 - Data Sources
Primary Research
- Web Analytics
- Survey Reports
- Research Institute
- Latest Research Reports
- Opinion Leaders
Secondary Research
- Annual Reports
- White Paper
- Latest Press Release
- Industry Association
- Paid Database
- Investor Presentations

Step 4 - Data Triangulation
Involves using different sources of information in order to increase the validity of a study
These sources are likely to be stakeholders in a program - participants, other researchers, program staff, other community members, and so on.
Then we put all data in single framework & apply various statistical tools to find out the dynamic on the market.
During the analysis stage, feedback from the stakeholder groups would be compared to determine areas of agreement as well as areas of divergence
