

Key Insights
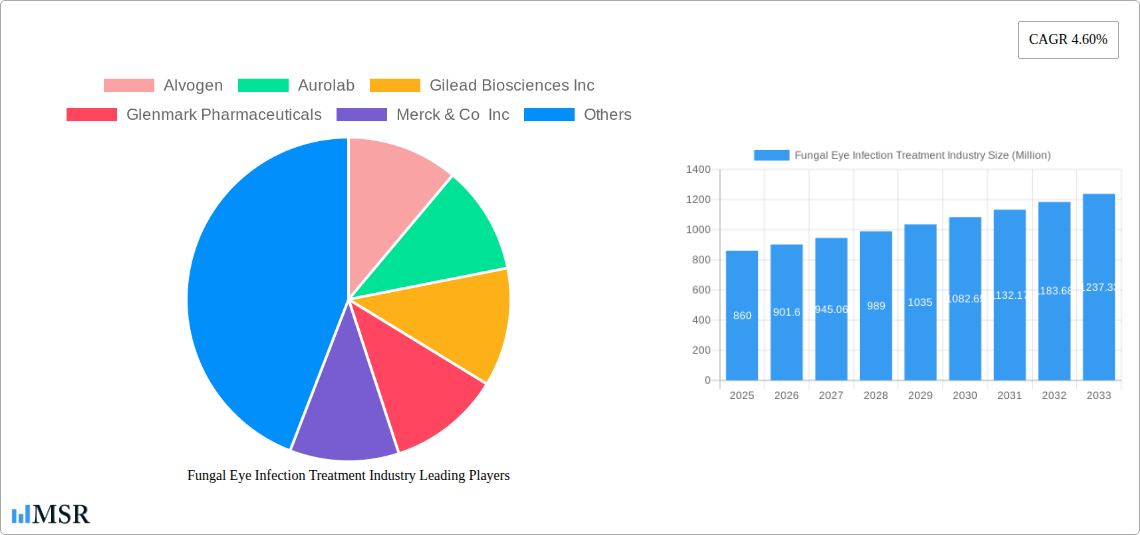
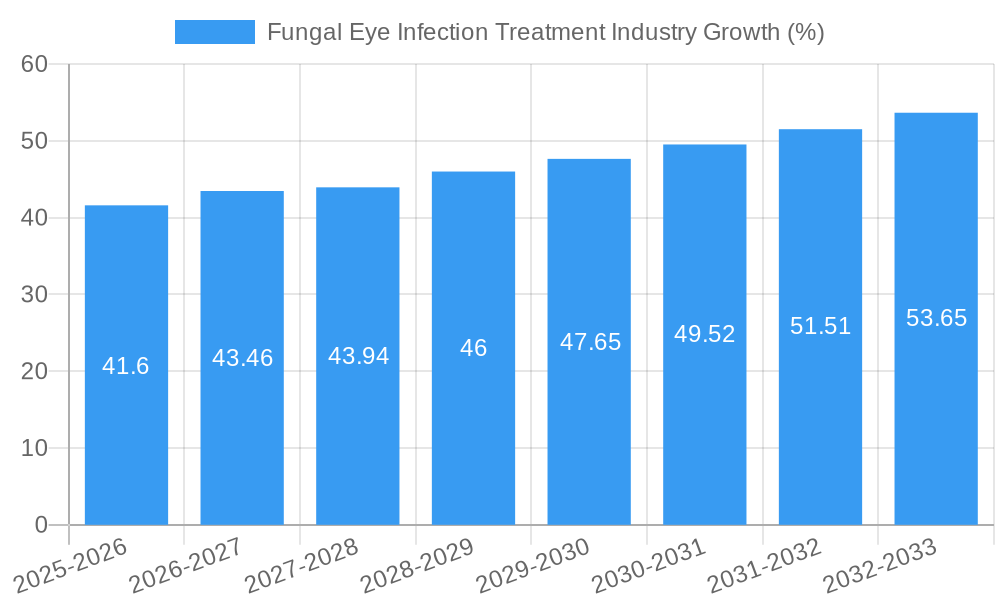
The global fungal eye infection treatment market, valued at $0.86 billion in 2025, is projected to experience steady growth, driven by rising prevalence of fungal keratitis and other ophthalmic fungal infections, particularly in regions with high humidity and inadequate sanitation. This growth is further fueled by an aging population, increasing use of contact lenses (leading to higher infection risk), and advancements in diagnostic techniques and treatment modalities, including the development of novel antifungal drugs with improved efficacy and reduced side effects. The market's segmentation reveals a significant reliance on hospitals and drug stores for distribution, with oral and topical routes of administration currently dominating. However, the injection route holds potential for growth given its efficacy in severe cases. The substantial patient base coupled with healthcare professional demand are key drivers for market expansion. Geographic analysis indicates strong market presence in North America and Europe, attributable to advanced healthcare infrastructure and higher awareness levels. However, the Asia-Pacific region presents a significant growth opportunity driven by rising prevalence of fungal infections and increasing healthcare expenditure. While a lack of awareness in certain regions and the potential for drug resistance pose challenges, the overall market trajectory indicates sustained growth over the forecast period (2025-2033).
The 4.60% CAGR projects a substantial market expansion over the coming years. Major pharmaceutical companies are actively involved in R&D, focusing on improving existing treatments and developing novel therapies to combat drug resistance. This competitive landscape drives innovation and provides patients with a broader range of effective treatment options. Furthermore, government initiatives promoting eye health and disease prevention are expected to contribute positively to the market's growth. While challenges remain, the combination of growing prevalence, improved treatments, and increasing healthcare investment points towards a promising outlook for the fungal eye infection treatment market.
Fungal Eye Infection Treatment Industry Market Report: 2019-2033
This comprehensive report provides a detailed analysis of the Fungal Eye Infection Treatment industry, offering invaluable insights for stakeholders, investors, and industry professionals. The report covers the period from 2019 to 2033, with a base year of 2025 and a forecast period from 2025 to 2033. The market is segmented by distribution channel (hospitals, drug stores, others), route of administration (oral, injection, topical), and end-user (patients, healthcare professionals). Key players analyzed include Alvogen, Aurolab, Gilead Sciences Inc, Glenmark Pharmaceuticals, Merck & Co Inc, Leadiant Biosciences, Pfizer Inc, Bausch Health, Eyevance Pharmaceuticals LLC, and Novo Holdings A/S (Xellia Pharmaceuticals). The report projects a market value of xx Million by 2033, exhibiting a CAGR of xx% during the forecast period.
Fungal Eye Infection Treatment Industry Market Concentration & Dynamics
The fungal eye infection treatment market exhibits a moderately concentrated landscape, with a few major players holding significant market share. The market share of the top five companies is estimated at xx%, indicating opportunities for both consolidation and new market entrants. Innovation plays a crucial role, with companies investing heavily in research and development to bring novel therapies to market. Regulatory frameworks, particularly those governing drug approvals and safety, significantly influence market dynamics. The presence of substitute products, including traditional treatments and alternative therapies, also poses competitive challenges. End-user trends, particularly an increasing awareness of fungal eye infections and a preference for convenient treatment options, are shaping market demand. Mergers and acquisitions (M&A) activity has been moderate in recent years, with xx M&A deals recorded between 2019 and 2024. Further consolidation is anticipated, driven by the need for expansion and enhanced product portfolios.
- Market Share of Top 5 Companies: xx% (2024)
- Number of M&A Deals (2019-2024): xx
- Key Regulatory Bodies: [List relevant regulatory bodies]
Fungal Eye Infection Treatment Industry Insights & Trends
The global fungal eye infection treatment market is experiencing substantial growth, driven by factors such as the rising prevalence of fungal infections, increasing geriatric population (more susceptible to these infections), and improvements in diagnostic techniques. The market size was valued at xx Million in 2024 and is projected to reach xx Million by 2033. This significant growth is fueled by technological advancements leading to the development of more effective and targeted therapies. Consumer behavior is also shifting towards a preference for convenient, less invasive treatments, driving demand for topical formulations. The market is also witnessing increased investment in research and development, focusing on novel drug delivery systems and personalized medicine approaches. The adoption of advanced diagnostic tools further contributes to early detection and timely treatment, thereby boosting market growth. The rising healthcare expenditure globally also supports market expansion, creating a favorable environment for innovative treatment options.
Key Markets & Segments Leading Fungal Eye Infection Treatment Industry
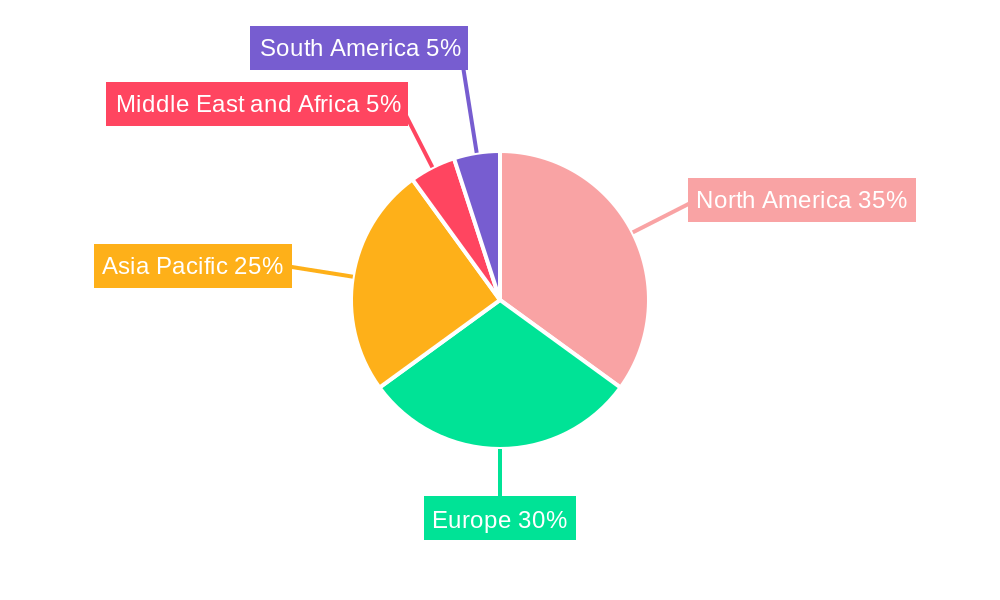
The North American region currently dominates the fungal eye infection treatment market, driven by high healthcare expenditure, advanced healthcare infrastructure, and a significant prevalence of fungal eye infections. Within this region, the United States holds the largest market share.
- Dominant Region: North America
- Dominant Country: United States
- Distribution Channel: Hospitals currently hold the largest market share due to the complex nature of many fungal eye infections requiring specialized care.
- Route of Administration: Topical administration remains dominant due to its ease of application and reduced systemic side effects.
- End-User: Healthcare professionals are the primary decision-makers in treatment selection.
Drivers for Market Dominance:
- High healthcare expenditure in North America.
- Advanced healthcare infrastructure and access to specialized care.
- High prevalence of fungal eye infections due to various factors including increased use of contact lenses and immunocompromised populations.
- Strong presence of major pharmaceutical companies in the region.
Fungal Eye Infection Treatment Industry Product Developments
Recent years have witnessed significant advancements in antifungal therapies for eye infections. New formulations with improved efficacy and reduced side effects are entering the market, alongside novel drug delivery systems designed to enhance patient compliance and treatment outcomes. These innovations target specific fungal pathogens and utilize advanced technologies to improve drug penetration into the eye tissues. This ongoing development is driving competition and fostering innovation within the industry, ultimately leading to better treatment outcomes for patients.
Challenges in the Fungal Eye Infection Treatment Industry Market
The fungal eye infection treatment market faces several challenges including stringent regulatory requirements for drug approval, leading to extended timelines and high development costs. Supply chain disruptions, particularly regarding raw materials, can also impact production and availability. Furthermore, intense competition among established players and emerging market entrants creates pricing pressures, limiting profitability. The emergence of drug resistance further complicates treatment strategies, demanding continuous innovation and development of new antifungal agents. These factors collectively present significant obstacles to market growth.
Forces Driving Fungal Eye Infection Treatment Industry Growth
Several factors are driving the growth of the fungal eye infection treatment market. Technological advancements lead to the development of more effective and targeted therapies. The increasing prevalence of fungal eye infections, particularly in aging populations, is boosting demand. Rising healthcare expenditure and improved diagnostic capabilities facilitate early detection and treatment. Furthermore, favorable regulatory environments supporting drug approvals and market access further contribute to market expansion. These combined factors are expected to fuel substantial growth in the coming years.
Long-Term Growth Catalysts in the Fungal Eye Infection Treatment Industry
Long-term growth in this industry will be fueled by continued innovation in antifungal drug development, including targeted therapies and novel delivery systems. Strategic partnerships and collaborations between pharmaceutical companies and research institutions will accelerate the development and commercialization of new treatments. Expansion into emerging markets with unmet medical needs will also contribute to sustained growth. The development of personalized medicine approaches to address individual patient characteristics will further enhance treatment outcomes and drive market expansion.
Emerging Opportunities in Fungal Eye Infection Treatment Industry
Emerging opportunities exist in the development of personalized therapies targeting specific fungal strains. The application of artificial intelligence (AI) and machine learning in diagnostics and treatment optimization offers significant potential. Expansion into underserved markets in developing countries with high prevalence of fungal eye infections presents substantial growth potential. Finally, advancements in drug delivery systems and combination therapies will contribute to improved patient outcomes and market expansion.
Leading Players in the Fungal Eye Infection Treatment Industry Sector
- Alvogen
- Aurolab
- Gilead Sciences Inc
- Glenmark Pharmaceuticals
- Merck & Co Inc
- Leadiant Biosciences
- Pfizer Inc
- Bausch Health
- Eyevance Pharmaceuticals LLC
- Novo Holdings A/S (Xellia Pharmaceuticals)
Key Milestones in Fungal Eye Infection Treatment Industry Industry
- 2020: Launch of a new topical antifungal formulation by [Company Name].
- 2022: Acquisition of [Company A] by [Company B], expanding market reach.
- 2023: Approval of a novel antifungal drug by the FDA.
- 2024: [Insert a key milestone with date and brief description]
Strategic Outlook for Fungal Eye Infection Treatment Industry Market
The fungal eye infection treatment market holds significant future potential, driven by continuous innovation, growing prevalence of fungal infections, and increased healthcare expenditure. Strategic opportunities include focusing on the development of novel therapies, expanding into emerging markets, and building strong partnerships to accelerate research and development. Companies focusing on personalized medicine approaches, improved diagnostics, and convenient drug delivery systems are poised for significant growth in this evolving market.
Fungal Eye Infection Treatment Industry Segmentation
-
1. Route of Administration
- 1.1. Oral
- 1.2. Injection
- 1.3. Topical
-
2. Distribution Channel
- 2.1. Hospitals
- 2.2. Drug Stores
- 2.3. Others
Fungal Eye Infection Treatment Industry Segmentation By Geography
-
1. North America
- 1.1. United States
- 1.2. Canada
- 1.3. Mexico
-
2. Europe
- 2.1. Germany
- 2.2. United Kingdom
- 2.3. France
- 2.4. Italy
- 2.5. Spain
- 2.6. Rest of Europe
-
3. Asia Pacific
- 3.1. China
- 3.2. Japan
- 3.3. India
- 3.4. Australia
- 3.5. South Korea
- 3.6. Rest of Asia Pacific
-
4. Middle East and Africa
- 4.1. GCC
- 4.2. South Africa
- 4.3. Rest of Middle East and Africa
-
5. South America
- 5.1. Brazil
- 5.2. Argentina
- 5.3. Rest of South America
Fungal Eye Infection Treatment Industry REPORT HIGHLIGHTS
| Aspects | Details |
|---|---|
| Study Period | 2019-2033 |
| Base Year | 2024 |
| Estimated Year | 2025 |
| Forecast Period | 2025-2033 |
| Historical Period | 2019-2024 |
| Growth Rate | CAGR of 4.60% from 2019-2033 |
| Segmentation |
|
Table of Contents
- 1. Introduction
- 1.1. Research Scope
- 1.2. Market Segmentation
- 1.3. Research Methodology
- 1.4. Definitions and Assumptions
- 2. Executive Summary
- 2.1. Introduction
- 3. Market Dynamics
- 3.1. Introduction
- 3.2. Market Drivers
- 3.2.1. Growing Burden of Fungal Keratitis Disease; Increasing Research and Development Activities
- 3.3. Market Restrains
- 3.3.1. Loss of Patents and Side Effects Associated with Fungal Keratitis Treatment Drugs
- 3.4. Market Trends
- 3.4.1. Topical Segment is Expected to Show a Significant Growth Rate in the Fungal Keratitis Treatment Market Over the Forecast Period
- 4. Market Factor Analysis
- 4.1. Porters Five Forces
- 4.2. Supply/Value Chain
- 4.3. PESTEL analysis
- 4.4. Market Entropy
- 4.5. Patent/Trademark Analysis
- 5. Global Fungal Eye Infection Treatment Industry Analysis, Insights and Forecast, 2019-2031
- 5.1. Market Analysis, Insights and Forecast - by Route of Administration
- 5.1.1. Oral
- 5.1.2. Injection
- 5.1.3. Topical
- 5.2. Market Analysis, Insights and Forecast - by Distribution Channel
- 5.2.1. Hospitals
- 5.2.2. Drug Stores
- 5.2.3. Others
- 5.3. Market Analysis, Insights and Forecast - by Region
- 5.3.1. North America
- 5.3.2. Europe
- 5.3.3. Asia Pacific
- 5.3.4. Middle East and Africa
- 5.3.5. South America
- 5.1. Market Analysis, Insights and Forecast - by Route of Administration
- 6. North America Fungal Eye Infection Treatment Industry Analysis, Insights and Forecast, 2019-2031
- 6.1. Market Analysis, Insights and Forecast - by Route of Administration
- 6.1.1. Oral
- 6.1.2. Injection
- 6.1.3. Topical
- 6.2. Market Analysis, Insights and Forecast - by Distribution Channel
- 6.2.1. Hospitals
- 6.2.2. Drug Stores
- 6.2.3. Others
- 6.1. Market Analysis, Insights and Forecast - by Route of Administration
- 7. Europe Fungal Eye Infection Treatment Industry Analysis, Insights and Forecast, 2019-2031
- 7.1. Market Analysis, Insights and Forecast - by Route of Administration
- 7.1.1. Oral
- 7.1.2. Injection
- 7.1.3. Topical
- 7.2. Market Analysis, Insights and Forecast - by Distribution Channel
- 7.2.1. Hospitals
- 7.2.2. Drug Stores
- 7.2.3. Others
- 7.1. Market Analysis, Insights and Forecast - by Route of Administration
- 8. Asia Pacific Fungal Eye Infection Treatment Industry Analysis, Insights and Forecast, 2019-2031
- 8.1. Market Analysis, Insights and Forecast - by Route of Administration
- 8.1.1. Oral
- 8.1.2. Injection
- 8.1.3. Topical
- 8.2. Market Analysis, Insights and Forecast - by Distribution Channel
- 8.2.1. Hospitals
- 8.2.2. Drug Stores
- 8.2.3. Others
- 8.1. Market Analysis, Insights and Forecast - by Route of Administration
- 9. Middle East and Africa Fungal Eye Infection Treatment Industry Analysis, Insights and Forecast, 2019-2031
- 9.1. Market Analysis, Insights and Forecast - by Route of Administration
- 9.1.1. Oral
- 9.1.2. Injection
- 9.1.3. Topical
- 9.2. Market Analysis, Insights and Forecast - by Distribution Channel
- 9.2.1. Hospitals
- 9.2.2. Drug Stores
- 9.2.3. Others
- 9.1. Market Analysis, Insights and Forecast - by Route of Administration
- 10. South America Fungal Eye Infection Treatment Industry Analysis, Insights and Forecast, 2019-2031
- 10.1. Market Analysis, Insights and Forecast - by Route of Administration
- 10.1.1. Oral
- 10.1.2. Injection
- 10.1.3. Topical
- 10.2. Market Analysis, Insights and Forecast - by Distribution Channel
- 10.2.1. Hospitals
- 10.2.2. Drug Stores
- 10.2.3. Others
- 10.1. Market Analysis, Insights and Forecast - by Route of Administration
- 11. North America Fungal Eye Infection Treatment Industry Analysis, Insights and Forecast, 2019-2031
- 11.1. Market Analysis, Insights and Forecast - By Country/Sub-region
- 11.1.1 United States
- 11.1.2 Canada
- 11.1.3 Mexico
- 12. Europe Fungal Eye Infection Treatment Industry Analysis, Insights and Forecast, 2019-2031
- 12.1. Market Analysis, Insights and Forecast - By Country/Sub-region
- 12.1.1 Germany
- 12.1.2 United Kingdom
- 12.1.3 France
- 12.1.4 Italy
- 12.1.5 Spain
- 12.1.6 Rest of Europe
- 13. Asia Pacific Fungal Eye Infection Treatment Industry Analysis, Insights and Forecast, 2019-2031
- 13.1. Market Analysis, Insights and Forecast - By Country/Sub-region
- 13.1.1 China
- 13.1.2 Japan
- 13.1.3 India
- 13.1.4 Australia
- 13.1.5 South Korea
- 13.1.6 Rest of Asia Pacific
- 14. Middle East and Africa Fungal Eye Infection Treatment Industry Analysis, Insights and Forecast, 2019-2031
- 14.1. Market Analysis, Insights and Forecast - By Country/Sub-region
- 14.1.1 GCC
- 14.1.2 South Africa
- 14.1.3 Rest of Middle East and Africa
- 15. South America Fungal Eye Infection Treatment Industry Analysis, Insights and Forecast, 2019-2031
- 15.1. Market Analysis, Insights and Forecast - By Country/Sub-region
- 15.1.1 Brazil
- 15.1.2 Argentina
- 15.1.3 Rest of South America
- 16. Competitive Analysis
- 16.1. Global Market Share Analysis 2024
- 16.2. Company Profiles
- 16.2.1 Alvogen
- 16.2.1.1. Overview
- 16.2.1.2. Products
- 16.2.1.3. SWOT Analysis
- 16.2.1.4. Recent Developments
- 16.2.1.5. Financials (Based on Availability)
- 16.2.2 Aurolab
- 16.2.2.1. Overview
- 16.2.2.2. Products
- 16.2.2.3. SWOT Analysis
- 16.2.2.4. Recent Developments
- 16.2.2.5. Financials (Based on Availability)
- 16.2.3 Gilead Biosciences Inc
- 16.2.3.1. Overview
- 16.2.3.2. Products
- 16.2.3.3. SWOT Analysis
- 16.2.3.4. Recent Developments
- 16.2.3.5. Financials (Based on Availability)
- 16.2.4 Glenmark Pharmaceuticals
- 16.2.4.1. Overview
- 16.2.4.2. Products
- 16.2.4.3. SWOT Analysis
- 16.2.4.4. Recent Developments
- 16.2.4.5. Financials (Based on Availability)
- 16.2.5 Merck & Co Inc
- 16.2.5.1. Overview
- 16.2.5.2. Products
- 16.2.5.3. SWOT Analysis
- 16.2.5.4. Recent Developments
- 16.2.5.5. Financials (Based on Availability)
- 16.2.6 Leadiant Biosciences
- 16.2.6.1. Overview
- 16.2.6.2. Products
- 16.2.6.3. SWOT Analysis
- 16.2.6.4. Recent Developments
- 16.2.6.5. Financials (Based on Availability)
- 16.2.7 Pfizer Inc
- 16.2.7.1. Overview
- 16.2.7.2. Products
- 16.2.7.3. SWOT Analysis
- 16.2.7.4. Recent Developments
- 16.2.7.5. Financials (Based on Availability)
- 16.2.8 Bausch Health
- 16.2.8.1. Overview
- 16.2.8.2. Products
- 16.2.8.3. SWOT Analysis
- 16.2.8.4. Recent Developments
- 16.2.8.5. Financials (Based on Availability)
- 16.2.9 Eyevance Pharmaceuticals LLC
- 16.2.9.1. Overview
- 16.2.9.2. Products
- 16.2.9.3. SWOT Analysis
- 16.2.9.4. Recent Developments
- 16.2.9.5. Financials (Based on Availability)
- 16.2.10 Novo Holdings A/S (Xellia Pharmaceuticals)
- 16.2.10.1. Overview
- 16.2.10.2. Products
- 16.2.10.3. SWOT Analysis
- 16.2.10.4. Recent Developments
- 16.2.10.5. Financials (Based on Availability)
- 16.2.1 Alvogen
List of Figures
- Figure 1: Global Fungal Eye Infection Treatment Industry Revenue Breakdown (Million, %) by Region 2024 & 2032
- Figure 2: Global Fungal Eye Infection Treatment Industry Volume Breakdown (K Units, %) by Region 2024 & 2032
- Figure 3: North America Fungal Eye Infection Treatment Industry Revenue (Million), by Country 2024 & 2032
- Figure 4: North America Fungal Eye Infection Treatment Industry Volume (K Units), by Country 2024 & 2032
- Figure 5: North America Fungal Eye Infection Treatment Industry Revenue Share (%), by Country 2024 & 2032
- Figure 6: North America Fungal Eye Infection Treatment Industry Volume Share (%), by Country 2024 & 2032
- Figure 7: Europe Fungal Eye Infection Treatment Industry Revenue (Million), by Country 2024 & 2032
- Figure 8: Europe Fungal Eye Infection Treatment Industry Volume (K Units), by Country 2024 & 2032
- Figure 9: Europe Fungal Eye Infection Treatment Industry Revenue Share (%), by Country 2024 & 2032
- Figure 10: Europe Fungal Eye Infection Treatment Industry Volume Share (%), by Country 2024 & 2032
- Figure 11: Asia Pacific Fungal Eye Infection Treatment Industry Revenue (Million), by Country 2024 & 2032
- Figure 12: Asia Pacific Fungal Eye Infection Treatment Industry Volume (K Units), by Country 2024 & 2032
- Figure 13: Asia Pacific Fungal Eye Infection Treatment Industry Revenue Share (%), by Country 2024 & 2032
- Figure 14: Asia Pacific Fungal Eye Infection Treatment Industry Volume Share (%), by Country 2024 & 2032
- Figure 15: Middle East and Africa Fungal Eye Infection Treatment Industry Revenue (Million), by Country 2024 & 2032
- Figure 16: Middle East and Africa Fungal Eye Infection Treatment Industry Volume (K Units), by Country 2024 & 2032
- Figure 17: Middle East and Africa Fungal Eye Infection Treatment Industry Revenue Share (%), by Country 2024 & 2032
- Figure 18: Middle East and Africa Fungal Eye Infection Treatment Industry Volume Share (%), by Country 2024 & 2032
- Figure 19: South America Fungal Eye Infection Treatment Industry Revenue (Million), by Country 2024 & 2032
- Figure 20: South America Fungal Eye Infection Treatment Industry Volume (K Units), by Country 2024 & 2032
- Figure 21: South America Fungal Eye Infection Treatment Industry Revenue Share (%), by Country 2024 & 2032
- Figure 22: South America Fungal Eye Infection Treatment Industry Volume Share (%), by Country 2024 & 2032
- Figure 23: North America Fungal Eye Infection Treatment Industry Revenue (Million), by Route of Administration 2024 & 2032
- Figure 24: North America Fungal Eye Infection Treatment Industry Volume (K Units), by Route of Administration 2024 & 2032
- Figure 25: North America Fungal Eye Infection Treatment Industry Revenue Share (%), by Route of Administration 2024 & 2032
- Figure 26: North America Fungal Eye Infection Treatment Industry Volume Share (%), by Route of Administration 2024 & 2032
- Figure 27: North America Fungal Eye Infection Treatment Industry Revenue (Million), by Distribution Channel 2024 & 2032
- Figure 28: North America Fungal Eye Infection Treatment Industry Volume (K Units), by Distribution Channel 2024 & 2032
- Figure 29: North America Fungal Eye Infection Treatment Industry Revenue Share (%), by Distribution Channel 2024 & 2032
- Figure 30: North America Fungal Eye Infection Treatment Industry Volume Share (%), by Distribution Channel 2024 & 2032
- Figure 31: North America Fungal Eye Infection Treatment Industry Revenue (Million), by Country 2024 & 2032
- Figure 32: North America Fungal Eye Infection Treatment Industry Volume (K Units), by Country 2024 & 2032
- Figure 33: North America Fungal Eye Infection Treatment Industry Revenue Share (%), by Country 2024 & 2032
- Figure 34: North America Fungal Eye Infection Treatment Industry Volume Share (%), by Country 2024 & 2032
- Figure 35: Europe Fungal Eye Infection Treatment Industry Revenue (Million), by Route of Administration 2024 & 2032
- Figure 36: Europe Fungal Eye Infection Treatment Industry Volume (K Units), by Route of Administration 2024 & 2032
- Figure 37: Europe Fungal Eye Infection Treatment Industry Revenue Share (%), by Route of Administration 2024 & 2032
- Figure 38: Europe Fungal Eye Infection Treatment Industry Volume Share (%), by Route of Administration 2024 & 2032
- Figure 39: Europe Fungal Eye Infection Treatment Industry Revenue (Million), by Distribution Channel 2024 & 2032
- Figure 40: Europe Fungal Eye Infection Treatment Industry Volume (K Units), by Distribution Channel 2024 & 2032
- Figure 41: Europe Fungal Eye Infection Treatment Industry Revenue Share (%), by Distribution Channel 2024 & 2032
- Figure 42: Europe Fungal Eye Infection Treatment Industry Volume Share (%), by Distribution Channel 2024 & 2032
- Figure 43: Europe Fungal Eye Infection Treatment Industry Revenue (Million), by Country 2024 & 2032
- Figure 44: Europe Fungal Eye Infection Treatment Industry Volume (K Units), by Country 2024 & 2032
- Figure 45: Europe Fungal Eye Infection Treatment Industry Revenue Share (%), by Country 2024 & 2032
- Figure 46: Europe Fungal Eye Infection Treatment Industry Volume Share (%), by Country 2024 & 2032
- Figure 47: Asia Pacific Fungal Eye Infection Treatment Industry Revenue (Million), by Route of Administration 2024 & 2032
- Figure 48: Asia Pacific Fungal Eye Infection Treatment Industry Volume (K Units), by Route of Administration 2024 & 2032
- Figure 49: Asia Pacific Fungal Eye Infection Treatment Industry Revenue Share (%), by Route of Administration 2024 & 2032
- Figure 50: Asia Pacific Fungal Eye Infection Treatment Industry Volume Share (%), by Route of Administration 2024 & 2032
- Figure 51: Asia Pacific Fungal Eye Infection Treatment Industry Revenue (Million), by Distribution Channel 2024 & 2032
- Figure 52: Asia Pacific Fungal Eye Infection Treatment Industry Volume (K Units), by Distribution Channel 2024 & 2032
- Figure 53: Asia Pacific Fungal Eye Infection Treatment Industry Revenue Share (%), by Distribution Channel 2024 & 2032
- Figure 54: Asia Pacific Fungal Eye Infection Treatment Industry Volume Share (%), by Distribution Channel 2024 & 2032
- Figure 55: Asia Pacific Fungal Eye Infection Treatment Industry Revenue (Million), by Country 2024 & 2032
- Figure 56: Asia Pacific Fungal Eye Infection Treatment Industry Volume (K Units), by Country 2024 & 2032
- Figure 57: Asia Pacific Fungal Eye Infection Treatment Industry Revenue Share (%), by Country 2024 & 2032
- Figure 58: Asia Pacific Fungal Eye Infection Treatment Industry Volume Share (%), by Country 2024 & 2032
- Figure 59: Middle East and Africa Fungal Eye Infection Treatment Industry Revenue (Million), by Route of Administration 2024 & 2032
- Figure 60: Middle East and Africa Fungal Eye Infection Treatment Industry Volume (K Units), by Route of Administration 2024 & 2032
- Figure 61: Middle East and Africa Fungal Eye Infection Treatment Industry Revenue Share (%), by Route of Administration 2024 & 2032
- Figure 62: Middle East and Africa Fungal Eye Infection Treatment Industry Volume Share (%), by Route of Administration 2024 & 2032
- Figure 63: Middle East and Africa Fungal Eye Infection Treatment Industry Revenue (Million), by Distribution Channel 2024 & 2032
- Figure 64: Middle East and Africa Fungal Eye Infection Treatment Industry Volume (K Units), by Distribution Channel 2024 & 2032
- Figure 65: Middle East and Africa Fungal Eye Infection Treatment Industry Revenue Share (%), by Distribution Channel 2024 & 2032
- Figure 66: Middle East and Africa Fungal Eye Infection Treatment Industry Volume Share (%), by Distribution Channel 2024 & 2032
- Figure 67: Middle East and Africa Fungal Eye Infection Treatment Industry Revenue (Million), by Country 2024 & 2032
- Figure 68: Middle East and Africa Fungal Eye Infection Treatment Industry Volume (K Units), by Country 2024 & 2032
- Figure 69: Middle East and Africa Fungal Eye Infection Treatment Industry Revenue Share (%), by Country 2024 & 2032
- Figure 70: Middle East and Africa Fungal Eye Infection Treatment Industry Volume Share (%), by Country 2024 & 2032
- Figure 71: South America Fungal Eye Infection Treatment Industry Revenue (Million), by Route of Administration 2024 & 2032
- Figure 72: South America Fungal Eye Infection Treatment Industry Volume (K Units), by Route of Administration 2024 & 2032
- Figure 73: South America Fungal Eye Infection Treatment Industry Revenue Share (%), by Route of Administration 2024 & 2032
- Figure 74: South America Fungal Eye Infection Treatment Industry Volume Share (%), by Route of Administration 2024 & 2032
- Figure 75: South America Fungal Eye Infection Treatment Industry Revenue (Million), by Distribution Channel 2024 & 2032
- Figure 76: South America Fungal Eye Infection Treatment Industry Volume (K Units), by Distribution Channel 2024 & 2032
- Figure 77: South America Fungal Eye Infection Treatment Industry Revenue Share (%), by Distribution Channel 2024 & 2032
- Figure 78: South America Fungal Eye Infection Treatment Industry Volume Share (%), by Distribution Channel 2024 & 2032
- Figure 79: South America Fungal Eye Infection Treatment Industry Revenue (Million), by Country 2024 & 2032
- Figure 80: South America Fungal Eye Infection Treatment Industry Volume (K Units), by Country 2024 & 2032
- Figure 81: South America Fungal Eye Infection Treatment Industry Revenue Share (%), by Country 2024 & 2032
- Figure 82: South America Fungal Eye Infection Treatment Industry Volume Share (%), by Country 2024 & 2032
List of Tables
- Table 1: Global Fungal Eye Infection Treatment Industry Revenue Million Forecast, by Region 2019 & 2032
- Table 2: Global Fungal Eye Infection Treatment Industry Volume K Units Forecast, by Region 2019 & 2032
- Table 3: Global Fungal Eye Infection Treatment Industry Revenue Million Forecast, by Route of Administration 2019 & 2032
- Table 4: Global Fungal Eye Infection Treatment Industry Volume K Units Forecast, by Route of Administration 2019 & 2032
- Table 5: Global Fungal Eye Infection Treatment Industry Revenue Million Forecast, by Distribution Channel 2019 & 2032
- Table 6: Global Fungal Eye Infection Treatment Industry Volume K Units Forecast, by Distribution Channel 2019 & 2032
- Table 7: Global Fungal Eye Infection Treatment Industry Revenue Million Forecast, by Region 2019 & 2032
- Table 8: Global Fungal Eye Infection Treatment Industry Volume K Units Forecast, by Region 2019 & 2032
- Table 9: Global Fungal Eye Infection Treatment Industry Revenue Million Forecast, by Country 2019 & 2032
- Table 10: Global Fungal Eye Infection Treatment Industry Volume K Units Forecast, by Country 2019 & 2032
- Table 11: United States Fungal Eye Infection Treatment Industry Revenue (Million) Forecast, by Application 2019 & 2032
- Table 12: United States Fungal Eye Infection Treatment Industry Volume (K Units) Forecast, by Application 2019 & 2032
- Table 13: Canada Fungal Eye Infection Treatment Industry Revenue (Million) Forecast, by Application 2019 & 2032
- Table 14: Canada Fungal Eye Infection Treatment Industry Volume (K Units) Forecast, by Application 2019 & 2032
- Table 15: Mexico Fungal Eye Infection Treatment Industry Revenue (Million) Forecast, by Application 2019 & 2032
- Table 16: Mexico Fungal Eye Infection Treatment Industry Volume (K Units) Forecast, by Application 2019 & 2032
- Table 17: Global Fungal Eye Infection Treatment Industry Revenue Million Forecast, by Country 2019 & 2032
- Table 18: Global Fungal Eye Infection Treatment Industry Volume K Units Forecast, by Country 2019 & 2032
- Table 19: Germany Fungal Eye Infection Treatment Industry Revenue (Million) Forecast, by Application 2019 & 2032
- Table 20: Germany Fungal Eye Infection Treatment Industry Volume (K Units) Forecast, by Application 2019 & 2032
- Table 21: United Kingdom Fungal Eye Infection Treatment Industry Revenue (Million) Forecast, by Application 2019 & 2032
- Table 22: United Kingdom Fungal Eye Infection Treatment Industry Volume (K Units) Forecast, by Application 2019 & 2032
- Table 23: France Fungal Eye Infection Treatment Industry Revenue (Million) Forecast, by Application 2019 & 2032
- Table 24: France Fungal Eye Infection Treatment Industry Volume (K Units) Forecast, by Application 2019 & 2032
- Table 25: Italy Fungal Eye Infection Treatment Industry Revenue (Million) Forecast, by Application 2019 & 2032
- Table 26: Italy Fungal Eye Infection Treatment Industry Volume (K Units) Forecast, by Application 2019 & 2032
- Table 27: Spain Fungal Eye Infection Treatment Industry Revenue (Million) Forecast, by Application 2019 & 2032
- Table 28: Spain Fungal Eye Infection Treatment Industry Volume (K Units) Forecast, by Application 2019 & 2032
- Table 29: Rest of Europe Fungal Eye Infection Treatment Industry Revenue (Million) Forecast, by Application 2019 & 2032
- Table 30: Rest of Europe Fungal Eye Infection Treatment Industry Volume (K Units) Forecast, by Application 2019 & 2032
- Table 31: Global Fungal Eye Infection Treatment Industry Revenue Million Forecast, by Country 2019 & 2032
- Table 32: Global Fungal Eye Infection Treatment Industry Volume K Units Forecast, by Country 2019 & 2032
- Table 33: China Fungal Eye Infection Treatment Industry Revenue (Million) Forecast, by Application 2019 & 2032
- Table 34: China Fungal Eye Infection Treatment Industry Volume (K Units) Forecast, by Application 2019 & 2032
- Table 35: Japan Fungal Eye Infection Treatment Industry Revenue (Million) Forecast, by Application 2019 & 2032
- Table 36: Japan Fungal Eye Infection Treatment Industry Volume (K Units) Forecast, by Application 2019 & 2032
- Table 37: India Fungal Eye Infection Treatment Industry Revenue (Million) Forecast, by Application 2019 & 2032
- Table 38: India Fungal Eye Infection Treatment Industry Volume (K Units) Forecast, by Application 2019 & 2032
- Table 39: Australia Fungal Eye Infection Treatment Industry Revenue (Million) Forecast, by Application 2019 & 2032
- Table 40: Australia Fungal Eye Infection Treatment Industry Volume (K Units) Forecast, by Application 2019 & 2032
- Table 41: South Korea Fungal Eye Infection Treatment Industry Revenue (Million) Forecast, by Application 2019 & 2032
- Table 42: South Korea Fungal Eye Infection Treatment Industry Volume (K Units) Forecast, by Application 2019 & 2032
- Table 43: Rest of Asia Pacific Fungal Eye Infection Treatment Industry Revenue (Million) Forecast, by Application 2019 & 2032
- Table 44: Rest of Asia Pacific Fungal Eye Infection Treatment Industry Volume (K Units) Forecast, by Application 2019 & 2032
- Table 45: Global Fungal Eye Infection Treatment Industry Revenue Million Forecast, by Country 2019 & 2032
- Table 46: Global Fungal Eye Infection Treatment Industry Volume K Units Forecast, by Country 2019 & 2032
- Table 47: GCC Fungal Eye Infection Treatment Industry Revenue (Million) Forecast, by Application 2019 & 2032
- Table 48: GCC Fungal Eye Infection Treatment Industry Volume (K Units) Forecast, by Application 2019 & 2032
- Table 49: South Africa Fungal Eye Infection Treatment Industry Revenue (Million) Forecast, by Application 2019 & 2032
- Table 50: South Africa Fungal Eye Infection Treatment Industry Volume (K Units) Forecast, by Application 2019 & 2032
- Table 51: Rest of Middle East and Africa Fungal Eye Infection Treatment Industry Revenue (Million) Forecast, by Application 2019 & 2032
- Table 52: Rest of Middle East and Africa Fungal Eye Infection Treatment Industry Volume (K Units) Forecast, by Application 2019 & 2032
- Table 53: Global Fungal Eye Infection Treatment Industry Revenue Million Forecast, by Country 2019 & 2032
- Table 54: Global Fungal Eye Infection Treatment Industry Volume K Units Forecast, by Country 2019 & 2032
- Table 55: Brazil Fungal Eye Infection Treatment Industry Revenue (Million) Forecast, by Application 2019 & 2032
- Table 56: Brazil Fungal Eye Infection Treatment Industry Volume (K Units) Forecast, by Application 2019 & 2032
- Table 57: Argentina Fungal Eye Infection Treatment Industry Revenue (Million) Forecast, by Application 2019 & 2032
- Table 58: Argentina Fungal Eye Infection Treatment Industry Volume (K Units) Forecast, by Application 2019 & 2032
- Table 59: Rest of South America Fungal Eye Infection Treatment Industry Revenue (Million) Forecast, by Application 2019 & 2032
- Table 60: Rest of South America Fungal Eye Infection Treatment Industry Volume (K Units) Forecast, by Application 2019 & 2032
- Table 61: Global Fungal Eye Infection Treatment Industry Revenue Million Forecast, by Route of Administration 2019 & 2032
- Table 62: Global Fungal Eye Infection Treatment Industry Volume K Units Forecast, by Route of Administration 2019 & 2032
- Table 63: Global Fungal Eye Infection Treatment Industry Revenue Million Forecast, by Distribution Channel 2019 & 2032
- Table 64: Global Fungal Eye Infection Treatment Industry Volume K Units Forecast, by Distribution Channel 2019 & 2032
- Table 65: Global Fungal Eye Infection Treatment Industry Revenue Million Forecast, by Country 2019 & 2032
- Table 66: Global Fungal Eye Infection Treatment Industry Volume K Units Forecast, by Country 2019 & 2032
- Table 67: United States Fungal Eye Infection Treatment Industry Revenue (Million) Forecast, by Application 2019 & 2032
- Table 68: United States Fungal Eye Infection Treatment Industry Volume (K Units) Forecast, by Application 2019 & 2032
- Table 69: Canada Fungal Eye Infection Treatment Industry Revenue (Million) Forecast, by Application 2019 & 2032
- Table 70: Canada Fungal Eye Infection Treatment Industry Volume (K Units) Forecast, by Application 2019 & 2032
- Table 71: Mexico Fungal Eye Infection Treatment Industry Revenue (Million) Forecast, by Application 2019 & 2032
- Table 72: Mexico Fungal Eye Infection Treatment Industry Volume (K Units) Forecast, by Application 2019 & 2032
- Table 73: Global Fungal Eye Infection Treatment Industry Revenue Million Forecast, by Route of Administration 2019 & 2032
- Table 74: Global Fungal Eye Infection Treatment Industry Volume K Units Forecast, by Route of Administration 2019 & 2032
- Table 75: Global Fungal Eye Infection Treatment Industry Revenue Million Forecast, by Distribution Channel 2019 & 2032
- Table 76: Global Fungal Eye Infection Treatment Industry Volume K Units Forecast, by Distribution Channel 2019 & 2032
- Table 77: Global Fungal Eye Infection Treatment Industry Revenue Million Forecast, by Country 2019 & 2032
- Table 78: Global Fungal Eye Infection Treatment Industry Volume K Units Forecast, by Country 2019 & 2032
- Table 79: Germany Fungal Eye Infection Treatment Industry Revenue (Million) Forecast, by Application 2019 & 2032
- Table 80: Germany Fungal Eye Infection Treatment Industry Volume (K Units) Forecast, by Application 2019 & 2032
- Table 81: United Kingdom Fungal Eye Infection Treatment Industry Revenue (Million) Forecast, by Application 2019 & 2032
- Table 82: United Kingdom Fungal Eye Infection Treatment Industry Volume (K Units) Forecast, by Application 2019 & 2032
- Table 83: France Fungal Eye Infection Treatment Industry Revenue (Million) Forecast, by Application 2019 & 2032
- Table 84: France Fungal Eye Infection Treatment Industry Volume (K Units) Forecast, by Application 2019 & 2032
- Table 85: Italy Fungal Eye Infection Treatment Industry Revenue (Million) Forecast, by Application 2019 & 2032
- Table 86: Italy Fungal Eye Infection Treatment Industry Volume (K Units) Forecast, by Application 2019 & 2032
- Table 87: Spain Fungal Eye Infection Treatment Industry Revenue (Million) Forecast, by Application 2019 & 2032
- Table 88: Spain Fungal Eye Infection Treatment Industry Volume (K Units) Forecast, by Application 2019 & 2032
- Table 89: Rest of Europe Fungal Eye Infection Treatment Industry Revenue (Million) Forecast, by Application 2019 & 2032
- Table 90: Rest of Europe Fungal Eye Infection Treatment Industry Volume (K Units) Forecast, by Application 2019 & 2032
- Table 91: Global Fungal Eye Infection Treatment Industry Revenue Million Forecast, by Route of Administration 2019 & 2032
- Table 92: Global Fungal Eye Infection Treatment Industry Volume K Units Forecast, by Route of Administration 2019 & 2032
- Table 93: Global Fungal Eye Infection Treatment Industry Revenue Million Forecast, by Distribution Channel 2019 & 2032
- Table 94: Global Fungal Eye Infection Treatment Industry Volume K Units Forecast, by Distribution Channel 2019 & 2032
- Table 95: Global Fungal Eye Infection Treatment Industry Revenue Million Forecast, by Country 2019 & 2032
- Table 96: Global Fungal Eye Infection Treatment Industry Volume K Units Forecast, by Country 2019 & 2032
- Table 97: China Fungal Eye Infection Treatment Industry Revenue (Million) Forecast, by Application 2019 & 2032
- Table 98: China Fungal Eye Infection Treatment Industry Volume (K Units) Forecast, by Application 2019 & 2032
- Table 99: Japan Fungal Eye Infection Treatment Industry Revenue (Million) Forecast, by Application 2019 & 2032
- Table 100: Japan Fungal Eye Infection Treatment Industry Volume (K Units) Forecast, by Application 2019 & 2032
- Table 101: India Fungal Eye Infection Treatment Industry Revenue (Million) Forecast, by Application 2019 & 2032
- Table 102: India Fungal Eye Infection Treatment Industry Volume (K Units) Forecast, by Application 2019 & 2032
- Table 103: Australia Fungal Eye Infection Treatment Industry Revenue (Million) Forecast, by Application 2019 & 2032
- Table 104: Australia Fungal Eye Infection Treatment Industry Volume (K Units) Forecast, by Application 2019 & 2032
- Table 105: South Korea Fungal Eye Infection Treatment Industry Revenue (Million) Forecast, by Application 2019 & 2032
- Table 106: South Korea Fungal Eye Infection Treatment Industry Volume (K Units) Forecast, by Application 2019 & 2032
- Table 107: Rest of Asia Pacific Fungal Eye Infection Treatment Industry Revenue (Million) Forecast, by Application 2019 & 2032
- Table 108: Rest of Asia Pacific Fungal Eye Infection Treatment Industry Volume (K Units) Forecast, by Application 2019 & 2032
- Table 109: Global Fungal Eye Infection Treatment Industry Revenue Million Forecast, by Route of Administration 2019 & 2032
- Table 110: Global Fungal Eye Infection Treatment Industry Volume K Units Forecast, by Route of Administration 2019 & 2032
- Table 111: Global Fungal Eye Infection Treatment Industry Revenue Million Forecast, by Distribution Channel 2019 & 2032
- Table 112: Global Fungal Eye Infection Treatment Industry Volume K Units Forecast, by Distribution Channel 2019 & 2032
- Table 113: Global Fungal Eye Infection Treatment Industry Revenue Million Forecast, by Country 2019 & 2032
- Table 114: Global Fungal Eye Infection Treatment Industry Volume K Units Forecast, by Country 2019 & 2032
- Table 115: GCC Fungal Eye Infection Treatment Industry Revenue (Million) Forecast, by Application 2019 & 2032
- Table 116: GCC Fungal Eye Infection Treatment Industry Volume (K Units) Forecast, by Application 2019 & 2032
- Table 117: South Africa Fungal Eye Infection Treatment Industry Revenue (Million) Forecast, by Application 2019 & 2032
- Table 118: South Africa Fungal Eye Infection Treatment Industry Volume (K Units) Forecast, by Application 2019 & 2032
- Table 119: Rest of Middle East and Africa Fungal Eye Infection Treatment Industry Revenue (Million) Forecast, by Application 2019 & 2032
- Table 120: Rest of Middle East and Africa Fungal Eye Infection Treatment Industry Volume (K Units) Forecast, by Application 2019 & 2032
- Table 121: Global Fungal Eye Infection Treatment Industry Revenue Million Forecast, by Route of Administration 2019 & 2032
- Table 122: Global Fungal Eye Infection Treatment Industry Volume K Units Forecast, by Route of Administration 2019 & 2032
- Table 123: Global Fungal Eye Infection Treatment Industry Revenue Million Forecast, by Distribution Channel 2019 & 2032
- Table 124: Global Fungal Eye Infection Treatment Industry Volume K Units Forecast, by Distribution Channel 2019 & 2032
- Table 125: Global Fungal Eye Infection Treatment Industry Revenue Million Forecast, by Country 2019 & 2032
- Table 126: Global Fungal Eye Infection Treatment Industry Volume K Units Forecast, by Country 2019 & 2032
- Table 127: Brazil Fungal Eye Infection Treatment Industry Revenue (Million) Forecast, by Application 2019 & 2032
- Table 128: Brazil Fungal Eye Infection Treatment Industry Volume (K Units) Forecast, by Application 2019 & 2032
- Table 129: Argentina Fungal Eye Infection Treatment Industry Revenue (Million) Forecast, by Application 2019 & 2032
- Table 130: Argentina Fungal Eye Infection Treatment Industry Volume (K Units) Forecast, by Application 2019 & 2032
- Table 131: Rest of South America Fungal Eye Infection Treatment Industry Revenue (Million) Forecast, by Application 2019 & 2032
- Table 132: Rest of South America Fungal Eye Infection Treatment Industry Volume (K Units) Forecast, by Application 2019 & 2032
Frequently Asked Questions
1. What is the projected Compound Annual Growth Rate (CAGR) of the Fungal Eye Infection Treatment Industry?
The projected CAGR is approximately 4.60%.
2. Which companies are prominent players in the Fungal Eye Infection Treatment Industry?
Key companies in the market include Alvogen, Aurolab, Gilead Biosciences Inc, Glenmark Pharmaceuticals, Merck & Co Inc, Leadiant Biosciences, Pfizer Inc , Bausch Health, Eyevance Pharmaceuticals LLC, Novo Holdings A/S (Xellia Pharmaceuticals).
3. What are the main segments of the Fungal Eye Infection Treatment Industry?
The market segments include Route of Administration, Distribution Channel.
4. Can you provide details about the market size?
The market size is estimated to be USD 0.86 Million as of 2022.
5. What are some drivers contributing to market growth?
Growing Burden of Fungal Keratitis Disease; Increasing Research and Development Activities.
6. What are the notable trends driving market growth?
Topical Segment is Expected to Show a Significant Growth Rate in the Fungal Keratitis Treatment Market Over the Forecast Period.
7. Are there any restraints impacting market growth?
Loss of Patents and Side Effects Associated with Fungal Keratitis Treatment Drugs.
8. Can you provide examples of recent developments in the market?
N/A
9. What pricing options are available for accessing the report?
Pricing options include single-user, multi-user, and enterprise licenses priced at USD 4750, USD 5250, and USD 8750 respectively.
10. Is the market size provided in terms of value or volume?
The market size is provided in terms of value, measured in Million and volume, measured in K Units.
11. Are there any specific market keywords associated with the report?
Yes, the market keyword associated with the report is "Fungal Eye Infection Treatment Industry," which aids in identifying and referencing the specific market segment covered.
12. How do I determine which pricing option suits my needs best?
The pricing options vary based on user requirements and access needs. Individual users may opt for single-user licenses, while businesses requiring broader access may choose multi-user or enterprise licenses for cost-effective access to the report.
13. Are there any additional resources or data provided in the Fungal Eye Infection Treatment Industry report?
While the report offers comprehensive insights, it's advisable to review the specific contents or supplementary materials provided to ascertain if additional resources or data are available.
14. How can I stay updated on further developments or reports in the Fungal Eye Infection Treatment Industry?
To stay informed about further developments, trends, and reports in the Fungal Eye Infection Treatment Industry, consider subscribing to industry newsletters, following relevant companies and organizations, or regularly checking reputable industry news sources and publications.
Methodology
Step 1 - Identification of Relevant Samples Size from Population Database


Step 2 - Approaches for Defining Global Market Size (Value, Volume* & Price*)

Note*: In applicable scenarios
Step 3 - Data Sources
Primary Research
- Web Analytics
- Survey Reports
- Research Institute
- Latest Research Reports
- Opinion Leaders
Secondary Research
- Annual Reports
- White Paper
- Latest Press Release
- Industry Association
- Paid Database
- Investor Presentations

Step 4 - Data Triangulation
Involves using different sources of information in order to increase the validity of a study
These sources are likely to be stakeholders in a program - participants, other researchers, program staff, other community members, and so on.
Then we put all data in single framework & apply various statistical tools to find out the dynamic on the market.
During the analysis stage, feedback from the stakeholder groups would be compared to determine areas of agreement as well as areas of divergence
