

Key Insights
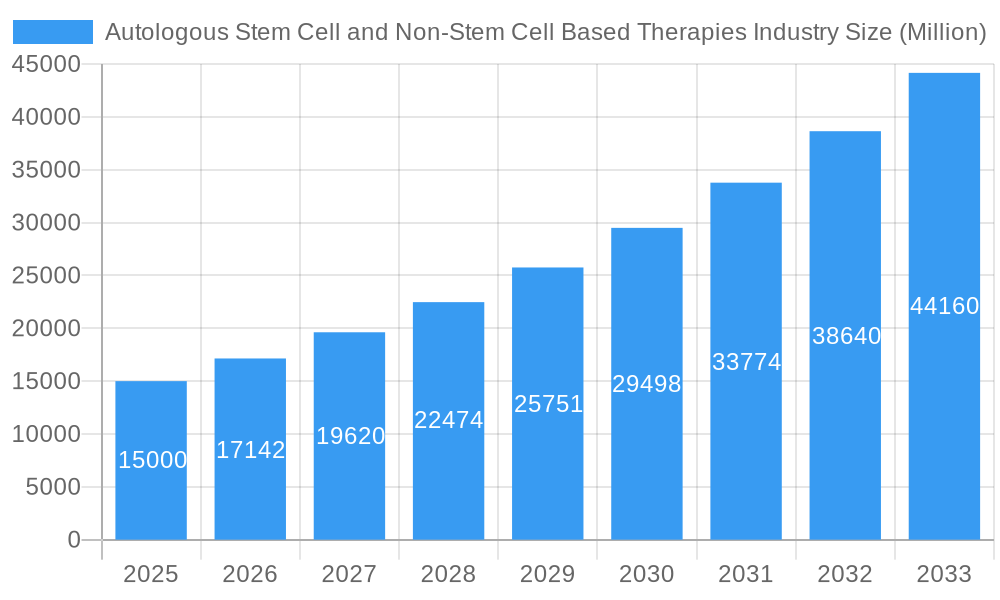
The autologous stem cell and non-stem cell based therapies market is projected for significant expansion, reaching an estimated market size of 6.45 billion by 2033, driven by a robust compound annual growth rate (CAGR) of 14.89%. This growth, observed from the base year 2025, is primarily attributed to the increasing incidence of chronic diseases such as cancer, cardiovascular disorders, and neurodegenerative conditions, which are spurring demand for advanced therapeutic solutions. Advancements in cell processing technology and a deeper understanding of cellular mechanisms are further enhancing the efficacy and safety of these autologous treatments.
Autologous Stem Cell and Non-Stem Cell Based Therapies Industry Market Size (In Billion)
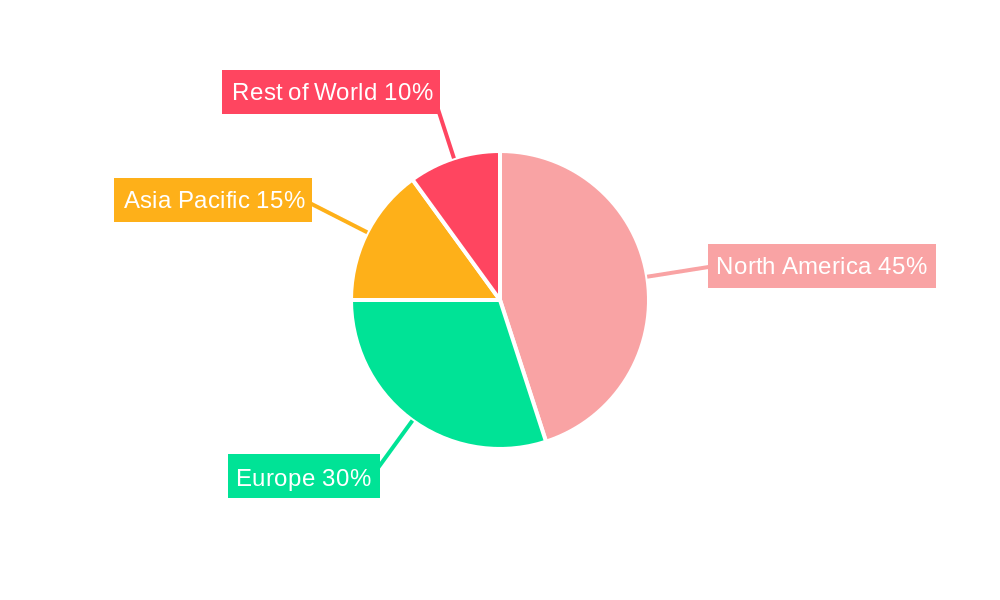
The market is segmented by application, including cancer, neurodegenerative disorders, cardiovascular disease, orthopedic diseases, and others. The dominant application segment is cancer treatment. By end-user, the market includes hospitals, ambulatory surgical centers, and research facilities, with hospitals currently representing the largest share. Geographically, North America and Europe lead in market share due to advanced healthcare infrastructure and high adoption rates. However, the Asia-Pacific region is anticipated to experience the fastest growth, supported by increasing healthcare investments and heightened awareness.
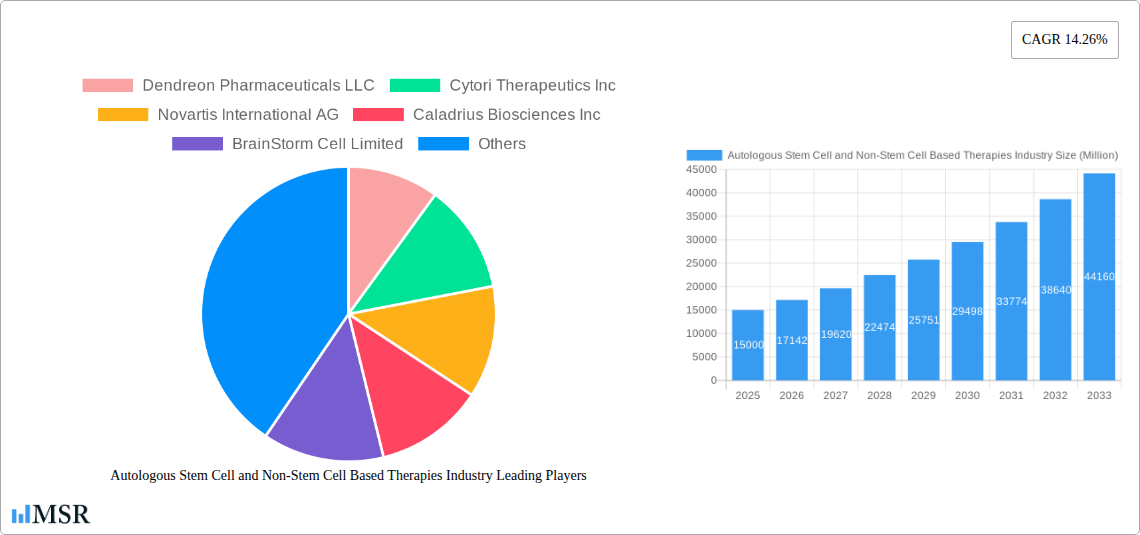
Autologous Stem Cell and Non-Stem Cell Based Therapies Industry Company Market Share
A dynamic competitive landscape, characterized by established pharmaceutical companies and innovative biotech firms, is fostering continuous innovation and ensuring a diverse range of therapies for varied patient needs. Key influencing factors include regulatory approvals and pricing strategies.
Despite the promising outlook, the market faces challenges such as high treatment costs impacting patient accessibility and complex manufacturing processes contributing to substantial development expenses and potential market entry delays. Nevertheless, ongoing research focused on improving efficiency and reducing costs, alongside increased governmental support and collaborative initiatives, are expected to address these hurdles. The future trajectory of the autologous stem cell and non-stem cell based therapies market relies on sustained technological progress, successful clinical validation, and expanded regulatory approvals to broaden access to these transformative treatments.
Autologous Stem Cell and Non-Stem Cell Based Therapies Industry: A Comprehensive Market Report (2019-2033)
This comprehensive report provides a detailed analysis of the Autologous Stem Cell and Non-Stem Cell Based Therapies industry, offering valuable insights for stakeholders, investors, and industry professionals. With a study period spanning 2019-2033, a base year of 2025, and a forecast period of 2025-2033, this report meticulously examines market dynamics, trends, and future growth potential. The global market size is projected to reach xx Million by 2033, exhibiting a CAGR of xx% during the forecast period. This report covers key players such as Dendreon Pharmaceuticals LLC, Cytori Therapeutics Inc, Novartis International AG, Caladrius Biosciences Inc, Brainstorm Cell Limited, Vericel Corp, Gilead Sciences Inc, Castle Creek Biosciences Inc, US Stem Cell Inc, and Holostem Terapie Avanzate Srl.
Autologous Stem Cell and Non-Stem Cell Based Therapies Industry Market Concentration & Dynamics
The Autologous Stem Cell and Non-Stem Cell Based Therapies market is characterized by a moderately concentrated landscape, with a few large players holding significant market share. However, the increasing number of startups and smaller companies entering the field indicates a growing competitive intensity. The market is driven by factors like rising prevalence of chronic diseases, advancements in cell therapy technologies, and increasing investments in R&D. Innovation ecosystems are vibrant, with significant collaborations between academia, research institutions, and pharmaceutical companies.
Regulatory frameworks, while evolving, play a crucial role in shaping market dynamics. Stringent regulatory requirements for cell therapies necessitate significant investment in clinical trials and regulatory approvals, which can impact market entry and expansion. Substitute products, such as traditional drug therapies, pose competition, especially in established treatment areas. However, the unique advantages of cell therapies, such as personalized treatment approaches and potential for long-term efficacy, are driving their adoption. End-user trends show a growing preference for minimally invasive procedures and personalized medicine approaches, bolstering the demand for autologous cell therapies.
Mergers and acquisitions (M&A) are frequent, with an estimated xx M&A deals recorded in the historical period (2019-2024). These acquisitions often involve smaller companies with promising pipeline technologies being acquired by larger players seeking to expand their portfolio or enhance their clinical development capabilities. For example, Metcela’s acquisition of Japan Regenerative Medicine Co. Ltd. in April 2022 highlights the strategic importance of M&A in this dynamic market.
Autologous Stem Cell and Non-Stem Cell Based Therapies Industry Industry Insights & Trends
The Autologous Stem Cell and Non-Stem Cell Based Therapies market is experiencing significant growth, propelled by several key factors. The rising prevalence of chronic diseases such as cancer, cardiovascular diseases, and neurodegenerative disorders is a major driver, fueling the demand for effective and innovative treatment options. Technological advancements in cell processing, storage, and delivery methods are continuously improving the efficacy and safety of these therapies. Moreover, evolving consumer behaviors, characterized by a greater focus on personalized medicine and improved patient outcomes, are further contributing to market expansion. The market size reached xx Million in 2024 and is projected to reach xx Million by 2025.
Technological disruptions, such as the development of next-generation sequencing technologies and advanced bioprinting techniques, are transforming the landscape. These innovations enable more precise cell selection, improved cell manipulation, and more efficient manufacturing processes. Furthermore, the increasing availability of affordable and efficient cell culture technologies is facilitating wider adoption of autologous cell therapies. The growing body of evidence supporting the efficacy and safety of these therapies is further driving market growth and patient acceptance.
Key Markets & Segments Leading Autologous Stem Cell and Non-Stem Cell Based Therapies Industry
The North American market holds the dominant position globally, driven by factors including substantial R&D investments, robust regulatory frameworks, and strong healthcare infrastructure. Within this region, the United States is the leading country.
By Application: The cancer segment accounts for the largest share, owing to the high prevalence of various cancers and the increasing demand for effective treatments. The neurodegenerative disorders segment is also witnessing significant growth due to the growing aged population and the lack of effective treatment options for conditions like Parkinson's and Alzheimer's disease.
By End User: Hospitals constitute the largest segment, followed by ambulatory surgical centers and research facilities. Growth in this segment is fuelled by the increasing number of specialized hospitals and the rising adoption of these therapies in these settings.
By Type: Autologous stem cells currently dominate the market, owing to their personalized approach and potential for greater efficacy. However, autologous non-stem cell therapies are also gaining traction due to their simpler processing requirements and associated lower costs.
Drivers for growth:
- Strong healthcare infrastructure in developed countries
- High prevalence of chronic diseases
- Rising R&D investments and technological advancements
- Favorable regulatory environment (in certain regions)
Autologous Stem Cell and Non-Stem Cell Based Therapies Industry Product Developments
Recent product developments demonstrate substantial progress in enhancing the safety, efficacy, and accessibility of autologous stem cell and non-stem cell therapies. This includes the development of more efficient cell processing techniques, the use of innovative delivery methods, and the development of new cellular products targeting a broader range of diseases. Companies are focusing on creating standardized and scalable manufacturing processes, which will contribute to cost reduction and increase accessibility to these therapies. These advancements are creating new competitive edges and expanding the overall market potential.
Challenges in the Autologous Stem Cell and Non-Stem Cell Based Therapies Industry Market
Significant challenges hinder the widespread adoption of autologous cell therapies. These include stringent regulatory requirements, leading to prolonged and costly approval processes. Supply chain complexities, especially in obtaining high-quality cells and maintaining their viability, represent another significant obstacle. The high cost of treatment and limited reimbursement policies restrict broader patient access. Furthermore, intense competition among established players and emerging companies adds pressure on pricing and profitability. These factors collectively impact market penetration and growth.
Forces Driving Autologous Stem Cell and Non-Stem Cell Based Therapies Industry Growth
Several factors are driving the growth of this industry. Technological advancements, such as improved cell isolation, expansion, and delivery systems are enhancing the efficacy and safety of these therapies. Increasing governmental support through research funding and regulatory approvals are facilitating market expansion. The rising prevalence of chronic diseases necessitates innovative treatments, further boosting demand. The focus on personalized medicine also contributes to the growth as autologous therapies offer tailored treatment solutions.
Long-Term Growth Catalysts in the Autologous Stem Cell and Non-Stem Cell Based Therapies Industry
The long-term growth of this sector hinges on continued innovation in cell processing and delivery technologies, leading to more cost-effective and accessible treatments. Strategic partnerships between pharmaceutical companies and research institutions will accelerate the development and commercialization of new therapies. Expansion into new markets with high disease prevalence and growing healthcare expenditure will be crucial for sustained growth. The increasing understanding of cellular mechanisms and their interactions with the body will lead to novel therapeutic approaches.
Emerging Opportunities in Autologous Stem Cell and Non-Stem Cell Based Therapies Industry
Emerging opportunities include the development of new cell types and combination therapies targeting previously untreatable diseases. The application of AI and machine learning in cell processing and treatment optimization offers significant potential. The expansion into emerging markets with high unmet medical needs represents a significant opportunity. The development of more standardized and automated manufacturing processes will lead to greater scalability and lower costs, making treatments more accessible to a broader patient population.
Leading Players in the Autologous Stem Cell and Non-Stem Cell Based Therapies Industry Sector
- Dendreon Pharmaceuticals LLC
- Cytori Therapeutics Inc
- Novartis International AG
- Caladrius Biosciences Inc
- BrainStorm Cell Limited
- Vericel Corp
- Gilead Sciences Inc
- Castle Creek Biosciences Inc
- US Stem Cell Inc
- Holostem Terapie Avanzate Srl
Key Milestones in Autologous Stem Cell and Non-Stem Cell Based Therapies Industry Industry
- April 2022: Metcela acquires Japan Regenerative Medicine Co. Ltd., expanding its pipeline and strengthening its clinical development infrastructure for regenerative medicine products.
- February 2022: The US FDA approves CARVYKTI (ciltacabtagene autoleucel; cilta-cel) for the treatment of adults with relapsed or refractory multiple myeloma (RRMM). This approval signifies a major advancement in autologous T-cell immunotherapy.
Strategic Outlook for Autologous Stem Cell and Non-Stem Cell Based Therapies Industry Market
The future of the autologous stem cell and non-stem cell based therapies market is promising. Continued innovation and technological advancements will drive the development of new therapies, expanding treatment options for various diseases. Strategic partnerships and collaborations will accelerate the translation of research findings into commercially viable products. Regulatory approvals and supportive reimbursement policies will enhance market access and ensure patient affordability. The market’s long-term growth will be shaped by the ability of industry players to address the challenges related to manufacturing, cost, and regulatory hurdles while delivering safe and effective therapies to patients worldwide.
Autologous Stem Cell and Non-Stem Cell Based Therapies Industry Segmentation
-
1. Type
- 1.1. Autologous Stem Cells
- 1.2. Autologous Non-Stem cells
-
2. Application
- 2.1. Cancer
- 2.2. Neurodegenerative Disorders
- 2.3. Cardiovascular Disease
- 2.4. Orthopedic Diseases
- 2.5. Other Applications
-
3. End User
- 3.1. Hospitals
- 3.2. Ambulatory Surgical Centers
- 3.3. Research Facilities
Autologous Stem Cell and Non-Stem Cell Based Therapies Industry Segmentation By Geography
-
1. North America
- 1.1. United States
- 1.2. Canada
- 1.3. Mexico
-
2. Europe
- 2.1. Germany
- 2.2. United Kingdom
- 2.3. France
- 2.4. Italy
- 2.5. Spain
- 2.6. Rest of Europe
-
3. Asia Pacific
- 3.1. China
- 3.2. Japan
- 3.3. India
- 3.4. Australia
- 3.5. South Korea
- 3.6. Rest of Asia Pacific
-
4. Middle East and Africa
- 4.1. GCC
- 4.2. South Africa
- 4.3. Rest of Middle East and Africa
-
5. South America
- 5.1. Brazil
- 5.2. Argentina
- 5.3. Rest of South America
Autologous Stem Cell and Non-Stem Cell Based Therapies Industry Regional Market Share
Geographic Coverage of Autologous Stem Cell and Non-Stem Cell Based Therapies Industry
Autologous Stem Cell and Non-Stem Cell Based Therapies Industry REPORT HIGHLIGHTS
| Aspects | Details |
|---|---|
| Study Period | 2020-2034 |
| Base Year | 2025 |
| Estimated Year | 2026 |
| Forecast Period | 2026-2034 |
| Historical Period | 2020-2025 |
| Growth Rate | CAGR of 14.89% from 2020-2034 |
| Segmentation |
|
Table of Contents
- 1. Introduction
- 1.1. Research Scope
- 1.2. Market Segmentation
- 1.3. Research Objective
- 1.4. Definitions and Assumptions
- 2. Executive Summary
- 2.1. Market Snapshot
- 3. Market Dynamics
- 3.1. Market Drivers
- 3.2. Market Restrains
- 3.3. Market Trends
- 3.4. Market Opportunities
- 4. Market Factor Analysis
- 4.1. Porters Five Forces
- 4.1.1. Bargaining Power of Suppliers
- 4.1.2. Bargaining Power of Buyers
- 4.1.3. Threat of New Entrants
- 4.1.4. Threat of Substitutes
- 4.1.5. Competitive Rivalry
- 4.2. PESTEL analysis
- 4.3. BCG Analysis
- 4.3.1. Stars (High Growth, High Market Share)
- 4.3.2. Cash Cows (Low Growth, High Market Share)
- 4.3.3. Question Mark (High Growth, Low Market Share)
- 4.3.4. Dogs (Low Growth, Low Market Share)
- 4.4. Ansoff Matrix Analysis
- 4.5. Supply Chain Analysis
- 4.6. Regulatory Landscape
- 4.7. Current Market Potential and Opportunity Assessment (TAM–SAM–SOM Framework)
- 4.8. MSR Analyst Note
- 4.1. Porters Five Forces
- 5. Market Analysis, Insights and Forecast 2021-2033
- 5.1. Market Analysis, Insights and Forecast - by Type
- 5.1.1. Autologous Stem Cells
- 5.1.2. Autologous Non-Stem cells
- 5.2. Market Analysis, Insights and Forecast - by Application
- 5.2.1. Cancer
- 5.2.2. Neurodegenerative Disorders
- 5.2.3. Cardiovascular Disease
- 5.2.4. Orthopedic Diseases
- 5.2.5. Other Applications
- 5.3. Market Analysis, Insights and Forecast - by End User
- 5.3.1. Hospitals
- 5.3.2. Ambulatory Surgical Centers
- 5.3.3. Research Facilities
- 5.4. Market Analysis, Insights and Forecast - by Region
- 5.4.1. North America
- 5.4.2. Europe
- 5.4.3. Asia Pacific
- 5.4.4. Middle East and Africa
- 5.4.5. South America
- 5.1. Market Analysis, Insights and Forecast - by Type
- 6. Global Autologous Stem Cell and Non-Stem Cell Based Therapies Industry Analysis, Insights and Forecast, 2021-2033
- 6.1. Market Analysis, Insights and Forecast - by Type
- 6.1.1. Autologous Stem Cells
- 6.1.2. Autologous Non-Stem cells
- 6.2. Market Analysis, Insights and Forecast - by Application
- 6.2.1. Cancer
- 6.2.2. Neurodegenerative Disorders
- 6.2.3. Cardiovascular Disease
- 6.2.4. Orthopedic Diseases
- 6.2.5. Other Applications
- 6.3. Market Analysis, Insights and Forecast - by End User
- 6.3.1. Hospitals
- 6.3.2. Ambulatory Surgical Centers
- 6.3.3. Research Facilities
- 6.1. Market Analysis, Insights and Forecast - by Type
- 7. North America Autologous Stem Cell and Non-Stem Cell Based Therapies Industry Analysis, Insights and Forecast, 2020-2032
- 7.1. Market Analysis, Insights and Forecast - by Type
- 7.1.1. Autologous Stem Cells
- 7.1.2. Autologous Non-Stem cells
- 7.2. Market Analysis, Insights and Forecast - by Application
- 7.2.1. Cancer
- 7.2.2. Neurodegenerative Disorders
- 7.2.3. Cardiovascular Disease
- 7.2.4. Orthopedic Diseases
- 7.2.5. Other Applications
- 7.3. Market Analysis, Insights and Forecast - by End User
- 7.3.1. Hospitals
- 7.3.2. Ambulatory Surgical Centers
- 7.3.3. Research Facilities
- 7.1. Market Analysis, Insights and Forecast - by Type
- 8. Europe Autologous Stem Cell and Non-Stem Cell Based Therapies Industry Analysis, Insights and Forecast, 2020-2032
- 8.1. Market Analysis, Insights and Forecast - by Type
- 8.1.1. Autologous Stem Cells
- 8.1.2. Autologous Non-Stem cells
- 8.2. Market Analysis, Insights and Forecast - by Application
- 8.2.1. Cancer
- 8.2.2. Neurodegenerative Disorders
- 8.2.3. Cardiovascular Disease
- 8.2.4. Orthopedic Diseases
- 8.2.5. Other Applications
- 8.3. Market Analysis, Insights and Forecast - by End User
- 8.3.1. Hospitals
- 8.3.2. Ambulatory Surgical Centers
- 8.3.3. Research Facilities
- 8.1. Market Analysis, Insights and Forecast - by Type
- 9. Asia Pacific Autologous Stem Cell and Non-Stem Cell Based Therapies Industry Analysis, Insights and Forecast, 2020-2032
- 9.1. Market Analysis, Insights and Forecast - by Type
- 9.1.1. Autologous Stem Cells
- 9.1.2. Autologous Non-Stem cells
- 9.2. Market Analysis, Insights and Forecast - by Application
- 9.2.1. Cancer
- 9.2.2. Neurodegenerative Disorders
- 9.2.3. Cardiovascular Disease
- 9.2.4. Orthopedic Diseases
- 9.2.5. Other Applications
- 9.3. Market Analysis, Insights and Forecast - by End User
- 9.3.1. Hospitals
- 9.3.2. Ambulatory Surgical Centers
- 9.3.3. Research Facilities
- 9.1. Market Analysis, Insights and Forecast - by Type
- 10. Middle East and Africa Autologous Stem Cell and Non-Stem Cell Based Therapies Industry Analysis, Insights and Forecast, 2020-2032
- 10.1. Market Analysis, Insights and Forecast - by Type
- 10.1.1. Autologous Stem Cells
- 10.1.2. Autologous Non-Stem cells
- 10.2. Market Analysis, Insights and Forecast - by Application
- 10.2.1. Cancer
- 10.2.2. Neurodegenerative Disorders
- 10.2.3. Cardiovascular Disease
- 10.2.4. Orthopedic Diseases
- 10.2.5. Other Applications
- 10.3. Market Analysis, Insights and Forecast - by End User
- 10.3.1. Hospitals
- 10.3.2. Ambulatory Surgical Centers
- 10.3.3. Research Facilities
- 10.1. Market Analysis, Insights and Forecast - by Type
- 11. South America Autologous Stem Cell and Non-Stem Cell Based Therapies Industry Analysis, Insights and Forecast, 2020-2032
- 11.1. Market Analysis, Insights and Forecast - by Type
- 11.1.1. Autologous Stem Cells
- 11.1.2. Autologous Non-Stem cells
- 11.2. Market Analysis, Insights and Forecast - by Application
- 11.2.1. Cancer
- 11.2.2. Neurodegenerative Disorders
- 11.2.3. Cardiovascular Disease
- 11.2.4. Orthopedic Diseases
- 11.2.5. Other Applications
- 11.3. Market Analysis, Insights and Forecast - by End User
- 11.3.1. Hospitals
- 11.3.2. Ambulatory Surgical Centers
- 11.3.3. Research Facilities
- 11.1. Market Analysis, Insights and Forecast - by Type
- 12. Competitive Analysis
- 12.1. Company Profiles
- 12.1.1 Dendreon Pharmaceuticals LLC
- 12.1.1.1. Company Overview
- 12.1.1.2. Products
- 12.1.1.3. Company Financials
- 12.1.1.4. SWOT Analysis
- 12.1.2 Cytori Therapeutics Inc
- 12.1.2.1. Company Overview
- 12.1.2.2. Products
- 12.1.2.3. Company Financials
- 12.1.2.4. SWOT Analysis
- 12.1.3 Novartis International AG
- 12.1.3.1. Company Overview
- 12.1.3.2. Products
- 12.1.3.3. Company Financials
- 12.1.3.4. SWOT Analysis
- 12.1.4 Caladrius Biosciences Inc
- 12.1.4.1. Company Overview
- 12.1.4.2. Products
- 12.1.4.3. Company Financials
- 12.1.4.4. SWOT Analysis
- 12.1.5 BrainStorm Cell Limited
- 12.1.5.1. Company Overview
- 12.1.5.2. Products
- 12.1.5.3. Company Financials
- 12.1.5.4. SWOT Analysis
- 12.1.6 Vericel Corp
- 12.1.6.1. Company Overview
- 12.1.6.2. Products
- 12.1.6.3. Company Financials
- 12.1.6.4. SWOT Analysis
- 12.1.7 Gilead Sciences Inc
- 12.1.7.1. Company Overview
- 12.1.7.2. Products
- 12.1.7.3. Company Financials
- 12.1.7.4. SWOT Analysis
- 12.1.8 Castle Creek Biosciences Inc
- 12.1.8.1. Company Overview
- 12.1.8.2. Products
- 12.1.8.3. Company Financials
- 12.1.8.4. SWOT Analysis
- 12.1.9 US Stem Cell Inc
- 12.1.9.1. Company Overview
- 12.1.9.2. Products
- 12.1.9.3. Company Financials
- 12.1.9.4. SWOT Analysis
- 12.1.10 Holostem Terapie Avanzate Srl
- 12.1.10.1. Company Overview
- 12.1.10.2. Products
- 12.1.10.3. Company Financials
- 12.1.10.4. SWOT Analysis
- 12.1.1 Dendreon Pharmaceuticals LLC
- 12.2. Market Entropy
- 12.2.1 Company's Key Areas Served
- 12.2.2 Recent Developments
- 12.3. Company Market Share Analysis 2025
- 12.3.1 Top 5 Companies Market Share Analysis
- 12.3.2 Top 3 Companies Market Share Analysis
- 12.4. List of Potential Customers
- 13. Research Methodology
List of Figures
- Figure 1: Global Autologous Stem Cell and Non-Stem Cell Based Therapies Industry Revenue Breakdown (billion, %) by Region 2025 & 2033
- Figure 2: Global Autologous Stem Cell and Non-Stem Cell Based Therapies Industry Volume Breakdown (K Unit, %) by Region 2025 & 2033
- Figure 3: North America Autologous Stem Cell and Non-Stem Cell Based Therapies Industry Revenue (billion), by Type 2025 & 2033
- Figure 4: North America Autologous Stem Cell and Non-Stem Cell Based Therapies Industry Volume (K Unit), by Type 2025 & 2033
- Figure 5: North America Autologous Stem Cell and Non-Stem Cell Based Therapies Industry Revenue Share (%), by Type 2025 & 2033
- Figure 6: North America Autologous Stem Cell and Non-Stem Cell Based Therapies Industry Volume Share (%), by Type 2025 & 2033
- Figure 7: North America Autologous Stem Cell and Non-Stem Cell Based Therapies Industry Revenue (billion), by Application 2025 & 2033
- Figure 8: North America Autologous Stem Cell and Non-Stem Cell Based Therapies Industry Volume (K Unit), by Application 2025 & 2033
- Figure 9: North America Autologous Stem Cell and Non-Stem Cell Based Therapies Industry Revenue Share (%), by Application 2025 & 2033
- Figure 10: North America Autologous Stem Cell and Non-Stem Cell Based Therapies Industry Volume Share (%), by Application 2025 & 2033
- Figure 11: North America Autologous Stem Cell and Non-Stem Cell Based Therapies Industry Revenue (billion), by End User 2025 & 2033
- Figure 12: North America Autologous Stem Cell and Non-Stem Cell Based Therapies Industry Volume (K Unit), by End User 2025 & 2033
- Figure 13: North America Autologous Stem Cell and Non-Stem Cell Based Therapies Industry Revenue Share (%), by End User 2025 & 2033
- Figure 14: North America Autologous Stem Cell and Non-Stem Cell Based Therapies Industry Volume Share (%), by End User 2025 & 2033
- Figure 15: North America Autologous Stem Cell and Non-Stem Cell Based Therapies Industry Revenue (billion), by Country 2025 & 2033
- Figure 16: North America Autologous Stem Cell and Non-Stem Cell Based Therapies Industry Volume (K Unit), by Country 2025 & 2033
- Figure 17: North America Autologous Stem Cell and Non-Stem Cell Based Therapies Industry Revenue Share (%), by Country 2025 & 2033
- Figure 18: North America Autologous Stem Cell and Non-Stem Cell Based Therapies Industry Volume Share (%), by Country 2025 & 2033
- Figure 19: Europe Autologous Stem Cell and Non-Stem Cell Based Therapies Industry Revenue (billion), by Type 2025 & 2033
- Figure 20: Europe Autologous Stem Cell and Non-Stem Cell Based Therapies Industry Volume (K Unit), by Type 2025 & 2033
- Figure 21: Europe Autologous Stem Cell and Non-Stem Cell Based Therapies Industry Revenue Share (%), by Type 2025 & 2033
- Figure 22: Europe Autologous Stem Cell and Non-Stem Cell Based Therapies Industry Volume Share (%), by Type 2025 & 2033
- Figure 23: Europe Autologous Stem Cell and Non-Stem Cell Based Therapies Industry Revenue (billion), by Application 2025 & 2033
- Figure 24: Europe Autologous Stem Cell and Non-Stem Cell Based Therapies Industry Volume (K Unit), by Application 2025 & 2033
- Figure 25: Europe Autologous Stem Cell and Non-Stem Cell Based Therapies Industry Revenue Share (%), by Application 2025 & 2033
- Figure 26: Europe Autologous Stem Cell and Non-Stem Cell Based Therapies Industry Volume Share (%), by Application 2025 & 2033
- Figure 27: Europe Autologous Stem Cell and Non-Stem Cell Based Therapies Industry Revenue (billion), by End User 2025 & 2033
- Figure 28: Europe Autologous Stem Cell and Non-Stem Cell Based Therapies Industry Volume (K Unit), by End User 2025 & 2033
- Figure 29: Europe Autologous Stem Cell and Non-Stem Cell Based Therapies Industry Revenue Share (%), by End User 2025 & 2033
- Figure 30: Europe Autologous Stem Cell and Non-Stem Cell Based Therapies Industry Volume Share (%), by End User 2025 & 2033
- Figure 31: Europe Autologous Stem Cell and Non-Stem Cell Based Therapies Industry Revenue (billion), by Country 2025 & 2033
- Figure 32: Europe Autologous Stem Cell and Non-Stem Cell Based Therapies Industry Volume (K Unit), by Country 2025 & 2033
- Figure 33: Europe Autologous Stem Cell and Non-Stem Cell Based Therapies Industry Revenue Share (%), by Country 2025 & 2033
- Figure 34: Europe Autologous Stem Cell and Non-Stem Cell Based Therapies Industry Volume Share (%), by Country 2025 & 2033
- Figure 35: Asia Pacific Autologous Stem Cell and Non-Stem Cell Based Therapies Industry Revenue (billion), by Type 2025 & 2033
- Figure 36: Asia Pacific Autologous Stem Cell and Non-Stem Cell Based Therapies Industry Volume (K Unit), by Type 2025 & 2033
- Figure 37: Asia Pacific Autologous Stem Cell and Non-Stem Cell Based Therapies Industry Revenue Share (%), by Type 2025 & 2033
- Figure 38: Asia Pacific Autologous Stem Cell and Non-Stem Cell Based Therapies Industry Volume Share (%), by Type 2025 & 2033
- Figure 39: Asia Pacific Autologous Stem Cell and Non-Stem Cell Based Therapies Industry Revenue (billion), by Application 2025 & 2033
- Figure 40: Asia Pacific Autologous Stem Cell and Non-Stem Cell Based Therapies Industry Volume (K Unit), by Application 2025 & 2033
- Figure 41: Asia Pacific Autologous Stem Cell and Non-Stem Cell Based Therapies Industry Revenue Share (%), by Application 2025 & 2033
- Figure 42: Asia Pacific Autologous Stem Cell and Non-Stem Cell Based Therapies Industry Volume Share (%), by Application 2025 & 2033
- Figure 43: Asia Pacific Autologous Stem Cell and Non-Stem Cell Based Therapies Industry Revenue (billion), by End User 2025 & 2033
- Figure 44: Asia Pacific Autologous Stem Cell and Non-Stem Cell Based Therapies Industry Volume (K Unit), by End User 2025 & 2033
- Figure 45: Asia Pacific Autologous Stem Cell and Non-Stem Cell Based Therapies Industry Revenue Share (%), by End User 2025 & 2033
- Figure 46: Asia Pacific Autologous Stem Cell and Non-Stem Cell Based Therapies Industry Volume Share (%), by End User 2025 & 2033
- Figure 47: Asia Pacific Autologous Stem Cell and Non-Stem Cell Based Therapies Industry Revenue (billion), by Country 2025 & 2033
- Figure 48: Asia Pacific Autologous Stem Cell and Non-Stem Cell Based Therapies Industry Volume (K Unit), by Country 2025 & 2033
- Figure 49: Asia Pacific Autologous Stem Cell and Non-Stem Cell Based Therapies Industry Revenue Share (%), by Country 2025 & 2033
- Figure 50: Asia Pacific Autologous Stem Cell and Non-Stem Cell Based Therapies Industry Volume Share (%), by Country 2025 & 2033
- Figure 51: Middle East and Africa Autologous Stem Cell and Non-Stem Cell Based Therapies Industry Revenue (billion), by Type 2025 & 2033
- Figure 52: Middle East and Africa Autologous Stem Cell and Non-Stem Cell Based Therapies Industry Volume (K Unit), by Type 2025 & 2033
- Figure 53: Middle East and Africa Autologous Stem Cell and Non-Stem Cell Based Therapies Industry Revenue Share (%), by Type 2025 & 2033
- Figure 54: Middle East and Africa Autologous Stem Cell and Non-Stem Cell Based Therapies Industry Volume Share (%), by Type 2025 & 2033
- Figure 55: Middle East and Africa Autologous Stem Cell and Non-Stem Cell Based Therapies Industry Revenue (billion), by Application 2025 & 2033
- Figure 56: Middle East and Africa Autologous Stem Cell and Non-Stem Cell Based Therapies Industry Volume (K Unit), by Application 2025 & 2033
- Figure 57: Middle East and Africa Autologous Stem Cell and Non-Stem Cell Based Therapies Industry Revenue Share (%), by Application 2025 & 2033
- Figure 58: Middle East and Africa Autologous Stem Cell and Non-Stem Cell Based Therapies Industry Volume Share (%), by Application 2025 & 2033
- Figure 59: Middle East and Africa Autologous Stem Cell and Non-Stem Cell Based Therapies Industry Revenue (billion), by End User 2025 & 2033
- Figure 60: Middle East and Africa Autologous Stem Cell and Non-Stem Cell Based Therapies Industry Volume (K Unit), by End User 2025 & 2033
- Figure 61: Middle East and Africa Autologous Stem Cell and Non-Stem Cell Based Therapies Industry Revenue Share (%), by End User 2025 & 2033
- Figure 62: Middle East and Africa Autologous Stem Cell and Non-Stem Cell Based Therapies Industry Volume Share (%), by End User 2025 & 2033
- Figure 63: Middle East and Africa Autologous Stem Cell and Non-Stem Cell Based Therapies Industry Revenue (billion), by Country 2025 & 2033
- Figure 64: Middle East and Africa Autologous Stem Cell and Non-Stem Cell Based Therapies Industry Volume (K Unit), by Country 2025 & 2033
- Figure 65: Middle East and Africa Autologous Stem Cell and Non-Stem Cell Based Therapies Industry Revenue Share (%), by Country 2025 & 2033
- Figure 66: Middle East and Africa Autologous Stem Cell and Non-Stem Cell Based Therapies Industry Volume Share (%), by Country 2025 & 2033
- Figure 67: South America Autologous Stem Cell and Non-Stem Cell Based Therapies Industry Revenue (billion), by Type 2025 & 2033
- Figure 68: South America Autologous Stem Cell and Non-Stem Cell Based Therapies Industry Volume (K Unit), by Type 2025 & 2033
- Figure 69: South America Autologous Stem Cell and Non-Stem Cell Based Therapies Industry Revenue Share (%), by Type 2025 & 2033
- Figure 70: South America Autologous Stem Cell and Non-Stem Cell Based Therapies Industry Volume Share (%), by Type 2025 & 2033
- Figure 71: South America Autologous Stem Cell and Non-Stem Cell Based Therapies Industry Revenue (billion), by Application 2025 & 2033
- Figure 72: South America Autologous Stem Cell and Non-Stem Cell Based Therapies Industry Volume (K Unit), by Application 2025 & 2033
- Figure 73: South America Autologous Stem Cell and Non-Stem Cell Based Therapies Industry Revenue Share (%), by Application 2025 & 2033
- Figure 74: South America Autologous Stem Cell and Non-Stem Cell Based Therapies Industry Volume Share (%), by Application 2025 & 2033
- Figure 75: South America Autologous Stem Cell and Non-Stem Cell Based Therapies Industry Revenue (billion), by End User 2025 & 2033
- Figure 76: South America Autologous Stem Cell and Non-Stem Cell Based Therapies Industry Volume (K Unit), by End User 2025 & 2033
- Figure 77: South America Autologous Stem Cell and Non-Stem Cell Based Therapies Industry Revenue Share (%), by End User 2025 & 2033
- Figure 78: South America Autologous Stem Cell and Non-Stem Cell Based Therapies Industry Volume Share (%), by End User 2025 & 2033
- Figure 79: South America Autologous Stem Cell and Non-Stem Cell Based Therapies Industry Revenue (billion), by Country 2025 & 2033
- Figure 80: South America Autologous Stem Cell and Non-Stem Cell Based Therapies Industry Volume (K Unit), by Country 2025 & 2033
- Figure 81: South America Autologous Stem Cell and Non-Stem Cell Based Therapies Industry Revenue Share (%), by Country 2025 & 2033
- Figure 82: South America Autologous Stem Cell and Non-Stem Cell Based Therapies Industry Volume Share (%), by Country 2025 & 2033
List of Tables
- Table 1: Global Autologous Stem Cell and Non-Stem Cell Based Therapies Industry Revenue billion Forecast, by Type 2020 & 2033
- Table 2: Global Autologous Stem Cell and Non-Stem Cell Based Therapies Industry Volume K Unit Forecast, by Type 2020 & 2033
- Table 3: Global Autologous Stem Cell and Non-Stem Cell Based Therapies Industry Revenue billion Forecast, by Application 2020 & 2033
- Table 4: Global Autologous Stem Cell and Non-Stem Cell Based Therapies Industry Volume K Unit Forecast, by Application 2020 & 2033
- Table 5: Global Autologous Stem Cell and Non-Stem Cell Based Therapies Industry Revenue billion Forecast, by End User 2020 & 2033
- Table 6: Global Autologous Stem Cell and Non-Stem Cell Based Therapies Industry Volume K Unit Forecast, by End User 2020 & 2033
- Table 7: Global Autologous Stem Cell and Non-Stem Cell Based Therapies Industry Revenue billion Forecast, by Region 2020 & 2033
- Table 8: Global Autologous Stem Cell and Non-Stem Cell Based Therapies Industry Volume K Unit Forecast, by Region 2020 & 2033
- Table 9: Global Autologous Stem Cell and Non-Stem Cell Based Therapies Industry Revenue billion Forecast, by Type 2020 & 2033
- Table 10: Global Autologous Stem Cell and Non-Stem Cell Based Therapies Industry Volume K Unit Forecast, by Type 2020 & 2033
- Table 11: Global Autologous Stem Cell and Non-Stem Cell Based Therapies Industry Revenue billion Forecast, by Application 2020 & 2033
- Table 12: Global Autologous Stem Cell and Non-Stem Cell Based Therapies Industry Volume K Unit Forecast, by Application 2020 & 2033
- Table 13: Global Autologous Stem Cell and Non-Stem Cell Based Therapies Industry Revenue billion Forecast, by End User 2020 & 2033
- Table 14: Global Autologous Stem Cell and Non-Stem Cell Based Therapies Industry Volume K Unit Forecast, by End User 2020 & 2033
- Table 15: Global Autologous Stem Cell and Non-Stem Cell Based Therapies Industry Revenue billion Forecast, by Country 2020 & 2033
- Table 16: Global Autologous Stem Cell and Non-Stem Cell Based Therapies Industry Volume K Unit Forecast, by Country 2020 & 2033
- Table 17: United States Autologous Stem Cell and Non-Stem Cell Based Therapies Industry Revenue (billion) Forecast, by Application 2020 & 2033
- Table 18: United States Autologous Stem Cell and Non-Stem Cell Based Therapies Industry Volume (K Unit) Forecast, by Application 2020 & 2033
- Table 19: Canada Autologous Stem Cell and Non-Stem Cell Based Therapies Industry Revenue (billion) Forecast, by Application 2020 & 2033
- Table 20: Canada Autologous Stem Cell and Non-Stem Cell Based Therapies Industry Volume (K Unit) Forecast, by Application 2020 & 2033
- Table 21: Mexico Autologous Stem Cell and Non-Stem Cell Based Therapies Industry Revenue (billion) Forecast, by Application 2020 & 2033
- Table 22: Mexico Autologous Stem Cell and Non-Stem Cell Based Therapies Industry Volume (K Unit) Forecast, by Application 2020 & 2033
- Table 23: Global Autologous Stem Cell and Non-Stem Cell Based Therapies Industry Revenue billion Forecast, by Type 2020 & 2033
- Table 24: Global Autologous Stem Cell and Non-Stem Cell Based Therapies Industry Volume K Unit Forecast, by Type 2020 & 2033
- Table 25: Global Autologous Stem Cell and Non-Stem Cell Based Therapies Industry Revenue billion Forecast, by Application 2020 & 2033
- Table 26: Global Autologous Stem Cell and Non-Stem Cell Based Therapies Industry Volume K Unit Forecast, by Application 2020 & 2033
- Table 27: Global Autologous Stem Cell and Non-Stem Cell Based Therapies Industry Revenue billion Forecast, by End User 2020 & 2033
- Table 28: Global Autologous Stem Cell and Non-Stem Cell Based Therapies Industry Volume K Unit Forecast, by End User 2020 & 2033
- Table 29: Global Autologous Stem Cell and Non-Stem Cell Based Therapies Industry Revenue billion Forecast, by Country 2020 & 2033
- Table 30: Global Autologous Stem Cell and Non-Stem Cell Based Therapies Industry Volume K Unit Forecast, by Country 2020 & 2033
- Table 31: Germany Autologous Stem Cell and Non-Stem Cell Based Therapies Industry Revenue (billion) Forecast, by Application 2020 & 2033
- Table 32: Germany Autologous Stem Cell and Non-Stem Cell Based Therapies Industry Volume (K Unit) Forecast, by Application 2020 & 2033
- Table 33: United Kingdom Autologous Stem Cell and Non-Stem Cell Based Therapies Industry Revenue (billion) Forecast, by Application 2020 & 2033
- Table 34: United Kingdom Autologous Stem Cell and Non-Stem Cell Based Therapies Industry Volume (K Unit) Forecast, by Application 2020 & 2033
- Table 35: France Autologous Stem Cell and Non-Stem Cell Based Therapies Industry Revenue (billion) Forecast, by Application 2020 & 2033
- Table 36: France Autologous Stem Cell and Non-Stem Cell Based Therapies Industry Volume (K Unit) Forecast, by Application 2020 & 2033
- Table 37: Italy Autologous Stem Cell and Non-Stem Cell Based Therapies Industry Revenue (billion) Forecast, by Application 2020 & 2033
- Table 38: Italy Autologous Stem Cell and Non-Stem Cell Based Therapies Industry Volume (K Unit) Forecast, by Application 2020 & 2033
- Table 39: Spain Autologous Stem Cell and Non-Stem Cell Based Therapies Industry Revenue (billion) Forecast, by Application 2020 & 2033
- Table 40: Spain Autologous Stem Cell and Non-Stem Cell Based Therapies Industry Volume (K Unit) Forecast, by Application 2020 & 2033
- Table 41: Rest of Europe Autologous Stem Cell and Non-Stem Cell Based Therapies Industry Revenue (billion) Forecast, by Application 2020 & 2033
- Table 42: Rest of Europe Autologous Stem Cell and Non-Stem Cell Based Therapies Industry Volume (K Unit) Forecast, by Application 2020 & 2033
- Table 43: Global Autologous Stem Cell and Non-Stem Cell Based Therapies Industry Revenue billion Forecast, by Type 2020 & 2033
- Table 44: Global Autologous Stem Cell and Non-Stem Cell Based Therapies Industry Volume K Unit Forecast, by Type 2020 & 2033
- Table 45: Global Autologous Stem Cell and Non-Stem Cell Based Therapies Industry Revenue billion Forecast, by Application 2020 & 2033
- Table 46: Global Autologous Stem Cell and Non-Stem Cell Based Therapies Industry Volume K Unit Forecast, by Application 2020 & 2033
- Table 47: Global Autologous Stem Cell and Non-Stem Cell Based Therapies Industry Revenue billion Forecast, by End User 2020 & 2033
- Table 48: Global Autologous Stem Cell and Non-Stem Cell Based Therapies Industry Volume K Unit Forecast, by End User 2020 & 2033
- Table 49: Global Autologous Stem Cell and Non-Stem Cell Based Therapies Industry Revenue billion Forecast, by Country 2020 & 2033
- Table 50: Global Autologous Stem Cell and Non-Stem Cell Based Therapies Industry Volume K Unit Forecast, by Country 2020 & 2033
- Table 51: China Autologous Stem Cell and Non-Stem Cell Based Therapies Industry Revenue (billion) Forecast, by Application 2020 & 2033
- Table 52: China Autologous Stem Cell and Non-Stem Cell Based Therapies Industry Volume (K Unit) Forecast, by Application 2020 & 2033
- Table 53: Japan Autologous Stem Cell and Non-Stem Cell Based Therapies Industry Revenue (billion) Forecast, by Application 2020 & 2033
- Table 54: Japan Autologous Stem Cell and Non-Stem Cell Based Therapies Industry Volume (K Unit) Forecast, by Application 2020 & 2033
- Table 55: India Autologous Stem Cell and Non-Stem Cell Based Therapies Industry Revenue (billion) Forecast, by Application 2020 & 2033
- Table 56: India Autologous Stem Cell and Non-Stem Cell Based Therapies Industry Volume (K Unit) Forecast, by Application 2020 & 2033
- Table 57: Australia Autologous Stem Cell and Non-Stem Cell Based Therapies Industry Revenue (billion) Forecast, by Application 2020 & 2033
- Table 58: Australia Autologous Stem Cell and Non-Stem Cell Based Therapies Industry Volume (K Unit) Forecast, by Application 2020 & 2033
- Table 59: South Korea Autologous Stem Cell and Non-Stem Cell Based Therapies Industry Revenue (billion) Forecast, by Application 2020 & 2033
- Table 60: South Korea Autologous Stem Cell and Non-Stem Cell Based Therapies Industry Volume (K Unit) Forecast, by Application 2020 & 2033
- Table 61: Rest of Asia Pacific Autologous Stem Cell and Non-Stem Cell Based Therapies Industry Revenue (billion) Forecast, by Application 2020 & 2033
- Table 62: Rest of Asia Pacific Autologous Stem Cell and Non-Stem Cell Based Therapies Industry Volume (K Unit) Forecast, by Application 2020 & 2033
- Table 63: Global Autologous Stem Cell and Non-Stem Cell Based Therapies Industry Revenue billion Forecast, by Type 2020 & 2033
- Table 64: Global Autologous Stem Cell and Non-Stem Cell Based Therapies Industry Volume K Unit Forecast, by Type 2020 & 2033
- Table 65: Global Autologous Stem Cell and Non-Stem Cell Based Therapies Industry Revenue billion Forecast, by Application 2020 & 2033
- Table 66: Global Autologous Stem Cell and Non-Stem Cell Based Therapies Industry Volume K Unit Forecast, by Application 2020 & 2033
- Table 67: Global Autologous Stem Cell and Non-Stem Cell Based Therapies Industry Revenue billion Forecast, by End User 2020 & 2033
- Table 68: Global Autologous Stem Cell and Non-Stem Cell Based Therapies Industry Volume K Unit Forecast, by End User 2020 & 2033
- Table 69: Global Autologous Stem Cell and Non-Stem Cell Based Therapies Industry Revenue billion Forecast, by Country 2020 & 2033
- Table 70: Global Autologous Stem Cell and Non-Stem Cell Based Therapies Industry Volume K Unit Forecast, by Country 2020 & 2033
- Table 71: GCC Autologous Stem Cell and Non-Stem Cell Based Therapies Industry Revenue (billion) Forecast, by Application 2020 & 2033
- Table 72: GCC Autologous Stem Cell and Non-Stem Cell Based Therapies Industry Volume (K Unit) Forecast, by Application 2020 & 2033
- Table 73: South Africa Autologous Stem Cell and Non-Stem Cell Based Therapies Industry Revenue (billion) Forecast, by Application 2020 & 2033
- Table 74: South Africa Autologous Stem Cell and Non-Stem Cell Based Therapies Industry Volume (K Unit) Forecast, by Application 2020 & 2033
- Table 75: Rest of Middle East and Africa Autologous Stem Cell and Non-Stem Cell Based Therapies Industry Revenue (billion) Forecast, by Application 2020 & 2033
- Table 76: Rest of Middle East and Africa Autologous Stem Cell and Non-Stem Cell Based Therapies Industry Volume (K Unit) Forecast, by Application 2020 & 2033
- Table 77: Global Autologous Stem Cell and Non-Stem Cell Based Therapies Industry Revenue billion Forecast, by Type 2020 & 2033
- Table 78: Global Autologous Stem Cell and Non-Stem Cell Based Therapies Industry Volume K Unit Forecast, by Type 2020 & 2033
- Table 79: Global Autologous Stem Cell and Non-Stem Cell Based Therapies Industry Revenue billion Forecast, by Application 2020 & 2033
- Table 80: Global Autologous Stem Cell and Non-Stem Cell Based Therapies Industry Volume K Unit Forecast, by Application 2020 & 2033
- Table 81: Global Autologous Stem Cell and Non-Stem Cell Based Therapies Industry Revenue billion Forecast, by End User 2020 & 2033
- Table 82: Global Autologous Stem Cell and Non-Stem Cell Based Therapies Industry Volume K Unit Forecast, by End User 2020 & 2033
- Table 83: Global Autologous Stem Cell and Non-Stem Cell Based Therapies Industry Revenue billion Forecast, by Country 2020 & 2033
- Table 84: Global Autologous Stem Cell and Non-Stem Cell Based Therapies Industry Volume K Unit Forecast, by Country 2020 & 2033
- Table 85: Brazil Autologous Stem Cell and Non-Stem Cell Based Therapies Industry Revenue (billion) Forecast, by Application 2020 & 2033
- Table 86: Brazil Autologous Stem Cell and Non-Stem Cell Based Therapies Industry Volume (K Unit) Forecast, by Application 2020 & 2033
- Table 87: Argentina Autologous Stem Cell and Non-Stem Cell Based Therapies Industry Revenue (billion) Forecast, by Application 2020 & 2033
- Table 88: Argentina Autologous Stem Cell and Non-Stem Cell Based Therapies Industry Volume (K Unit) Forecast, by Application 2020 & 2033
- Table 89: Rest of South America Autologous Stem Cell and Non-Stem Cell Based Therapies Industry Revenue (billion) Forecast, by Application 2020 & 2033
- Table 90: Rest of South America Autologous Stem Cell and Non-Stem Cell Based Therapies Industry Volume (K Unit) Forecast, by Application 2020 & 2033
Frequently Asked Questions
1. What is the projected Compound Annual Growth Rate (CAGR) of the Autologous Stem Cell and Non-Stem Cell Based Therapies Industry?
The projected CAGR is approximately 14.89%.
2. Which companies are prominent players in the Autologous Stem Cell and Non-Stem Cell Based Therapies Industry?
Key companies in the market include Dendreon Pharmaceuticals LLC, Cytori Therapeutics Inc, Novartis International AG, Caladrius Biosciences Inc, BrainStorm Cell Limited, Vericel Corp, Gilead Sciences Inc , Castle Creek Biosciences Inc, US Stem Cell Inc, Holostem Terapie Avanzate Srl.
3. What are the main segments of the Autologous Stem Cell and Non-Stem Cell Based Therapies Industry?
The market segments include Type, Application, End User.
4. Can you provide details about the market size?
The market size is estimated to be USD 6.45 billion as of 2022.
5. What are some drivers contributing to market growth?
Rising Prevalence of Targeted Diseases; Introduction of Novel Autologous Stem Cell Based Therapies in Regenerative Medicine; Increasing Geriatric Population.
6. What are the notable trends driving market growth?
Cancer Segment Holds Significant Share in the Autologous Stem Cell and Non-Stem Cell Based Therapies Market.
7. Are there any restraints impacting market growth?
High Cost of Autologous Cellular Therapies; Lack of Skilled Professionals.
8. Can you provide examples of recent developments in the market?
In April 2022, Metcela acquired Japan Regenerative Medicine Co. Ltd to develop cardiac stem cell-based therapy. Through the acquisition, Metcela will add an autologous cell product for pediatric congenital heart disease to its pipeline and significantly strengthen its clinical development infrastructure for regenerative medicine products.
9. What pricing options are available for accessing the report?
Pricing options include single-user, multi-user, and enterprise licenses priced at USD 4750, USD 5250, and USD 8750 respectively.
10. Is the market size provided in terms of value or volume?
The market size is provided in terms of value, measured in billion and volume, measured in K Unit.
11. Are there any specific market keywords associated with the report?
Yes, the market keyword associated with the report is "Autologous Stem Cell and Non-Stem Cell Based Therapies Industry," which aids in identifying and referencing the specific market segment covered.
12. How do I determine which pricing option suits my needs best?
The pricing options vary based on user requirements and access needs. Individual users may opt for single-user licenses, while businesses requiring broader access may choose multi-user or enterprise licenses for cost-effective access to the report.
13. Are there any additional resources or data provided in the Autologous Stem Cell and Non-Stem Cell Based Therapies Industry report?
While the report offers comprehensive insights, it's advisable to review the specific contents or supplementary materials provided to ascertain if additional resources or data are available.
14. How can I stay updated on further developments or reports in the Autologous Stem Cell and Non-Stem Cell Based Therapies Industry?
To stay informed about further developments, trends, and reports in the Autologous Stem Cell and Non-Stem Cell Based Therapies Industry, consider subscribing to industry newsletters, following relevant companies and organizations, or regularly checking reputable industry news sources and publications.
Methodology
Step 1 - Identification of Relevant Samples Size from Population Database


Step 2 - Approaches for Defining Global Market Size (Value, Volume* & Price*)

Note*: In applicable scenarios
Step 3 - Data Sources
Primary Research
- Web Analytics
- Survey Reports
- Research Institute
- Latest Research Reports
- Opinion Leaders
Secondary Research
- Annual Reports
- White Paper
- Latest Press Release
- Industry Association
- Paid Database
- Investor Presentations

Step 4 - Data Triangulation
Involves using different sources of information in order to increase the validity of a study
These sources are likely to be stakeholders in a program - participants, other researchers, program staff, other community members, and so on.
Then we put all data in single framework & apply various statistical tools to find out the dynamic on the market.
During the analysis stage, feedback from the stakeholder groups would be compared to determine areas of agreement as well as areas of divergence