

Key Insights
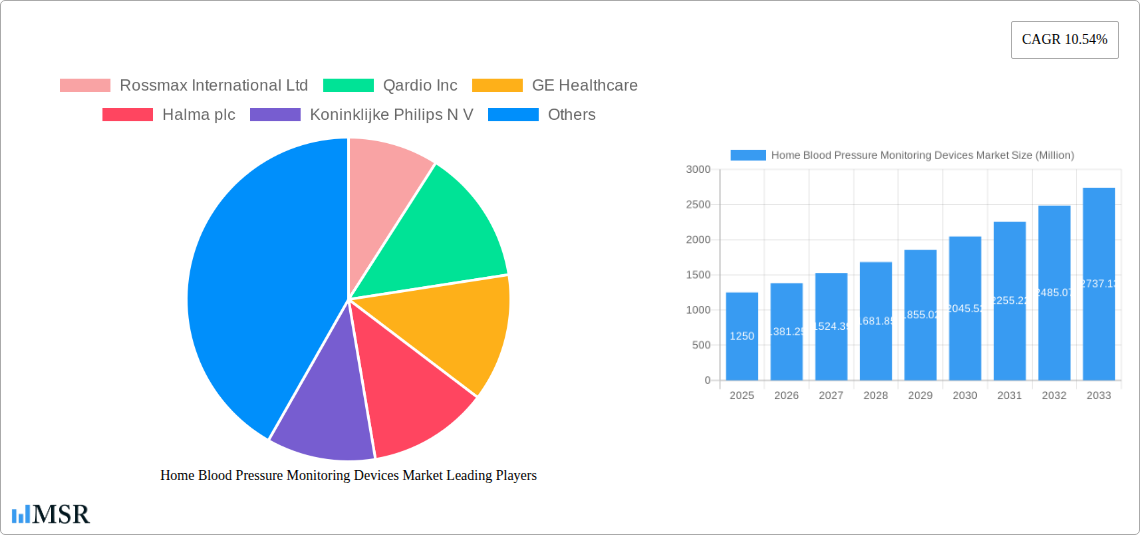
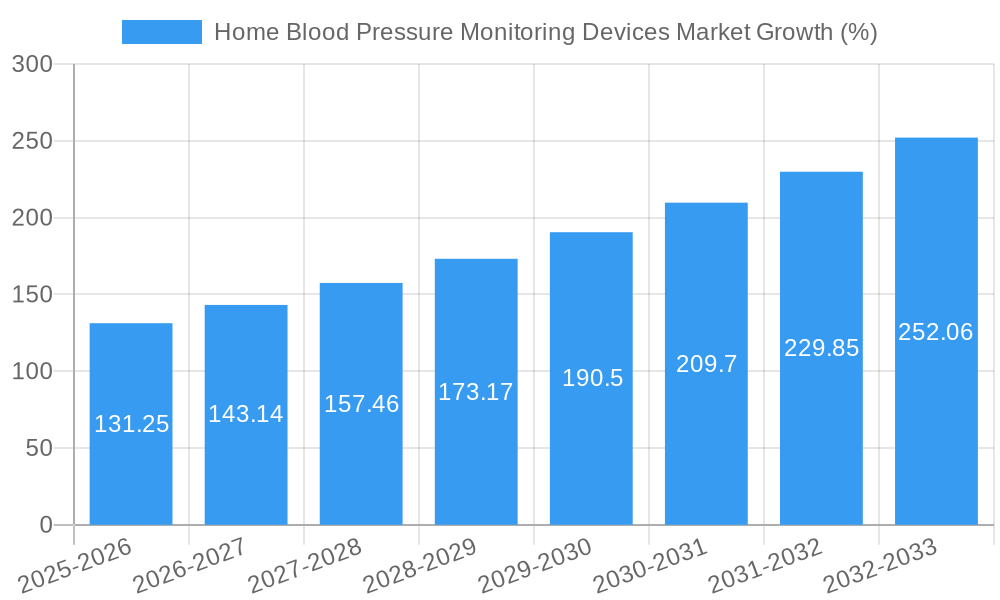
The global home blood pressure monitoring devices market, valued at $1.25 billion in 2025, is projected to experience robust growth, driven by a compound annual growth rate (CAGR) of 10.54% from 2025 to 2033. This expansion is fueled by several key factors. The rising prevalence of hypertension globally, coupled with an aging population increasingly focused on preventative healthcare and self-management of chronic conditions, significantly boosts demand. Technological advancements, such as the development of more accurate, user-friendly, and connected devices (e.g., Bluetooth-enabled monitors integrating with smartphone apps for data tracking and sharing with healthcare providers), are also driving market growth. Furthermore, increased awareness campaigns by healthcare organizations and governments promoting regular blood pressure monitoring are contributing to market expansion. The market is segmented by product type (upper arm monitors, wrist monitors, and accessories) and distribution channel (hospital pharmacies, online pharmacies, and other channels). While upper arm monitors currently dominate the market due to their higher accuracy, the increasing popularity of wrist-worn devices due to convenience is driving segment growth. Online pharmacies are experiencing rapid growth as a distribution channel, reflecting broader e-commerce trends in healthcare. Geographical analysis indicates strong growth potential in developing economies in Asia-Pacific and the Middle East & Africa, where healthcare infrastructure is expanding and the prevalence of hypertension is on the rise.
However, market growth might face some challenges. The relatively high cost of advanced features in some monitors, coupled with potential inaccuracies in certain less-expensive devices, could restrict market penetration in price-sensitive segments. Furthermore, concerns about data privacy and security related to connected devices might hinder adoption. Despite these constraints, the overall market outlook remains positive, driven by the compelling need for convenient, accessible, and affordable blood pressure monitoring solutions and the continuous innovation within the industry. The market is anticipated to see significant expansion across all regions, with North America and Europe maintaining a considerable market share due to high healthcare expenditure and established healthcare infrastructure, while Asia-Pacific is poised for rapid growth driven by increasing healthcare awareness and expanding access to technology.
Home Blood Pressure Monitoring Devices Market: A Comprehensive Report (2019-2033)
This in-depth report provides a comprehensive analysis of the Home Blood Pressure Monitoring Devices Market, covering market dynamics, industry trends, key segments, leading players, and future growth prospects. The study period spans from 2019 to 2033, with 2025 serving as the base and estimated year. The report offers actionable insights for industry stakeholders, investors, and businesses operating within this dynamic sector. The global market is projected to reach xx Million by 2033, exhibiting a CAGR of xx% during the forecast period (2025-2033).
Home Blood Pressure Monitoring Devices Market Concentration & Dynamics
The Home Blood Pressure Monitoring Devices Market is characterized by a moderately consolidated landscape, with several key players holding significant market share. The top 10 companies account for an estimated xx% of the global market in 2025. However, the market is also witnessing increased competition from smaller, specialized firms offering innovative products and services.
Market concentration is influenced by factors such as:
- Innovation Ecosystems: Continuous technological advancements, particularly in sensor technology and data analytics, are driving innovation and shaping market dynamics. The development of cuffless blood pressure monitors and connected devices is significantly impacting market segmentation.
- Regulatory Frameworks: Stringent regulatory approvals and standards for medical devices influence market entry and product development. Variations in regulatory landscapes across different regions further impact market dynamics.
- Substitute Products: While traditional home blood pressure monitors remain prevalent, substitute products like wearable fitness trackers with blood pressure monitoring capabilities are emerging, adding competition to the market.
- End-User Trends: Increasing awareness of cardiovascular health, coupled with aging populations and rising prevalence of hypertension, are driving demand for home blood pressure monitoring devices. Consumer preference for user-friendly, connected devices is also influencing market trends.
- M&A Activities: The market has witnessed a moderate number of mergers and acquisitions (M&A) in recent years (xx deals between 2019 and 2024). These activities are primarily driven by companies seeking to expand their product portfolios, enhance their technological capabilities, and gain access to new markets.
Home Blood Pressure Monitoring Devices Market Industry Insights & Trends
The global Home Blood Pressure Monitoring Devices Market is experiencing robust growth, driven by several key factors. The market size reached xx Million in 2024 and is projected to reach xx Million by 2025, demonstrating a significant market expansion. This growth is fueled by several factors including:
- Rising Prevalence of Hypertension: The increasing global prevalence of hypertension and other cardiovascular diseases is a primary driver, boosting the demand for home monitoring solutions for early detection and effective management.
- Technological Advancements: Continuous improvements in sensor technology, miniaturization, wireless connectivity, and data analytics are leading to more accurate, user-friendly, and connected devices. The integration of smartphone apps and cloud-based data platforms is further enhancing user experience and facilitating remote patient monitoring.
- Evolving Consumer Behavior: Consumers are increasingly adopting proactive health management approaches, preferring convenient and accessible home-based diagnostic tools. The preference for digital health solutions and remote monitoring capabilities is driving demand for connected blood pressure monitoring devices.
Key Markets & Segments Leading Home Blood Pressure Monitoring Devices Market
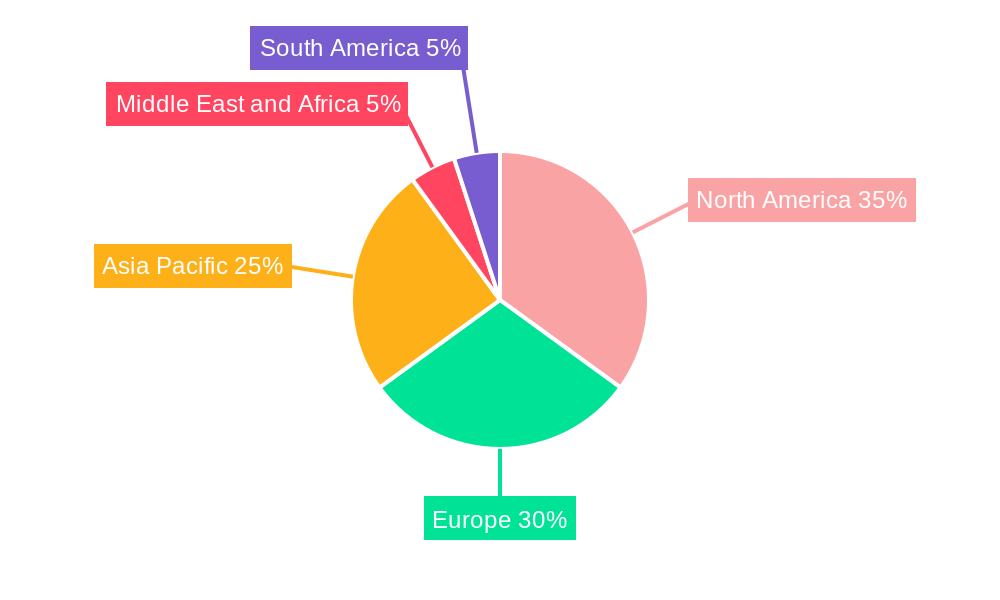
The North American region currently dominates the Home Blood Pressure Monitoring Devices Market, followed by Europe and Asia Pacific. This dominance is attributed to several factors:
- North America: High healthcare expenditure, advanced healthcare infrastructure, increased awareness of cardiovascular health, and early adoption of technological advancements are key drivers.
- Europe: A relatively high prevalence of hypertension and cardiovascular diseases along with supportive government initiatives and robust healthcare systems fuel market growth.
- Asia Pacific: Rapidly growing economies, rising disposable incomes, increasing prevalence of lifestyle diseases, and improving healthcare infrastructure in several countries contribute to market expansion.
Dominant Segments:
- Product: Upper arm monitors continue to hold the largest market share due to their accuracy and reliability. However, wrist monitors are gaining traction owing to their portability and convenience. Accessories such as carrying cases and additional cuffs are also contributing to market growth.
- Distribution Channel: Online pharmacies are witnessing rapid growth, offering convenience and broader reach. Hospital pharmacies continue to be an important distribution channel, particularly for professional-grade devices.
Drivers for Key Segments:
- Upper Arm Monitors: High accuracy, established technology, and reliability contribute to their continued dominance.
- Wrist Monitors: Convenience, portability, and ease of use are driving increasing adoption among consumers.
- Online Pharmacies: Convenience, competitive pricing, and broader geographic reach fuel their rapid growth.
- Hospital Pharmacies: Continued reliance on traditional healthcare channels ensures their significant market share.
Home Blood Pressure Monitoring Devices Market Product Developments
Recent product innovations have focused on enhancing accuracy, improving user experience, and integrating advanced features. The development of cuffless blood pressure monitors using advanced sensor technologies, such as LiveMetric's LiveOne, marks a significant technological advancement. These innovative devices offer real-time continuous monitoring, enabling better management of hypertension and cardiovascular disorders. The integration of smartphone apps and cloud-based data platforms allows for remote patient monitoring and data sharing with healthcare providers, improving patient outcomes. Competitive differentiation is achieved through improved accuracy, user-friendly interfaces, connectivity features, and data analytics capabilities.
Challenges in the Home Blood Pressure Monitoring Devices Market Market
The market faces several challenges, including:
- Regulatory Hurdles: Stringent regulatory approvals and compliance requirements can increase development costs and time to market.
- Supply Chain Issues: Global supply chain disruptions can impact the availability of components and manufacturing capacity, leading to price fluctuations and potential delays.
- Competitive Pressures: Intense competition from established players and new entrants requires continuous innovation and strategic differentiation to maintain market share. This results in price pressure and the need for cost optimization strategies.
Forces Driving Home Blood Pressure Monitoring Devices Market Growth
Several factors drive market growth:
- Technological Advancements: Innovations in sensor technology, miniaturization, wireless connectivity, and data analytics are continuously improving device accuracy, usability, and functionality.
- Economic Growth: Rising disposable incomes in developing countries are increasing affordability and driving demand for healthcare products, including home blood pressure monitors.
- Regulatory Support: Government initiatives promoting preventive healthcare and early disease detection are creating favorable market conditions.
Long-Term Growth Catalysts in the Home Blood Pressure Monitoring Devices Market
Long-term growth is fueled by:
Continued innovation in sensor technology, the development of more user-friendly and accurate devices, and strategic partnerships with healthcare providers to facilitate remote patient monitoring. Expansion into new markets and increased integration with telehealth platforms will also drive growth in the long term.
Emerging Opportunities in Home Blood Pressure Monitoring Devices Market
Emerging opportunities include:
- Expansion into Emerging Markets: Untapped potential exists in rapidly developing economies with rising prevalence of hypertension and increasing healthcare expenditure.
- Integration with Wearable Technology: Integration of blood pressure monitoring capabilities into smartwatches and fitness trackers will expand market reach and accessibility.
- Data Analytics and AI: Leveraging AI-powered data analytics to provide personalized insights and improve patient outcomes presents significant opportunities.
Leading Players in the Home Blood Pressure Monitoring Devices Market Sector
- Rossmax International Ltd
- Qardio Inc
- GE Healthcare
- Halma plc
- Koninklijke Philips N V
- Spengler SAS
- A&D Medical
- Contec Medical
- Omron Healthcare Inc
- Welch Allyn Inc
- Beurer GmbH
- American Diagnostic Corporation
Key Milestones in Home Blood Pressure Monitoring Devices Market Industry
- July 2022: LiveMetric launched LiveOne, a cuff-free wrist-worn blood pressure monitor offering real-time continuous monitoring. This innovation significantly advanced the technology and market potential for continuous blood pressure monitoring.
- February 2022: InBody launched the InBody BP 170, an at-home automatic blood pressure monitor with an improved large display, enhancing user experience and accessibility.
Strategic Outlook for Home Blood Pressure Monitoring Devices Market Market
The Home Blood Pressure Monitoring Devices Market is poised for continued growth, driven by technological advancements, increasing prevalence of hypertension, and expanding adoption of remote patient monitoring. Strategic opportunities exist for companies to focus on developing innovative products, expanding into new markets, and establishing strategic partnerships to capitalize on the growing demand for accurate, user-friendly, and connected home blood pressure monitoring solutions. The focus on continuous monitoring and integration with other health data sources will be key to future market success.
Home Blood Pressure Monitoring Devices Market Segmentation
-
1. Product
- 1.1. Upper Arm Monitors
- 1.2. Wrist Monitors
- 1.3. Accessories
-
2. Distribution Channel
- 2.1. Hospital Pharmacies
- 2.2. Online Pharmacies
- 2.3. Other Distribution Channels
Home Blood Pressure Monitoring Devices Market Segmentation By Geography
-
1. North America
- 1.1. United States
- 1.2. Canada
- 1.3. Mexico
-
2. Europe
- 2.1. Germany
- 2.2. United Kingdom
- 2.3. France
- 2.4. Italy
- 2.5. Spain
- 2.6. Rest of Europe
-
3. Asia Pacific
- 3.1. China
- 3.2. Japan
- 3.3. India
- 3.4. Australia
- 3.5. South Korea
- 3.6. Rest of Asia Pacific
-
4. Middle East and Africa
- 4.1. GCC
- 4.2. South Africa
- 4.3. Rest of Middle East and Africa
-
5. South America
- 5.1. Brazil
- 5.2. Argentina
- 5.3. Rest of South America
Home Blood Pressure Monitoring Devices Market REPORT HIGHLIGHTS
| Aspects | Details |
|---|---|
| Study Period | 2019-2033 |
| Base Year | 2024 |
| Estimated Year | 2025 |
| Forecast Period | 2025-2033 |
| Historical Period | 2019-2024 |
| Growth Rate | CAGR of 10.54% from 2019-2033 |
| Segmentation |
|
Table of Contents
- 1. Introduction
- 1.1. Research Scope
- 1.2. Market Segmentation
- 1.3. Research Methodology
- 1.4. Definitions and Assumptions
- 2. Executive Summary
- 2.1. Introduction
- 3. Market Dynamics
- 3.1. Introduction
- 3.2. Market Drivers
- 3.2.1. Growing Burden of Blood Pressure-Related Diseases; Rise in the Use of Home Blood Pressure Monitors and Active Promotions; Advancements in the Devices
- 3.3. Market Restrains
- 3.3.1. High Cost and Accuracy of Devices
- 3.4. Market Trends
- 3.4.1. Wrist Monitors Segment is Dominating the Home Blood Pressure Monitoring Devices Market
- 4. Market Factor Analysis
- 4.1. Porters Five Forces
- 4.2. Supply/Value Chain
- 4.3. PESTEL analysis
- 4.4. Market Entropy
- 4.5. Patent/Trademark Analysis
- 5. Global Home Blood Pressure Monitoring Devices Market Analysis, Insights and Forecast, 2019-2031
- 5.1. Market Analysis, Insights and Forecast - by Product
- 5.1.1. Upper Arm Monitors
- 5.1.2. Wrist Monitors
- 5.1.3. Accessories
- 5.2. Market Analysis, Insights and Forecast - by Distribution Channel
- 5.2.1. Hospital Pharmacies
- 5.2.2. Online Pharmacies
- 5.2.3. Other Distribution Channels
- 5.3. Market Analysis, Insights and Forecast - by Region
- 5.3.1. North America
- 5.3.2. Europe
- 5.3.3. Asia Pacific
- 5.3.4. Middle East and Africa
- 5.3.5. South America
- 5.1. Market Analysis, Insights and Forecast - by Product
- 6. North America Home Blood Pressure Monitoring Devices Market Analysis, Insights and Forecast, 2019-2031
- 6.1. Market Analysis, Insights and Forecast - by Product
- 6.1.1. Upper Arm Monitors
- 6.1.2. Wrist Monitors
- 6.1.3. Accessories
- 6.2. Market Analysis, Insights and Forecast - by Distribution Channel
- 6.2.1. Hospital Pharmacies
- 6.2.2. Online Pharmacies
- 6.2.3. Other Distribution Channels
- 6.1. Market Analysis, Insights and Forecast - by Product
- 7. Europe Home Blood Pressure Monitoring Devices Market Analysis, Insights and Forecast, 2019-2031
- 7.1. Market Analysis, Insights and Forecast - by Product
- 7.1.1. Upper Arm Monitors
- 7.1.2. Wrist Monitors
- 7.1.3. Accessories
- 7.2. Market Analysis, Insights and Forecast - by Distribution Channel
- 7.2.1. Hospital Pharmacies
- 7.2.2. Online Pharmacies
- 7.2.3. Other Distribution Channels
- 7.1. Market Analysis, Insights and Forecast - by Product
- 8. Asia Pacific Home Blood Pressure Monitoring Devices Market Analysis, Insights and Forecast, 2019-2031
- 8.1. Market Analysis, Insights and Forecast - by Product
- 8.1.1. Upper Arm Monitors
- 8.1.2. Wrist Monitors
- 8.1.3. Accessories
- 8.2. Market Analysis, Insights and Forecast - by Distribution Channel
- 8.2.1. Hospital Pharmacies
- 8.2.2. Online Pharmacies
- 8.2.3. Other Distribution Channels
- 8.1. Market Analysis, Insights and Forecast - by Product
- 9. Middle East and Africa Home Blood Pressure Monitoring Devices Market Analysis, Insights and Forecast, 2019-2031
- 9.1. Market Analysis, Insights and Forecast - by Product
- 9.1.1. Upper Arm Monitors
- 9.1.2. Wrist Monitors
- 9.1.3. Accessories
- 9.2. Market Analysis, Insights and Forecast - by Distribution Channel
- 9.2.1. Hospital Pharmacies
- 9.2.2. Online Pharmacies
- 9.2.3. Other Distribution Channels
- 9.1. Market Analysis, Insights and Forecast - by Product
- 10. South America Home Blood Pressure Monitoring Devices Market Analysis, Insights and Forecast, 2019-2031
- 10.1. Market Analysis, Insights and Forecast - by Product
- 10.1.1. Upper Arm Monitors
- 10.1.2. Wrist Monitors
- 10.1.3. Accessories
- 10.2. Market Analysis, Insights and Forecast - by Distribution Channel
- 10.2.1. Hospital Pharmacies
- 10.2.2. Online Pharmacies
- 10.2.3. Other Distribution Channels
- 10.1. Market Analysis, Insights and Forecast - by Product
- 11. North America Home Blood Pressure Monitoring Devices Market Analysis, Insights and Forecast, 2019-2031
- 11.1. Market Analysis, Insights and Forecast - By Country/Sub-region
- 11.1.1 United States
- 11.1.2 Canada
- 11.1.3 Mexico
- 12. Europe Home Blood Pressure Monitoring Devices Market Analysis, Insights and Forecast, 2019-2031
- 12.1. Market Analysis, Insights and Forecast - By Country/Sub-region
- 12.1.1 Germany
- 12.1.2 United Kingdom
- 12.1.3 France
- 12.1.4 Italy
- 12.1.5 Spain
- 12.1.6 Rest of Europe
- 13. Asia Pacific Home Blood Pressure Monitoring Devices Market Analysis, Insights and Forecast, 2019-2031
- 13.1. Market Analysis, Insights and Forecast - By Country/Sub-region
- 13.1.1 China
- 13.1.2 Japan
- 13.1.3 India
- 13.1.4 Australia
- 13.1.5 South Korea
- 13.1.6 Rest of Asia Pacific
- 14. Middle East and Africa Home Blood Pressure Monitoring Devices Market Analysis, Insights and Forecast, 2019-2031
- 14.1. Market Analysis, Insights and Forecast - By Country/Sub-region
- 14.1.1 GCC
- 14.1.2 South Africa
- 14.1.3 Rest of Middle East and Africa
- 15. South America Home Blood Pressure Monitoring Devices Market Analysis, Insights and Forecast, 2019-2031
- 15.1. Market Analysis, Insights and Forecast - By Country/Sub-region
- 15.1.1 Brazil
- 15.1.2 Argentina
- 15.1.3 Rest of South America
- 16. Competitive Analysis
- 16.1. Global Market Share Analysis 2024
- 16.2. Company Profiles
- 16.2.1 Rossmax International Ltd
- 16.2.1.1. Overview
- 16.2.1.2. Products
- 16.2.1.3. SWOT Analysis
- 16.2.1.4. Recent Developments
- 16.2.1.5. Financials (Based on Availability)
- 16.2.2 Qardio Inc
- 16.2.2.1. Overview
- 16.2.2.2. Products
- 16.2.2.3. SWOT Analysis
- 16.2.2.4. Recent Developments
- 16.2.2.5. Financials (Based on Availability)
- 16.2.3 GE Healthcare
- 16.2.3.1. Overview
- 16.2.3.2. Products
- 16.2.3.3. SWOT Analysis
- 16.2.3.4. Recent Developments
- 16.2.3.5. Financials (Based on Availability)
- 16.2.4 Halma plc
- 16.2.4.1. Overview
- 16.2.4.2. Products
- 16.2.4.3. SWOT Analysis
- 16.2.4.4. Recent Developments
- 16.2.4.5. Financials (Based on Availability)
- 16.2.5 Koninklijke Philips N V
- 16.2.5.1. Overview
- 16.2.5.2. Products
- 16.2.5.3. SWOT Analysis
- 16.2.5.4. Recent Developments
- 16.2.5.5. Financials (Based on Availability)
- 16.2.6 Spengler SAS
- 16.2.6.1. Overview
- 16.2.6.2. Products
- 16.2.6.3. SWOT Analysis
- 16.2.6.4. Recent Developments
- 16.2.6.5. Financials (Based on Availability)
- 16.2.7 A&D Medical
- 16.2.7.1. Overview
- 16.2.7.2. Products
- 16.2.7.3. SWOT Analysis
- 16.2.7.4. Recent Developments
- 16.2.7.5. Financials (Based on Availability)
- 16.2.8 Contec Medical
- 16.2.8.1. Overview
- 16.2.8.2. Products
- 16.2.8.3. SWOT Analysis
- 16.2.8.4. Recent Developments
- 16.2.8.5. Financials (Based on Availability)
- 16.2.9 Omron Healthcare Inc
- 16.2.9.1. Overview
- 16.2.9.2. Products
- 16.2.9.3. SWOT Analysis
- 16.2.9.4. Recent Developments
- 16.2.9.5. Financials (Based on Availability)
- 16.2.10 Welch Allyn Inc
- 16.2.10.1. Overview
- 16.2.10.2. Products
- 16.2.10.3. SWOT Analysis
- 16.2.10.4. Recent Developments
- 16.2.10.5. Financials (Based on Availability)
- 16.2.11 Beurer GmbH
- 16.2.11.1. Overview
- 16.2.11.2. Products
- 16.2.11.3. SWOT Analysis
- 16.2.11.4. Recent Developments
- 16.2.11.5. Financials (Based on Availability)
- 16.2.12 American Diagnostic Corporation
- 16.2.12.1. Overview
- 16.2.12.2. Products
- 16.2.12.3. SWOT Analysis
- 16.2.12.4. Recent Developments
- 16.2.12.5. Financials (Based on Availability)
- 16.2.1 Rossmax International Ltd
List of Figures
- Figure 1: Global Home Blood Pressure Monitoring Devices Market Revenue Breakdown (Million, %) by Region 2024 & 2032
- Figure 2: Global Home Blood Pressure Monitoring Devices Market Volume Breakdown (K Unit, %) by Region 2024 & 2032
- Figure 3: North America Home Blood Pressure Monitoring Devices Market Revenue (Million), by Country 2024 & 2032
- Figure 4: North America Home Blood Pressure Monitoring Devices Market Volume (K Unit), by Country 2024 & 2032
- Figure 5: North America Home Blood Pressure Monitoring Devices Market Revenue Share (%), by Country 2024 & 2032
- Figure 6: North America Home Blood Pressure Monitoring Devices Market Volume Share (%), by Country 2024 & 2032
- Figure 7: Europe Home Blood Pressure Monitoring Devices Market Revenue (Million), by Country 2024 & 2032
- Figure 8: Europe Home Blood Pressure Monitoring Devices Market Volume (K Unit), by Country 2024 & 2032
- Figure 9: Europe Home Blood Pressure Monitoring Devices Market Revenue Share (%), by Country 2024 & 2032
- Figure 10: Europe Home Blood Pressure Monitoring Devices Market Volume Share (%), by Country 2024 & 2032
- Figure 11: Asia Pacific Home Blood Pressure Monitoring Devices Market Revenue (Million), by Country 2024 & 2032
- Figure 12: Asia Pacific Home Blood Pressure Monitoring Devices Market Volume (K Unit), by Country 2024 & 2032
- Figure 13: Asia Pacific Home Blood Pressure Monitoring Devices Market Revenue Share (%), by Country 2024 & 2032
- Figure 14: Asia Pacific Home Blood Pressure Monitoring Devices Market Volume Share (%), by Country 2024 & 2032
- Figure 15: Middle East and Africa Home Blood Pressure Monitoring Devices Market Revenue (Million), by Country 2024 & 2032
- Figure 16: Middle East and Africa Home Blood Pressure Monitoring Devices Market Volume (K Unit), by Country 2024 & 2032
- Figure 17: Middle East and Africa Home Blood Pressure Monitoring Devices Market Revenue Share (%), by Country 2024 & 2032
- Figure 18: Middle East and Africa Home Blood Pressure Monitoring Devices Market Volume Share (%), by Country 2024 & 2032
- Figure 19: South America Home Blood Pressure Monitoring Devices Market Revenue (Million), by Country 2024 & 2032
- Figure 20: South America Home Blood Pressure Monitoring Devices Market Volume (K Unit), by Country 2024 & 2032
- Figure 21: South America Home Blood Pressure Monitoring Devices Market Revenue Share (%), by Country 2024 & 2032
- Figure 22: South America Home Blood Pressure Monitoring Devices Market Volume Share (%), by Country 2024 & 2032
- Figure 23: North America Home Blood Pressure Monitoring Devices Market Revenue (Million), by Product 2024 & 2032
- Figure 24: North America Home Blood Pressure Monitoring Devices Market Volume (K Unit), by Product 2024 & 2032
- Figure 25: North America Home Blood Pressure Monitoring Devices Market Revenue Share (%), by Product 2024 & 2032
- Figure 26: North America Home Blood Pressure Monitoring Devices Market Volume Share (%), by Product 2024 & 2032
- Figure 27: North America Home Blood Pressure Monitoring Devices Market Revenue (Million), by Distribution Channel 2024 & 2032
- Figure 28: North America Home Blood Pressure Monitoring Devices Market Volume (K Unit), by Distribution Channel 2024 & 2032
- Figure 29: North America Home Blood Pressure Monitoring Devices Market Revenue Share (%), by Distribution Channel 2024 & 2032
- Figure 30: North America Home Blood Pressure Monitoring Devices Market Volume Share (%), by Distribution Channel 2024 & 2032
- Figure 31: North America Home Blood Pressure Monitoring Devices Market Revenue (Million), by Country 2024 & 2032
- Figure 32: North America Home Blood Pressure Monitoring Devices Market Volume (K Unit), by Country 2024 & 2032
- Figure 33: North America Home Blood Pressure Monitoring Devices Market Revenue Share (%), by Country 2024 & 2032
- Figure 34: North America Home Blood Pressure Monitoring Devices Market Volume Share (%), by Country 2024 & 2032
- Figure 35: Europe Home Blood Pressure Monitoring Devices Market Revenue (Million), by Product 2024 & 2032
- Figure 36: Europe Home Blood Pressure Monitoring Devices Market Volume (K Unit), by Product 2024 & 2032
- Figure 37: Europe Home Blood Pressure Monitoring Devices Market Revenue Share (%), by Product 2024 & 2032
- Figure 38: Europe Home Blood Pressure Monitoring Devices Market Volume Share (%), by Product 2024 & 2032
- Figure 39: Europe Home Blood Pressure Monitoring Devices Market Revenue (Million), by Distribution Channel 2024 & 2032
- Figure 40: Europe Home Blood Pressure Monitoring Devices Market Volume (K Unit), by Distribution Channel 2024 & 2032
- Figure 41: Europe Home Blood Pressure Monitoring Devices Market Revenue Share (%), by Distribution Channel 2024 & 2032
- Figure 42: Europe Home Blood Pressure Monitoring Devices Market Volume Share (%), by Distribution Channel 2024 & 2032
- Figure 43: Europe Home Blood Pressure Monitoring Devices Market Revenue (Million), by Country 2024 & 2032
- Figure 44: Europe Home Blood Pressure Monitoring Devices Market Volume (K Unit), by Country 2024 & 2032
- Figure 45: Europe Home Blood Pressure Monitoring Devices Market Revenue Share (%), by Country 2024 & 2032
- Figure 46: Europe Home Blood Pressure Monitoring Devices Market Volume Share (%), by Country 2024 & 2032
- Figure 47: Asia Pacific Home Blood Pressure Monitoring Devices Market Revenue (Million), by Product 2024 & 2032
- Figure 48: Asia Pacific Home Blood Pressure Monitoring Devices Market Volume (K Unit), by Product 2024 & 2032
- Figure 49: Asia Pacific Home Blood Pressure Monitoring Devices Market Revenue Share (%), by Product 2024 & 2032
- Figure 50: Asia Pacific Home Blood Pressure Monitoring Devices Market Volume Share (%), by Product 2024 & 2032
- Figure 51: Asia Pacific Home Blood Pressure Monitoring Devices Market Revenue (Million), by Distribution Channel 2024 & 2032
- Figure 52: Asia Pacific Home Blood Pressure Monitoring Devices Market Volume (K Unit), by Distribution Channel 2024 & 2032
- Figure 53: Asia Pacific Home Blood Pressure Monitoring Devices Market Revenue Share (%), by Distribution Channel 2024 & 2032
- Figure 54: Asia Pacific Home Blood Pressure Monitoring Devices Market Volume Share (%), by Distribution Channel 2024 & 2032
- Figure 55: Asia Pacific Home Blood Pressure Monitoring Devices Market Revenue (Million), by Country 2024 & 2032
- Figure 56: Asia Pacific Home Blood Pressure Monitoring Devices Market Volume (K Unit), by Country 2024 & 2032
- Figure 57: Asia Pacific Home Blood Pressure Monitoring Devices Market Revenue Share (%), by Country 2024 & 2032
- Figure 58: Asia Pacific Home Blood Pressure Monitoring Devices Market Volume Share (%), by Country 2024 & 2032
- Figure 59: Middle East and Africa Home Blood Pressure Monitoring Devices Market Revenue (Million), by Product 2024 & 2032
- Figure 60: Middle East and Africa Home Blood Pressure Monitoring Devices Market Volume (K Unit), by Product 2024 & 2032
- Figure 61: Middle East and Africa Home Blood Pressure Monitoring Devices Market Revenue Share (%), by Product 2024 & 2032
- Figure 62: Middle East and Africa Home Blood Pressure Monitoring Devices Market Volume Share (%), by Product 2024 & 2032
- Figure 63: Middle East and Africa Home Blood Pressure Monitoring Devices Market Revenue (Million), by Distribution Channel 2024 & 2032
- Figure 64: Middle East and Africa Home Blood Pressure Monitoring Devices Market Volume (K Unit), by Distribution Channel 2024 & 2032
- Figure 65: Middle East and Africa Home Blood Pressure Monitoring Devices Market Revenue Share (%), by Distribution Channel 2024 & 2032
- Figure 66: Middle East and Africa Home Blood Pressure Monitoring Devices Market Volume Share (%), by Distribution Channel 2024 & 2032
- Figure 67: Middle East and Africa Home Blood Pressure Monitoring Devices Market Revenue (Million), by Country 2024 & 2032
- Figure 68: Middle East and Africa Home Blood Pressure Monitoring Devices Market Volume (K Unit), by Country 2024 & 2032
- Figure 69: Middle East and Africa Home Blood Pressure Monitoring Devices Market Revenue Share (%), by Country 2024 & 2032
- Figure 70: Middle East and Africa Home Blood Pressure Monitoring Devices Market Volume Share (%), by Country 2024 & 2032
- Figure 71: South America Home Blood Pressure Monitoring Devices Market Revenue (Million), by Product 2024 & 2032
- Figure 72: South America Home Blood Pressure Monitoring Devices Market Volume (K Unit), by Product 2024 & 2032
- Figure 73: South America Home Blood Pressure Monitoring Devices Market Revenue Share (%), by Product 2024 & 2032
- Figure 74: South America Home Blood Pressure Monitoring Devices Market Volume Share (%), by Product 2024 & 2032
- Figure 75: South America Home Blood Pressure Monitoring Devices Market Revenue (Million), by Distribution Channel 2024 & 2032
- Figure 76: South America Home Blood Pressure Monitoring Devices Market Volume (K Unit), by Distribution Channel 2024 & 2032
- Figure 77: South America Home Blood Pressure Monitoring Devices Market Revenue Share (%), by Distribution Channel 2024 & 2032
- Figure 78: South America Home Blood Pressure Monitoring Devices Market Volume Share (%), by Distribution Channel 2024 & 2032
- Figure 79: South America Home Blood Pressure Monitoring Devices Market Revenue (Million), by Country 2024 & 2032
- Figure 80: South America Home Blood Pressure Monitoring Devices Market Volume (K Unit), by Country 2024 & 2032
- Figure 81: South America Home Blood Pressure Monitoring Devices Market Revenue Share (%), by Country 2024 & 2032
- Figure 82: South America Home Blood Pressure Monitoring Devices Market Volume Share (%), by Country 2024 & 2032
List of Tables
- Table 1: Global Home Blood Pressure Monitoring Devices Market Revenue Million Forecast, by Region 2019 & 2032
- Table 2: Global Home Blood Pressure Monitoring Devices Market Volume K Unit Forecast, by Region 2019 & 2032
- Table 3: Global Home Blood Pressure Monitoring Devices Market Revenue Million Forecast, by Product 2019 & 2032
- Table 4: Global Home Blood Pressure Monitoring Devices Market Volume K Unit Forecast, by Product 2019 & 2032
- Table 5: Global Home Blood Pressure Monitoring Devices Market Revenue Million Forecast, by Distribution Channel 2019 & 2032
- Table 6: Global Home Blood Pressure Monitoring Devices Market Volume K Unit Forecast, by Distribution Channel 2019 & 2032
- Table 7: Global Home Blood Pressure Monitoring Devices Market Revenue Million Forecast, by Region 2019 & 2032
- Table 8: Global Home Blood Pressure Monitoring Devices Market Volume K Unit Forecast, by Region 2019 & 2032
- Table 9: Global Home Blood Pressure Monitoring Devices Market Revenue Million Forecast, by Country 2019 & 2032
- Table 10: Global Home Blood Pressure Monitoring Devices Market Volume K Unit Forecast, by Country 2019 & 2032
- Table 11: United States Home Blood Pressure Monitoring Devices Market Revenue (Million) Forecast, by Application 2019 & 2032
- Table 12: United States Home Blood Pressure Monitoring Devices Market Volume (K Unit) Forecast, by Application 2019 & 2032
- Table 13: Canada Home Blood Pressure Monitoring Devices Market Revenue (Million) Forecast, by Application 2019 & 2032
- Table 14: Canada Home Blood Pressure Monitoring Devices Market Volume (K Unit) Forecast, by Application 2019 & 2032
- Table 15: Mexico Home Blood Pressure Monitoring Devices Market Revenue (Million) Forecast, by Application 2019 & 2032
- Table 16: Mexico Home Blood Pressure Monitoring Devices Market Volume (K Unit) Forecast, by Application 2019 & 2032
- Table 17: Global Home Blood Pressure Monitoring Devices Market Revenue Million Forecast, by Country 2019 & 2032
- Table 18: Global Home Blood Pressure Monitoring Devices Market Volume K Unit Forecast, by Country 2019 & 2032
- Table 19: Germany Home Blood Pressure Monitoring Devices Market Revenue (Million) Forecast, by Application 2019 & 2032
- Table 20: Germany Home Blood Pressure Monitoring Devices Market Volume (K Unit) Forecast, by Application 2019 & 2032
- Table 21: United Kingdom Home Blood Pressure Monitoring Devices Market Revenue (Million) Forecast, by Application 2019 & 2032
- Table 22: United Kingdom Home Blood Pressure Monitoring Devices Market Volume (K Unit) Forecast, by Application 2019 & 2032
- Table 23: France Home Blood Pressure Monitoring Devices Market Revenue (Million) Forecast, by Application 2019 & 2032
- Table 24: France Home Blood Pressure Monitoring Devices Market Volume (K Unit) Forecast, by Application 2019 & 2032
- Table 25: Italy Home Blood Pressure Monitoring Devices Market Revenue (Million) Forecast, by Application 2019 & 2032
- Table 26: Italy Home Blood Pressure Monitoring Devices Market Volume (K Unit) Forecast, by Application 2019 & 2032
- Table 27: Spain Home Blood Pressure Monitoring Devices Market Revenue (Million) Forecast, by Application 2019 & 2032
- Table 28: Spain Home Blood Pressure Monitoring Devices Market Volume (K Unit) Forecast, by Application 2019 & 2032
- Table 29: Rest of Europe Home Blood Pressure Monitoring Devices Market Revenue (Million) Forecast, by Application 2019 & 2032
- Table 30: Rest of Europe Home Blood Pressure Monitoring Devices Market Volume (K Unit) Forecast, by Application 2019 & 2032
- Table 31: Global Home Blood Pressure Monitoring Devices Market Revenue Million Forecast, by Country 2019 & 2032
- Table 32: Global Home Blood Pressure Monitoring Devices Market Volume K Unit Forecast, by Country 2019 & 2032
- Table 33: China Home Blood Pressure Monitoring Devices Market Revenue (Million) Forecast, by Application 2019 & 2032
- Table 34: China Home Blood Pressure Monitoring Devices Market Volume (K Unit) Forecast, by Application 2019 & 2032
- Table 35: Japan Home Blood Pressure Monitoring Devices Market Revenue (Million) Forecast, by Application 2019 & 2032
- Table 36: Japan Home Blood Pressure Monitoring Devices Market Volume (K Unit) Forecast, by Application 2019 & 2032
- Table 37: India Home Blood Pressure Monitoring Devices Market Revenue (Million) Forecast, by Application 2019 & 2032
- Table 38: India Home Blood Pressure Monitoring Devices Market Volume (K Unit) Forecast, by Application 2019 & 2032
- Table 39: Australia Home Blood Pressure Monitoring Devices Market Revenue (Million) Forecast, by Application 2019 & 2032
- Table 40: Australia Home Blood Pressure Monitoring Devices Market Volume (K Unit) Forecast, by Application 2019 & 2032
- Table 41: South Korea Home Blood Pressure Monitoring Devices Market Revenue (Million) Forecast, by Application 2019 & 2032
- Table 42: South Korea Home Blood Pressure Monitoring Devices Market Volume (K Unit) Forecast, by Application 2019 & 2032
- Table 43: Rest of Asia Pacific Home Blood Pressure Monitoring Devices Market Revenue (Million) Forecast, by Application 2019 & 2032
- Table 44: Rest of Asia Pacific Home Blood Pressure Monitoring Devices Market Volume (K Unit) Forecast, by Application 2019 & 2032
- Table 45: Global Home Blood Pressure Monitoring Devices Market Revenue Million Forecast, by Country 2019 & 2032
- Table 46: Global Home Blood Pressure Monitoring Devices Market Volume K Unit Forecast, by Country 2019 & 2032
- Table 47: GCC Home Blood Pressure Monitoring Devices Market Revenue (Million) Forecast, by Application 2019 & 2032
- Table 48: GCC Home Blood Pressure Monitoring Devices Market Volume (K Unit) Forecast, by Application 2019 & 2032
- Table 49: South Africa Home Blood Pressure Monitoring Devices Market Revenue (Million) Forecast, by Application 2019 & 2032
- Table 50: South Africa Home Blood Pressure Monitoring Devices Market Volume (K Unit) Forecast, by Application 2019 & 2032
- Table 51: Rest of Middle East and Africa Home Blood Pressure Monitoring Devices Market Revenue (Million) Forecast, by Application 2019 & 2032
- Table 52: Rest of Middle East and Africa Home Blood Pressure Monitoring Devices Market Volume (K Unit) Forecast, by Application 2019 & 2032
- Table 53: Global Home Blood Pressure Monitoring Devices Market Revenue Million Forecast, by Country 2019 & 2032
- Table 54: Global Home Blood Pressure Monitoring Devices Market Volume K Unit Forecast, by Country 2019 & 2032
- Table 55: Brazil Home Blood Pressure Monitoring Devices Market Revenue (Million) Forecast, by Application 2019 & 2032
- Table 56: Brazil Home Blood Pressure Monitoring Devices Market Volume (K Unit) Forecast, by Application 2019 & 2032
- Table 57: Argentina Home Blood Pressure Monitoring Devices Market Revenue (Million) Forecast, by Application 2019 & 2032
- Table 58: Argentina Home Blood Pressure Monitoring Devices Market Volume (K Unit) Forecast, by Application 2019 & 2032
- Table 59: Rest of South America Home Blood Pressure Monitoring Devices Market Revenue (Million) Forecast, by Application 2019 & 2032
- Table 60: Rest of South America Home Blood Pressure Monitoring Devices Market Volume (K Unit) Forecast, by Application 2019 & 2032
- Table 61: Global Home Blood Pressure Monitoring Devices Market Revenue Million Forecast, by Product 2019 & 2032
- Table 62: Global Home Blood Pressure Monitoring Devices Market Volume K Unit Forecast, by Product 2019 & 2032
- Table 63: Global Home Blood Pressure Monitoring Devices Market Revenue Million Forecast, by Distribution Channel 2019 & 2032
- Table 64: Global Home Blood Pressure Monitoring Devices Market Volume K Unit Forecast, by Distribution Channel 2019 & 2032
- Table 65: Global Home Blood Pressure Monitoring Devices Market Revenue Million Forecast, by Country 2019 & 2032
- Table 66: Global Home Blood Pressure Monitoring Devices Market Volume K Unit Forecast, by Country 2019 & 2032
- Table 67: United States Home Blood Pressure Monitoring Devices Market Revenue (Million) Forecast, by Application 2019 & 2032
- Table 68: United States Home Blood Pressure Monitoring Devices Market Volume (K Unit) Forecast, by Application 2019 & 2032
- Table 69: Canada Home Blood Pressure Monitoring Devices Market Revenue (Million) Forecast, by Application 2019 & 2032
- Table 70: Canada Home Blood Pressure Monitoring Devices Market Volume (K Unit) Forecast, by Application 2019 & 2032
- Table 71: Mexico Home Blood Pressure Monitoring Devices Market Revenue (Million) Forecast, by Application 2019 & 2032
- Table 72: Mexico Home Blood Pressure Monitoring Devices Market Volume (K Unit) Forecast, by Application 2019 & 2032
- Table 73: Global Home Blood Pressure Monitoring Devices Market Revenue Million Forecast, by Product 2019 & 2032
- Table 74: Global Home Blood Pressure Monitoring Devices Market Volume K Unit Forecast, by Product 2019 & 2032
- Table 75: Global Home Blood Pressure Monitoring Devices Market Revenue Million Forecast, by Distribution Channel 2019 & 2032
- Table 76: Global Home Blood Pressure Monitoring Devices Market Volume K Unit Forecast, by Distribution Channel 2019 & 2032
- Table 77: Global Home Blood Pressure Monitoring Devices Market Revenue Million Forecast, by Country 2019 & 2032
- Table 78: Global Home Blood Pressure Monitoring Devices Market Volume K Unit Forecast, by Country 2019 & 2032
- Table 79: Germany Home Blood Pressure Monitoring Devices Market Revenue (Million) Forecast, by Application 2019 & 2032
- Table 80: Germany Home Blood Pressure Monitoring Devices Market Volume (K Unit) Forecast, by Application 2019 & 2032
- Table 81: United Kingdom Home Blood Pressure Monitoring Devices Market Revenue (Million) Forecast, by Application 2019 & 2032
- Table 82: United Kingdom Home Blood Pressure Monitoring Devices Market Volume (K Unit) Forecast, by Application 2019 & 2032
- Table 83: France Home Blood Pressure Monitoring Devices Market Revenue (Million) Forecast, by Application 2019 & 2032
- Table 84: France Home Blood Pressure Monitoring Devices Market Volume (K Unit) Forecast, by Application 2019 & 2032
- Table 85: Italy Home Blood Pressure Monitoring Devices Market Revenue (Million) Forecast, by Application 2019 & 2032
- Table 86: Italy Home Blood Pressure Monitoring Devices Market Volume (K Unit) Forecast, by Application 2019 & 2032
- Table 87: Spain Home Blood Pressure Monitoring Devices Market Revenue (Million) Forecast, by Application 2019 & 2032
- Table 88: Spain Home Blood Pressure Monitoring Devices Market Volume (K Unit) Forecast, by Application 2019 & 2032
- Table 89: Rest of Europe Home Blood Pressure Monitoring Devices Market Revenue (Million) Forecast, by Application 2019 & 2032
- Table 90: Rest of Europe Home Blood Pressure Monitoring Devices Market Volume (K Unit) Forecast, by Application 2019 & 2032
- Table 91: Global Home Blood Pressure Monitoring Devices Market Revenue Million Forecast, by Product 2019 & 2032
- Table 92: Global Home Blood Pressure Monitoring Devices Market Volume K Unit Forecast, by Product 2019 & 2032
- Table 93: Global Home Blood Pressure Monitoring Devices Market Revenue Million Forecast, by Distribution Channel 2019 & 2032
- Table 94: Global Home Blood Pressure Monitoring Devices Market Volume K Unit Forecast, by Distribution Channel 2019 & 2032
- Table 95: Global Home Blood Pressure Monitoring Devices Market Revenue Million Forecast, by Country 2019 & 2032
- Table 96: Global Home Blood Pressure Monitoring Devices Market Volume K Unit Forecast, by Country 2019 & 2032
- Table 97: China Home Blood Pressure Monitoring Devices Market Revenue (Million) Forecast, by Application 2019 & 2032
- Table 98: China Home Blood Pressure Monitoring Devices Market Volume (K Unit) Forecast, by Application 2019 & 2032
- Table 99: Japan Home Blood Pressure Monitoring Devices Market Revenue (Million) Forecast, by Application 2019 & 2032
- Table 100: Japan Home Blood Pressure Monitoring Devices Market Volume (K Unit) Forecast, by Application 2019 & 2032
- Table 101: India Home Blood Pressure Monitoring Devices Market Revenue (Million) Forecast, by Application 2019 & 2032
- Table 102: India Home Blood Pressure Monitoring Devices Market Volume (K Unit) Forecast, by Application 2019 & 2032
- Table 103: Australia Home Blood Pressure Monitoring Devices Market Revenue (Million) Forecast, by Application 2019 & 2032
- Table 104: Australia Home Blood Pressure Monitoring Devices Market Volume (K Unit) Forecast, by Application 2019 & 2032
- Table 105: South Korea Home Blood Pressure Monitoring Devices Market Revenue (Million) Forecast, by Application 2019 & 2032
- Table 106: South Korea Home Blood Pressure Monitoring Devices Market Volume (K Unit) Forecast, by Application 2019 & 2032
- Table 107: Rest of Asia Pacific Home Blood Pressure Monitoring Devices Market Revenue (Million) Forecast, by Application 2019 & 2032
- Table 108: Rest of Asia Pacific Home Blood Pressure Monitoring Devices Market Volume (K Unit) Forecast, by Application 2019 & 2032
- Table 109: Global Home Blood Pressure Monitoring Devices Market Revenue Million Forecast, by Product 2019 & 2032
- Table 110: Global Home Blood Pressure Monitoring Devices Market Volume K Unit Forecast, by Product 2019 & 2032
- Table 111: Global Home Blood Pressure Monitoring Devices Market Revenue Million Forecast, by Distribution Channel 2019 & 2032
- Table 112: Global Home Blood Pressure Monitoring Devices Market Volume K Unit Forecast, by Distribution Channel 2019 & 2032
- Table 113: Global Home Blood Pressure Monitoring Devices Market Revenue Million Forecast, by Country 2019 & 2032
- Table 114: Global Home Blood Pressure Monitoring Devices Market Volume K Unit Forecast, by Country 2019 & 2032
- Table 115: GCC Home Blood Pressure Monitoring Devices Market Revenue (Million) Forecast, by Application 2019 & 2032
- Table 116: GCC Home Blood Pressure Monitoring Devices Market Volume (K Unit) Forecast, by Application 2019 & 2032
- Table 117: South Africa Home Blood Pressure Monitoring Devices Market Revenue (Million) Forecast, by Application 2019 & 2032
- Table 118: South Africa Home Blood Pressure Monitoring Devices Market Volume (K Unit) Forecast, by Application 2019 & 2032
- Table 119: Rest of Middle East and Africa Home Blood Pressure Monitoring Devices Market Revenue (Million) Forecast, by Application 2019 & 2032
- Table 120: Rest of Middle East and Africa Home Blood Pressure Monitoring Devices Market Volume (K Unit) Forecast, by Application 2019 & 2032
- Table 121: Global Home Blood Pressure Monitoring Devices Market Revenue Million Forecast, by Product 2019 & 2032
- Table 122: Global Home Blood Pressure Monitoring Devices Market Volume K Unit Forecast, by Product 2019 & 2032
- Table 123: Global Home Blood Pressure Monitoring Devices Market Revenue Million Forecast, by Distribution Channel 2019 & 2032
- Table 124: Global Home Blood Pressure Monitoring Devices Market Volume K Unit Forecast, by Distribution Channel 2019 & 2032
- Table 125: Global Home Blood Pressure Monitoring Devices Market Revenue Million Forecast, by Country 2019 & 2032
- Table 126: Global Home Blood Pressure Monitoring Devices Market Volume K Unit Forecast, by Country 2019 & 2032
- Table 127: Brazil Home Blood Pressure Monitoring Devices Market Revenue (Million) Forecast, by Application 2019 & 2032
- Table 128: Brazil Home Blood Pressure Monitoring Devices Market Volume (K Unit) Forecast, by Application 2019 & 2032
- Table 129: Argentina Home Blood Pressure Monitoring Devices Market Revenue (Million) Forecast, by Application 2019 & 2032
- Table 130: Argentina Home Blood Pressure Monitoring Devices Market Volume (K Unit) Forecast, by Application 2019 & 2032
- Table 131: Rest of South America Home Blood Pressure Monitoring Devices Market Revenue (Million) Forecast, by Application 2019 & 2032
- Table 132: Rest of South America Home Blood Pressure Monitoring Devices Market Volume (K Unit) Forecast, by Application 2019 & 2032
Frequently Asked Questions
1. What is the projected Compound Annual Growth Rate (CAGR) of the Home Blood Pressure Monitoring Devices Market?
The projected CAGR is approximately 10.54%.
2. Which companies are prominent players in the Home Blood Pressure Monitoring Devices Market?
Key companies in the market include Rossmax International Ltd, Qardio Inc, GE Healthcare, Halma plc, Koninklijke Philips N V, Spengler SAS, A&D Medical, Contec Medical, Omron Healthcare Inc, Welch Allyn Inc, Beurer GmbH, American Diagnostic Corporation.
3. What are the main segments of the Home Blood Pressure Monitoring Devices Market?
The market segments include Product, Distribution Channel.
4. Can you provide details about the market size?
The market size is estimated to be USD 1.25 Million as of 2022.
5. What are some drivers contributing to market growth?
Growing Burden of Blood Pressure-Related Diseases; Rise in the Use of Home Blood Pressure Monitors and Active Promotions; Advancements in the Devices.
6. What are the notable trends driving market growth?
Wrist Monitors Segment is Dominating the Home Blood Pressure Monitoring Devices Market.
7. Are there any restraints impacting market growth?
High Cost and Accuracy of Devices.
8. Can you provide examples of recent developments in the market?
July 2022: LiveMetric launched LiveOne, a nano-sensor technology for monitoring blood pressure every 10 seconds. LiveOne is a wrist-worn, cuff-free solution that gives real-time measurements for better care and management of people with hypertension and cardiovascular disorders.
9. What pricing options are available for accessing the report?
Pricing options include single-user, multi-user, and enterprise licenses priced at USD 4750, USD 5250, and USD 8750 respectively.
10. Is the market size provided in terms of value or volume?
The market size is provided in terms of value, measured in Million and volume, measured in K Unit.
11. Are there any specific market keywords associated with the report?
Yes, the market keyword associated with the report is "Home Blood Pressure Monitoring Devices Market," which aids in identifying and referencing the specific market segment covered.
12. How do I determine which pricing option suits my needs best?
The pricing options vary based on user requirements and access needs. Individual users may opt for single-user licenses, while businesses requiring broader access may choose multi-user or enterprise licenses for cost-effective access to the report.
13. Are there any additional resources or data provided in the Home Blood Pressure Monitoring Devices Market report?
While the report offers comprehensive insights, it's advisable to review the specific contents or supplementary materials provided to ascertain if additional resources or data are available.
14. How can I stay updated on further developments or reports in the Home Blood Pressure Monitoring Devices Market?
To stay informed about further developments, trends, and reports in the Home Blood Pressure Monitoring Devices Market, consider subscribing to industry newsletters, following relevant companies and organizations, or regularly checking reputable industry news sources and publications.
Methodology
Step 1 - Identification of Relevant Samples Size from Population Database


Step 2 - Approaches for Defining Global Market Size (Value, Volume* & Price*)

Note*: In applicable scenarios
Step 3 - Data Sources
Primary Research
- Web Analytics
- Survey Reports
- Research Institute
- Latest Research Reports
- Opinion Leaders
Secondary Research
- Annual Reports
- White Paper
- Latest Press Release
- Industry Association
- Paid Database
- Investor Presentations

Step 4 - Data Triangulation
Involves using different sources of information in order to increase the validity of a study
These sources are likely to be stakeholders in a program - participants, other researchers, program staff, other community members, and so on.
Then we put all data in single framework & apply various statistical tools to find out the dynamic on the market.
During the analysis stage, feedback from the stakeholder groups would be compared to determine areas of agreement as well as areas of divergence
