

Key Insights
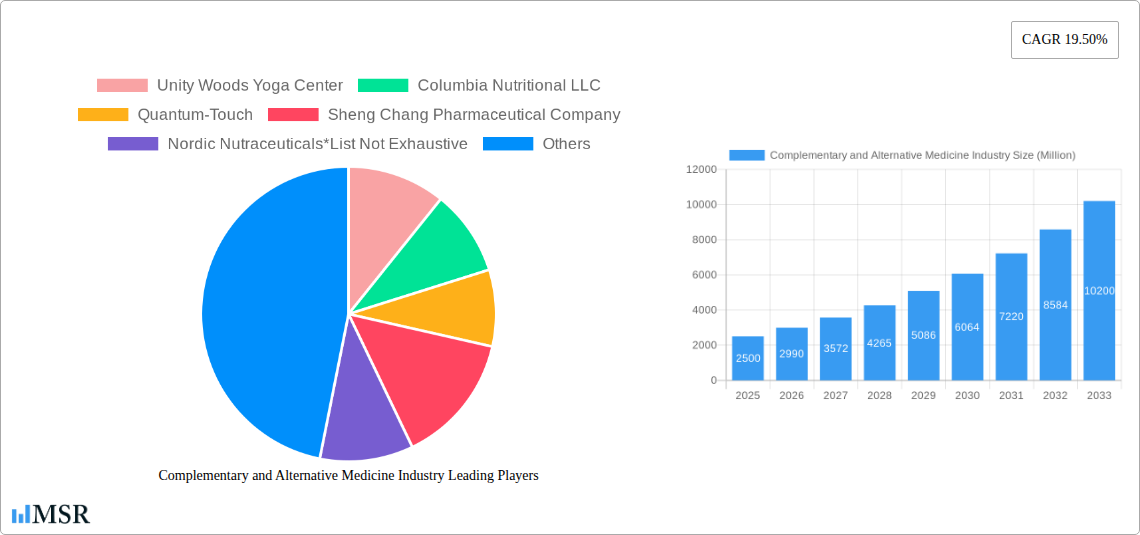
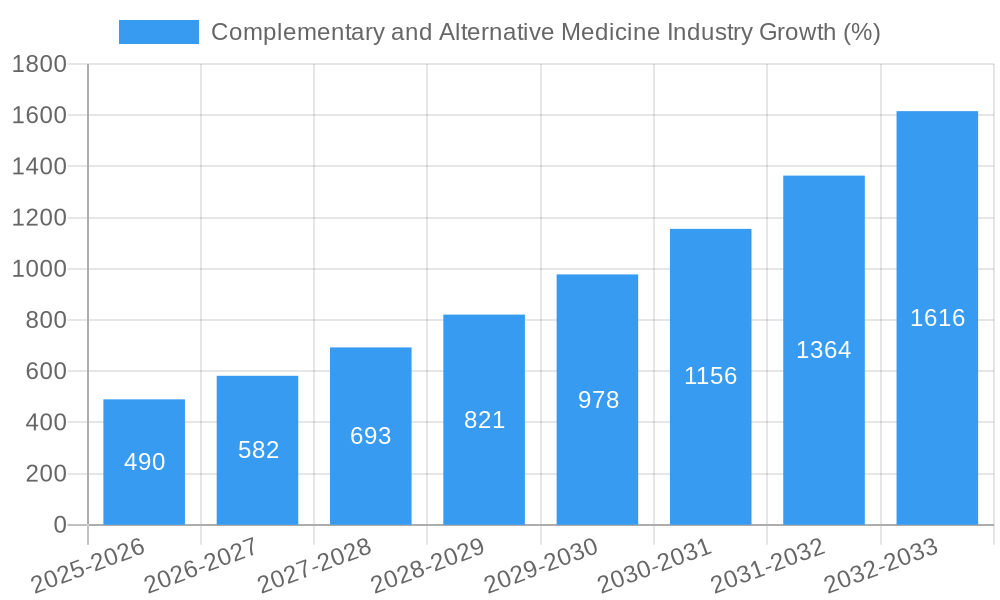
The Complementary and Alternative Medicine (CAM) industry is experiencing robust growth, projected to reach a substantial market size with a Compound Annual Growth Rate (CAGR) of 19.50% from 2025 to 2033. This expansion is fueled by several key drivers, including a rising global prevalence of chronic diseases like arthritis, cancer, and diabetes, for which CAM therapies offer complementary or alternative treatment options. Increased consumer awareness of the potential benefits of holistic wellness approaches, coupled with a growing dissatisfaction with conventional medicine's limitations in addressing chronic pain and mental health issues, are further propelling market growth. The rise of online platforms and direct-to-consumer sales channels has broadened access to a wider range of CAM products and services, further stimulating market expansion. However, regulatory hurdles, varying levels of scientific evidence supporting certain therapies, and inconsistent reimbursement policies from insurance providers pose challenges to sustained market growth.
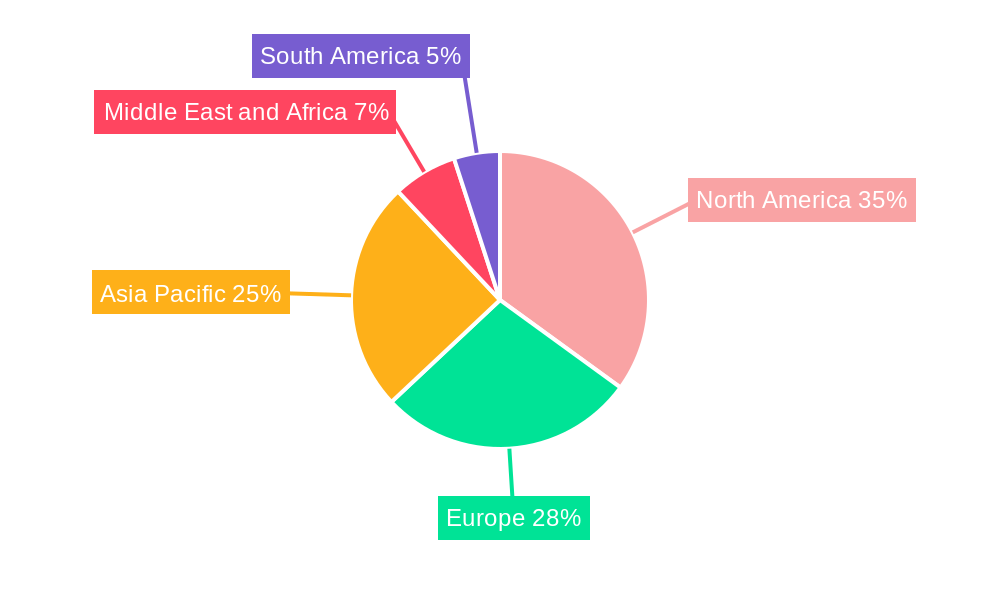
Segmentation analysis reveals significant opportunities across various applications (arthritis, cancer, diabetes, cardiovascular health, neurology, and other applications), distribution channels (direct sales, online sales, distance correspondence), and types of therapies (traditional alternative therapeutics, body therapy, mind therapy, sensory therapy, and others). The geographical landscape is diverse, with North America, Europe, and the Asia-Pacific region representing significant market shares. North America, driven by high healthcare expenditure and a substantial adoption rate of CAM therapies, is expected to maintain a leading position. However, rapidly growing economies in the Asia-Pacific region, particularly in countries like China and India, present substantial growth potential due to increasing disposable incomes and a growing awareness of CAM practices. The burgeoning market is attracting both established players and new entrants, leading to heightened competition and innovation within the industry.
Complementary and Alternative Medicine (CAM) Industry Market Report: 2019-2033
This comprehensive report provides a detailed analysis of the Complementary and Alternative Medicine (CAM) industry, offering invaluable insights for stakeholders, investors, and businesses operating within this dynamic sector. The report covers the period from 2019 to 2033, with a focus on the 2025-2033 forecast period. The global CAM market is estimated to be worth $XX Million in 2025, exhibiting a CAGR of XX% during the forecast period. This in-depth analysis covers key segments, leading players, and emerging trends shaping the future of CAM.
Complementary and Alternative Medicine Industry Market Concentration & Dynamics
The CAM industry is characterized by a fragmented landscape with a multitude of players ranging from small independent practitioners to large multinational corporations. Market share is dispersed, with no single entity dominating. However, significant consolidation is expected through mergers and acquisitions (M&A) in the coming years. In the historical period (2019-2024), approximately XX M&A deals were recorded, indicating a moderate level of consolidation. This trend is projected to accelerate during the forecast period driven by the pursuit of economies of scale and expansion into new therapeutic areas.
The industry's innovation ecosystem is robust, with continuous development of new therapies, products, and delivery models. Regulatory frameworks vary significantly across geographical regions, creating both challenges and opportunities for businesses. Substitute products exist within conventional medicine, but the growing consumer preference for holistic and personalized healthcare fuels the CAM market's expansion. End-user trends show increasing demand for integrative approaches that blend conventional and complementary therapies, creating new market niches.
Complementary and Alternative Medicine Industry Industry Insights & Trends
The CAM market's growth is propelled by several factors, including rising healthcare costs, increasing prevalence of chronic diseases, and a growing consumer awareness of the benefits of holistic wellness. The global market size is projected to reach $XX Million by 2033, driven by a compound annual growth rate (CAGR) of XX%. Technological advancements such as telehealth platforms and digital therapeutics are significantly impacting the delivery and accessibility of CAM services, expanding the reach beyond traditional geographical limitations. Evolving consumer behavior reveals a preference for personalized and preventative healthcare, boosting the demand for customized CAM interventions and wellness programs. This shift towards proactive healthcare management underscores the long-term growth potential of the CAM industry.
Key Markets & Segments Leading Complementary and Alternative Medicine Industry
The CAM market exhibits diverse segmentation by application, distribution channel, and type of therapy.
By Application:
- Dominant Segment: Arthritis and other musculoskeletal disorders represent a substantial segment, driven by the prevalence of these conditions and the efficacy of certain CAM therapies in pain management and functional improvement. Other significant application areas include cancer supportive care, diabetes management, and cardiovascular health.
- Growth Drivers: Increased awareness of chronic disease management coupled with unmet needs in conventional medicine fuels demand across various applications.
By Distribution Channel:
- Dominant Channel: Direct sales through practitioners and clinics remain a significant channel. However, online sales are witnessing rapid growth, driven by increased internet penetration and consumer comfort with e-commerce. Distance correspondence via telehealth and online consultations is also gaining traction.
- Growth Drivers: E-commerce advancements enhance accessibility, while telehealth addresses geographical barriers and increases convenience.
By Type:
- Dominant Type: Traditional alternative therapeutics, such as herbal medicine and acupuncture, are deeply rooted in cultural practices and enjoy widespread acceptance. Body therapies like massage and yoga are also highly popular. Mind therapies, including meditation and mindfulness practices, are rapidly gaining mainstream appeal. Sensory therapies like aromatherapy are emerging as niche segments.
- Growth Drivers: Cultural acceptance, combined with evidence-based research and growing awareness of mental and emotional well-being, drive the growth of various therapy types.
Dominant Regions: North America and Europe currently lead the CAM market due to high healthcare expenditure, robust regulatory frameworks, and high consumer awareness. However, Asia-Pacific is expected to witness significant growth in the forecast period, driven by rising disposable incomes and increased awareness of CAM practices within these regions.
Complementary and Alternative Medicine Industry Product Developments
Recent product innovations demonstrate the industry's dynamism. For example, the launch of Adoratherapy's Alkemie Chakra Healing collection in December 2022 showcased the integration of aromatherapy with traditional healing principles. This exemplifies the ongoing trend of blending traditional practices with modern product formulations to cater to evolving consumer preferences and enhance therapeutic efficacy. Further innovations include technological advancements in delivery systems, personalized treatment plans based on genomic data, and digital tools for enhancing patient engagement and adherence to CAM interventions. These developments create competitive advantages through enhanced convenience and efficacy.
Challenges in the Complementary and Alternative Medicine Industry Market
The CAM industry faces challenges, including stringent regulatory hurdles that vary widely across jurisdictions, causing delays and increasing compliance costs. Supply chain disruptions can impact the availability of raw materials, particularly for herbal remedies. Moreover, intense competition from established pharmaceutical companies and the emergence of new players necessitate ongoing innovation and differentiation to maintain market share. These factors collectively impact profitability and sustainable market growth.
Forces Driving Complementary and Alternative Medicine Industry Growth
The CAM industry's growth is driven by several factors, including rising consumer demand for personalized and preventative healthcare, technological advancements enhancing accessibility and efficacy, favorable regulatory environments in certain regions encouraging innovation, and increasing integration of CAM into mainstream healthcare systems. The rising prevalence of chronic diseases further fuels demand for effective and less-invasive therapeutic alternatives.
Challenges in the Complementary and Alternative Medicine Industry Market
Long-term growth hinges on overcoming regulatory barriers, fostering collaboration between CAM and conventional healthcare practitioners, investing in research and development to establish evidence-based efficacy, and strategically expanding into new geographic markets and therapeutic areas. Partnerships between large corporations and smaller CAM businesses can facilitate resource sharing and market penetration.
Emerging Opportunities in Complementary and Alternative Medicine Industry
Emerging opportunities include expanding into underserved markets, developing innovative digital health solutions, capitalizing on the growing demand for personalized wellness programs, integrating CAM into corporate wellness initiatives, and exploring new therapeutic applications, such as the use of CAM in mental health and chronic pain management. The integration of AI and big data analysis can personalize interventions and enhance treatment outcomes.
Leading Players in the Complementary and Alternative Medicine Industry Sector
- Unity Woods Yoga Center
- Columbia Nutritional LLC
- Quantum-Touch
- Sheng Chang Pharmaceutical Company
- Nordic Nutraceuticals
- Ramamani Iyengar Memorial Yoga Institute
- Pure encapsulations LLC
- Herb Pharm
- Yoga Tree Studios Inc
- John Schumacher Unity Woods Yoga Centre
- Healing Company Ltd
- Ayush Ayurvedic Pte Ltd
Key Milestones in Complementary and Alternative Medicine Industry Industry
- December 2022: Adoratherapy launched its Alkemie Chakra Healing collection, expanding the aromatherapy market and enhancing consumer access to holistic healing products.
- October 2022: Coworth Park launched a new Hebridean sound treatment, demonstrating the growing interest in sound therapy as a relaxation and wellness technique.
Strategic Outlook for Complementary and Alternative Medicine Industry Market
The future of the CAM industry is promising, with significant growth potential driven by continuous innovation, increased consumer awareness, and the integration of CAM into mainstream healthcare systems. Strategic opportunities include focusing on personalized medicine, expanding into emerging markets, and leveraging technological advancements to improve accessibility and effectiveness of CAM therapies. The market's future depends heavily on effective regulatory frameworks that balance innovation with safety, fostering sustainable growth and market expansion.
Complementary and Alternative Medicine Industry Segmentation
-
1. Type
- 1.1. Traditional Alternative Therapeutics
- 1.2. Body Therapy
- 1.3. Mind Therapy
- 1.4. Sensory Therapy
- 1.5. Other Types
-
2. Application
- 2.1. Arthritis
- 2.2. Cancer
- 2.3. Diabetes
- 2.4. Cardiovascular
- 2.5. Neurlogy
- 2.6. Other Applications
-
3. Distribution Channel
- 3.1. Direct Sales
- 3.2. Online Sales
- 3.3. Distance Correspondance
Complementary and Alternative Medicine Industry Segmentation By Geography
-
1. North America
- 1.1. United States
- 1.2. Canada
- 1.3. Mexico
-
2. Europe
- 2.1. Germany
- 2.2. United Kingdom
- 2.3. France
- 2.4. Italy
- 2.5. Spain
- 2.6. Rest of Europe
-
3. Asia Pacific
- 3.1. China
- 3.2. Japan
- 3.3. India
- 3.4. Australia
- 3.5. South Korea
- 3.6. Rest of Asia Pacific
-
4. Middle East and Africa
- 4.1. GCC
- 4.2. South Africa
- 4.3. Rest of Middle East and Africa
-
5. South America
- 5.1. Brazil
- 5.2. Argentina
- 5.3. Rest of South America
Complementary and Alternative Medicine Industry REPORT HIGHLIGHTS
| Aspects | Details |
|---|---|
| Study Period | 2019-2033 |
| Base Year | 2024 |
| Estimated Year | 2025 |
| Forecast Period | 2025-2033 |
| Historical Period | 2019-2024 |
| Growth Rate | CAGR of 19.50% from 2019-2033 |
| Segmentation |
|
Table of Contents
- 1. Introduction
- 1.1. Research Scope
- 1.2. Market Segmentation
- 1.3. Research Methodology
- 1.4. Definitions and Assumptions
- 2. Executive Summary
- 2.1. Introduction
- 3. Market Dynamics
- 3.1. Introduction
- 3.2. Market Drivers
- 3.2.1. Increasing Awareness About the Benefits of Complementary and Alternative Medicines; Growing Government Initiative and Growing Acceptance
- 3.3. Market Restrains
- 3.3.1. Lack of Proper Scientific Evidence and Less Understanding About Alternative Medicine
- 3.4. Market Trends
- 3.4.1. Cancer Is Expected to Hold a Significant Share Over the Forecast Period
- 4. Market Factor Analysis
- 4.1. Porters Five Forces
- 4.2. Supply/Value Chain
- 4.3. PESTEL analysis
- 4.4. Market Entropy
- 4.5. Patent/Trademark Analysis
- 5. Global Complementary and Alternative Medicine Industry Analysis, Insights and Forecast, 2019-2031
- 5.1. Market Analysis, Insights and Forecast - by Type
- 5.1.1. Traditional Alternative Therapeutics
- 5.1.2. Body Therapy
- 5.1.3. Mind Therapy
- 5.1.4. Sensory Therapy
- 5.1.5. Other Types
- 5.2. Market Analysis, Insights and Forecast - by Application
- 5.2.1. Arthritis
- 5.2.2. Cancer
- 5.2.3. Diabetes
- 5.2.4. Cardiovascular
- 5.2.5. Neurlogy
- 5.2.6. Other Applications
- 5.3. Market Analysis, Insights and Forecast - by Distribution Channel
- 5.3.1. Direct Sales
- 5.3.2. Online Sales
- 5.3.3. Distance Correspondance
- 5.4. Market Analysis, Insights and Forecast - by Region
- 5.4.1. North America
- 5.4.2. Europe
- 5.4.3. Asia Pacific
- 5.4.4. Middle East and Africa
- 5.4.5. South America
- 5.1. Market Analysis, Insights and Forecast - by Type
- 6. North America Complementary and Alternative Medicine Industry Analysis, Insights and Forecast, 2019-2031
- 6.1. Market Analysis, Insights and Forecast - by Type
- 6.1.1. Traditional Alternative Therapeutics
- 6.1.2. Body Therapy
- 6.1.3. Mind Therapy
- 6.1.4. Sensory Therapy
- 6.1.5. Other Types
- 6.2. Market Analysis, Insights and Forecast - by Application
- 6.2.1. Arthritis
- 6.2.2. Cancer
- 6.2.3. Diabetes
- 6.2.4. Cardiovascular
- 6.2.5. Neurlogy
- 6.2.6. Other Applications
- 6.3. Market Analysis, Insights and Forecast - by Distribution Channel
- 6.3.1. Direct Sales
- 6.3.2. Online Sales
- 6.3.3. Distance Correspondance
- 6.1. Market Analysis, Insights and Forecast - by Type
- 7. Europe Complementary and Alternative Medicine Industry Analysis, Insights and Forecast, 2019-2031
- 7.1. Market Analysis, Insights and Forecast - by Type
- 7.1.1. Traditional Alternative Therapeutics
- 7.1.2. Body Therapy
- 7.1.3. Mind Therapy
- 7.1.4. Sensory Therapy
- 7.1.5. Other Types
- 7.2. Market Analysis, Insights and Forecast - by Application
- 7.2.1. Arthritis
- 7.2.2. Cancer
- 7.2.3. Diabetes
- 7.2.4. Cardiovascular
- 7.2.5. Neurlogy
- 7.2.6. Other Applications
- 7.3. Market Analysis, Insights and Forecast - by Distribution Channel
- 7.3.1. Direct Sales
- 7.3.2. Online Sales
- 7.3.3. Distance Correspondance
- 7.1. Market Analysis, Insights and Forecast - by Type
- 8. Asia Pacific Complementary and Alternative Medicine Industry Analysis, Insights and Forecast, 2019-2031
- 8.1. Market Analysis, Insights and Forecast - by Type
- 8.1.1. Traditional Alternative Therapeutics
- 8.1.2. Body Therapy
- 8.1.3. Mind Therapy
- 8.1.4. Sensory Therapy
- 8.1.5. Other Types
- 8.2. Market Analysis, Insights and Forecast - by Application
- 8.2.1. Arthritis
- 8.2.2. Cancer
- 8.2.3. Diabetes
- 8.2.4. Cardiovascular
- 8.2.5. Neurlogy
- 8.2.6. Other Applications
- 8.3. Market Analysis, Insights and Forecast - by Distribution Channel
- 8.3.1. Direct Sales
- 8.3.2. Online Sales
- 8.3.3. Distance Correspondance
- 8.1. Market Analysis, Insights and Forecast - by Type
- 9. Middle East and Africa Complementary and Alternative Medicine Industry Analysis, Insights and Forecast, 2019-2031
- 9.1. Market Analysis, Insights and Forecast - by Type
- 9.1.1. Traditional Alternative Therapeutics
- 9.1.2. Body Therapy
- 9.1.3. Mind Therapy
- 9.1.4. Sensory Therapy
- 9.1.5. Other Types
- 9.2. Market Analysis, Insights and Forecast - by Application
- 9.2.1. Arthritis
- 9.2.2. Cancer
- 9.2.3. Diabetes
- 9.2.4. Cardiovascular
- 9.2.5. Neurlogy
- 9.2.6. Other Applications
- 9.3. Market Analysis, Insights and Forecast - by Distribution Channel
- 9.3.1. Direct Sales
- 9.3.2. Online Sales
- 9.3.3. Distance Correspondance
- 9.1. Market Analysis, Insights and Forecast - by Type
- 10. South America Complementary and Alternative Medicine Industry Analysis, Insights and Forecast, 2019-2031
- 10.1. Market Analysis, Insights and Forecast - by Type
- 10.1.1. Traditional Alternative Therapeutics
- 10.1.2. Body Therapy
- 10.1.3. Mind Therapy
- 10.1.4. Sensory Therapy
- 10.1.5. Other Types
- 10.2. Market Analysis, Insights and Forecast - by Application
- 10.2.1. Arthritis
- 10.2.2. Cancer
- 10.2.3. Diabetes
- 10.2.4. Cardiovascular
- 10.2.5. Neurlogy
- 10.2.6. Other Applications
- 10.3. Market Analysis, Insights and Forecast - by Distribution Channel
- 10.3.1. Direct Sales
- 10.3.2. Online Sales
- 10.3.3. Distance Correspondance
- 10.1. Market Analysis, Insights and Forecast - by Type
- 11. North America Complementary and Alternative Medicine Industry Analysis, Insights and Forecast, 2019-2031
- 11.1. Market Analysis, Insights and Forecast - By Country/Sub-region
- 11.1.1 United States
- 11.1.2 Canada
- 11.1.3 Mexico
- 12. Europe Complementary and Alternative Medicine Industry Analysis, Insights and Forecast, 2019-2031
- 12.1. Market Analysis, Insights and Forecast - By Country/Sub-region
- 12.1.1 Germany
- 12.1.2 United Kingdom
- 12.1.3 France
- 12.1.4 Italy
- 12.1.5 Spain
- 12.1.6 Rest of Europe
- 13. Asia Pacific Complementary and Alternative Medicine Industry Analysis, Insights and Forecast, 2019-2031
- 13.1. Market Analysis, Insights and Forecast - By Country/Sub-region
- 13.1.1 China
- 13.1.2 Japan
- 13.1.3 India
- 13.1.4 Australia
- 13.1.5 South Korea
- 13.1.6 Rest of Asia Pacific
- 14. Middle East and Africa Complementary and Alternative Medicine Industry Analysis, Insights and Forecast, 2019-2031
- 14.1. Market Analysis, Insights and Forecast - By Country/Sub-region
- 14.1.1 GCC
- 14.1.2 South Africa
- 14.1.3 Rest of Middle East and Africa
- 15. South America Complementary and Alternative Medicine Industry Analysis, Insights and Forecast, 2019-2031
- 15.1. Market Analysis, Insights and Forecast - By Country/Sub-region
- 15.1.1 Brazil
- 15.1.2 Argentina
- 15.1.3 Rest of South America
- 16. Competitive Analysis
- 16.1. Global Market Share Analysis 2024
- 16.2. Company Profiles
- 16.2.1 Unity Woods Yoga Center
- 16.2.1.1. Overview
- 16.2.1.2. Products
- 16.2.1.3. SWOT Analysis
- 16.2.1.4. Recent Developments
- 16.2.1.5. Financials (Based on Availability)
- 16.2.2 Columbia Nutritional LLC
- 16.2.2.1. Overview
- 16.2.2.2. Products
- 16.2.2.3. SWOT Analysis
- 16.2.2.4. Recent Developments
- 16.2.2.5. Financials (Based on Availability)
- 16.2.3 Quantum-Touch
- 16.2.3.1. Overview
- 16.2.3.2. Products
- 16.2.3.3. SWOT Analysis
- 16.2.3.4. Recent Developments
- 16.2.3.5. Financials (Based on Availability)
- 16.2.4 Sheng Chang Pharmaceutical Company
- 16.2.4.1. Overview
- 16.2.4.2. Products
- 16.2.4.3. SWOT Analysis
- 16.2.4.4. Recent Developments
- 16.2.4.5. Financials (Based on Availability)
- 16.2.5 Nordic Nutraceuticals*List Not Exhaustive
- 16.2.5.1. Overview
- 16.2.5.2. Products
- 16.2.5.3. SWOT Analysis
- 16.2.5.4. Recent Developments
- 16.2.5.5. Financials (Based on Availability)
- 16.2.6 Ramamani Iyengar Memorial Yoga Institute
- 16.2.6.1. Overview
- 16.2.6.2. Products
- 16.2.6.3. SWOT Analysis
- 16.2.6.4. Recent Developments
- 16.2.6.5. Financials (Based on Availability)
- 16.2.7 Pure encapsulations LLC
- 16.2.7.1. Overview
- 16.2.7.2. Products
- 16.2.7.3. SWOT Analysis
- 16.2.7.4. Recent Developments
- 16.2.7.5. Financials (Based on Availability)
- 16.2.8 Herb Pharm
- 16.2.8.1. Overview
- 16.2.8.2. Products
- 16.2.8.3. SWOT Analysis
- 16.2.8.4. Recent Developments
- 16.2.8.5. Financials (Based on Availability)
- 16.2.9 Yoga Tree Studios Inc
- 16.2.9.1. Overview
- 16.2.9.2. Products
- 16.2.9.3. SWOT Analysis
- 16.2.9.4. Recent Developments
- 16.2.9.5. Financials (Based on Availability)
- 16.2.10 John Schumacher Unity Woods Yoga Centre
- 16.2.10.1. Overview
- 16.2.10.2. Products
- 16.2.10.3. SWOT Analysis
- 16.2.10.4. Recent Developments
- 16.2.10.5. Financials (Based on Availability)
- 16.2.11 Healing Company Ltd
- 16.2.11.1. Overview
- 16.2.11.2. Products
- 16.2.11.3. SWOT Analysis
- 16.2.11.4. Recent Developments
- 16.2.11.5. Financials (Based on Availability)
- 16.2.12 Ayush Ayurvedic Pte Ltd
- 16.2.12.1. Overview
- 16.2.12.2. Products
- 16.2.12.3. SWOT Analysis
- 16.2.12.4. Recent Developments
- 16.2.12.5. Financials (Based on Availability)
- 16.2.1 Unity Woods Yoga Center
List of Figures
- Figure 1: Global Complementary and Alternative Medicine Industry Revenue Breakdown (Million, %) by Region 2024 & 2032
- Figure 2: North America Complementary and Alternative Medicine Industry Revenue (Million), by Country 2024 & 2032
- Figure 3: North America Complementary and Alternative Medicine Industry Revenue Share (%), by Country 2024 & 2032
- Figure 4: Europe Complementary and Alternative Medicine Industry Revenue (Million), by Country 2024 & 2032
- Figure 5: Europe Complementary and Alternative Medicine Industry Revenue Share (%), by Country 2024 & 2032
- Figure 6: Asia Pacific Complementary and Alternative Medicine Industry Revenue (Million), by Country 2024 & 2032
- Figure 7: Asia Pacific Complementary and Alternative Medicine Industry Revenue Share (%), by Country 2024 & 2032
- Figure 8: Middle East and Africa Complementary and Alternative Medicine Industry Revenue (Million), by Country 2024 & 2032
- Figure 9: Middle East and Africa Complementary and Alternative Medicine Industry Revenue Share (%), by Country 2024 & 2032
- Figure 10: South America Complementary and Alternative Medicine Industry Revenue (Million), by Country 2024 & 2032
- Figure 11: South America Complementary and Alternative Medicine Industry Revenue Share (%), by Country 2024 & 2032
- Figure 12: North America Complementary and Alternative Medicine Industry Revenue (Million), by Type 2024 & 2032
- Figure 13: North America Complementary and Alternative Medicine Industry Revenue Share (%), by Type 2024 & 2032
- Figure 14: North America Complementary and Alternative Medicine Industry Revenue (Million), by Application 2024 & 2032
- Figure 15: North America Complementary and Alternative Medicine Industry Revenue Share (%), by Application 2024 & 2032
- Figure 16: North America Complementary and Alternative Medicine Industry Revenue (Million), by Distribution Channel 2024 & 2032
- Figure 17: North America Complementary and Alternative Medicine Industry Revenue Share (%), by Distribution Channel 2024 & 2032
- Figure 18: North America Complementary and Alternative Medicine Industry Revenue (Million), by Country 2024 & 2032
- Figure 19: North America Complementary and Alternative Medicine Industry Revenue Share (%), by Country 2024 & 2032
- Figure 20: Europe Complementary and Alternative Medicine Industry Revenue (Million), by Type 2024 & 2032
- Figure 21: Europe Complementary and Alternative Medicine Industry Revenue Share (%), by Type 2024 & 2032
- Figure 22: Europe Complementary and Alternative Medicine Industry Revenue (Million), by Application 2024 & 2032
- Figure 23: Europe Complementary and Alternative Medicine Industry Revenue Share (%), by Application 2024 & 2032
- Figure 24: Europe Complementary and Alternative Medicine Industry Revenue (Million), by Distribution Channel 2024 & 2032
- Figure 25: Europe Complementary and Alternative Medicine Industry Revenue Share (%), by Distribution Channel 2024 & 2032
- Figure 26: Europe Complementary and Alternative Medicine Industry Revenue (Million), by Country 2024 & 2032
- Figure 27: Europe Complementary and Alternative Medicine Industry Revenue Share (%), by Country 2024 & 2032
- Figure 28: Asia Pacific Complementary and Alternative Medicine Industry Revenue (Million), by Type 2024 & 2032
- Figure 29: Asia Pacific Complementary and Alternative Medicine Industry Revenue Share (%), by Type 2024 & 2032
- Figure 30: Asia Pacific Complementary and Alternative Medicine Industry Revenue (Million), by Application 2024 & 2032
- Figure 31: Asia Pacific Complementary and Alternative Medicine Industry Revenue Share (%), by Application 2024 & 2032
- Figure 32: Asia Pacific Complementary and Alternative Medicine Industry Revenue (Million), by Distribution Channel 2024 & 2032
- Figure 33: Asia Pacific Complementary and Alternative Medicine Industry Revenue Share (%), by Distribution Channel 2024 & 2032
- Figure 34: Asia Pacific Complementary and Alternative Medicine Industry Revenue (Million), by Country 2024 & 2032
- Figure 35: Asia Pacific Complementary and Alternative Medicine Industry Revenue Share (%), by Country 2024 & 2032
- Figure 36: Middle East and Africa Complementary and Alternative Medicine Industry Revenue (Million), by Type 2024 & 2032
- Figure 37: Middle East and Africa Complementary and Alternative Medicine Industry Revenue Share (%), by Type 2024 & 2032
- Figure 38: Middle East and Africa Complementary and Alternative Medicine Industry Revenue (Million), by Application 2024 & 2032
- Figure 39: Middle East and Africa Complementary and Alternative Medicine Industry Revenue Share (%), by Application 2024 & 2032
- Figure 40: Middle East and Africa Complementary and Alternative Medicine Industry Revenue (Million), by Distribution Channel 2024 & 2032
- Figure 41: Middle East and Africa Complementary and Alternative Medicine Industry Revenue Share (%), by Distribution Channel 2024 & 2032
- Figure 42: Middle East and Africa Complementary and Alternative Medicine Industry Revenue (Million), by Country 2024 & 2032
- Figure 43: Middle East and Africa Complementary and Alternative Medicine Industry Revenue Share (%), by Country 2024 & 2032
- Figure 44: South America Complementary and Alternative Medicine Industry Revenue (Million), by Type 2024 & 2032
- Figure 45: South America Complementary and Alternative Medicine Industry Revenue Share (%), by Type 2024 & 2032
- Figure 46: South America Complementary and Alternative Medicine Industry Revenue (Million), by Application 2024 & 2032
- Figure 47: South America Complementary and Alternative Medicine Industry Revenue Share (%), by Application 2024 & 2032
- Figure 48: South America Complementary and Alternative Medicine Industry Revenue (Million), by Distribution Channel 2024 & 2032
- Figure 49: South America Complementary and Alternative Medicine Industry Revenue Share (%), by Distribution Channel 2024 & 2032
- Figure 50: South America Complementary and Alternative Medicine Industry Revenue (Million), by Country 2024 & 2032
- Figure 51: South America Complementary and Alternative Medicine Industry Revenue Share (%), by Country 2024 & 2032
List of Tables
- Table 1: Global Complementary and Alternative Medicine Industry Revenue Million Forecast, by Region 2019 & 2032
- Table 2: Global Complementary and Alternative Medicine Industry Revenue Million Forecast, by Type 2019 & 2032
- Table 3: Global Complementary and Alternative Medicine Industry Revenue Million Forecast, by Application 2019 & 2032
- Table 4: Global Complementary and Alternative Medicine Industry Revenue Million Forecast, by Distribution Channel 2019 & 2032
- Table 5: Global Complementary and Alternative Medicine Industry Revenue Million Forecast, by Region 2019 & 2032
- Table 6: Global Complementary and Alternative Medicine Industry Revenue Million Forecast, by Country 2019 & 2032
- Table 7: United States Complementary and Alternative Medicine Industry Revenue (Million) Forecast, by Application 2019 & 2032
- Table 8: Canada Complementary and Alternative Medicine Industry Revenue (Million) Forecast, by Application 2019 & 2032
- Table 9: Mexico Complementary and Alternative Medicine Industry Revenue (Million) Forecast, by Application 2019 & 2032
- Table 10: Global Complementary and Alternative Medicine Industry Revenue Million Forecast, by Country 2019 & 2032
- Table 11: Germany Complementary and Alternative Medicine Industry Revenue (Million) Forecast, by Application 2019 & 2032
- Table 12: United Kingdom Complementary and Alternative Medicine Industry Revenue (Million) Forecast, by Application 2019 & 2032
- Table 13: France Complementary and Alternative Medicine Industry Revenue (Million) Forecast, by Application 2019 & 2032
- Table 14: Italy Complementary and Alternative Medicine Industry Revenue (Million) Forecast, by Application 2019 & 2032
- Table 15: Spain Complementary and Alternative Medicine Industry Revenue (Million) Forecast, by Application 2019 & 2032
- Table 16: Rest of Europe Complementary and Alternative Medicine Industry Revenue (Million) Forecast, by Application 2019 & 2032
- Table 17: Global Complementary and Alternative Medicine Industry Revenue Million Forecast, by Country 2019 & 2032
- Table 18: China Complementary and Alternative Medicine Industry Revenue (Million) Forecast, by Application 2019 & 2032
- Table 19: Japan Complementary and Alternative Medicine Industry Revenue (Million) Forecast, by Application 2019 & 2032
- Table 20: India Complementary and Alternative Medicine Industry Revenue (Million) Forecast, by Application 2019 & 2032
- Table 21: Australia Complementary and Alternative Medicine Industry Revenue (Million) Forecast, by Application 2019 & 2032
- Table 22: South Korea Complementary and Alternative Medicine Industry Revenue (Million) Forecast, by Application 2019 & 2032
- Table 23: Rest of Asia Pacific Complementary and Alternative Medicine Industry Revenue (Million) Forecast, by Application 2019 & 2032
- Table 24: Global Complementary and Alternative Medicine Industry Revenue Million Forecast, by Country 2019 & 2032
- Table 25: GCC Complementary and Alternative Medicine Industry Revenue (Million) Forecast, by Application 2019 & 2032
- Table 26: South Africa Complementary and Alternative Medicine Industry Revenue (Million) Forecast, by Application 2019 & 2032
- Table 27: Rest of Middle East and Africa Complementary and Alternative Medicine Industry Revenue (Million) Forecast, by Application 2019 & 2032
- Table 28: Global Complementary and Alternative Medicine Industry Revenue Million Forecast, by Country 2019 & 2032
- Table 29: Brazil Complementary and Alternative Medicine Industry Revenue (Million) Forecast, by Application 2019 & 2032
- Table 30: Argentina Complementary and Alternative Medicine Industry Revenue (Million) Forecast, by Application 2019 & 2032
- Table 31: Rest of South America Complementary and Alternative Medicine Industry Revenue (Million) Forecast, by Application 2019 & 2032
- Table 32: Global Complementary and Alternative Medicine Industry Revenue Million Forecast, by Type 2019 & 2032
- Table 33: Global Complementary and Alternative Medicine Industry Revenue Million Forecast, by Application 2019 & 2032
- Table 34: Global Complementary and Alternative Medicine Industry Revenue Million Forecast, by Distribution Channel 2019 & 2032
- Table 35: Global Complementary and Alternative Medicine Industry Revenue Million Forecast, by Country 2019 & 2032
- Table 36: United States Complementary and Alternative Medicine Industry Revenue (Million) Forecast, by Application 2019 & 2032
- Table 37: Canada Complementary and Alternative Medicine Industry Revenue (Million) Forecast, by Application 2019 & 2032
- Table 38: Mexico Complementary and Alternative Medicine Industry Revenue (Million) Forecast, by Application 2019 & 2032
- Table 39: Global Complementary and Alternative Medicine Industry Revenue Million Forecast, by Type 2019 & 2032
- Table 40: Global Complementary and Alternative Medicine Industry Revenue Million Forecast, by Application 2019 & 2032
- Table 41: Global Complementary and Alternative Medicine Industry Revenue Million Forecast, by Distribution Channel 2019 & 2032
- Table 42: Global Complementary and Alternative Medicine Industry Revenue Million Forecast, by Country 2019 & 2032
- Table 43: Germany Complementary and Alternative Medicine Industry Revenue (Million) Forecast, by Application 2019 & 2032
- Table 44: United Kingdom Complementary and Alternative Medicine Industry Revenue (Million) Forecast, by Application 2019 & 2032
- Table 45: France Complementary and Alternative Medicine Industry Revenue (Million) Forecast, by Application 2019 & 2032
- Table 46: Italy Complementary and Alternative Medicine Industry Revenue (Million) Forecast, by Application 2019 & 2032
- Table 47: Spain Complementary and Alternative Medicine Industry Revenue (Million) Forecast, by Application 2019 & 2032
- Table 48: Rest of Europe Complementary and Alternative Medicine Industry Revenue (Million) Forecast, by Application 2019 & 2032
- Table 49: Global Complementary and Alternative Medicine Industry Revenue Million Forecast, by Type 2019 & 2032
- Table 50: Global Complementary and Alternative Medicine Industry Revenue Million Forecast, by Application 2019 & 2032
- Table 51: Global Complementary and Alternative Medicine Industry Revenue Million Forecast, by Distribution Channel 2019 & 2032
- Table 52: Global Complementary and Alternative Medicine Industry Revenue Million Forecast, by Country 2019 & 2032
- Table 53: China Complementary and Alternative Medicine Industry Revenue (Million) Forecast, by Application 2019 & 2032
- Table 54: Japan Complementary and Alternative Medicine Industry Revenue (Million) Forecast, by Application 2019 & 2032
- Table 55: India Complementary and Alternative Medicine Industry Revenue (Million) Forecast, by Application 2019 & 2032
- Table 56: Australia Complementary and Alternative Medicine Industry Revenue (Million) Forecast, by Application 2019 & 2032
- Table 57: South Korea Complementary and Alternative Medicine Industry Revenue (Million) Forecast, by Application 2019 & 2032
- Table 58: Rest of Asia Pacific Complementary and Alternative Medicine Industry Revenue (Million) Forecast, by Application 2019 & 2032
- Table 59: Global Complementary and Alternative Medicine Industry Revenue Million Forecast, by Type 2019 & 2032
- Table 60: Global Complementary and Alternative Medicine Industry Revenue Million Forecast, by Application 2019 & 2032
- Table 61: Global Complementary and Alternative Medicine Industry Revenue Million Forecast, by Distribution Channel 2019 & 2032
- Table 62: Global Complementary and Alternative Medicine Industry Revenue Million Forecast, by Country 2019 & 2032
- Table 63: GCC Complementary and Alternative Medicine Industry Revenue (Million) Forecast, by Application 2019 & 2032
- Table 64: South Africa Complementary and Alternative Medicine Industry Revenue (Million) Forecast, by Application 2019 & 2032
- Table 65: Rest of Middle East and Africa Complementary and Alternative Medicine Industry Revenue (Million) Forecast, by Application 2019 & 2032
- Table 66: Global Complementary and Alternative Medicine Industry Revenue Million Forecast, by Type 2019 & 2032
- Table 67: Global Complementary and Alternative Medicine Industry Revenue Million Forecast, by Application 2019 & 2032
- Table 68: Global Complementary and Alternative Medicine Industry Revenue Million Forecast, by Distribution Channel 2019 & 2032
- Table 69: Global Complementary and Alternative Medicine Industry Revenue Million Forecast, by Country 2019 & 2032
- Table 70: Brazil Complementary and Alternative Medicine Industry Revenue (Million) Forecast, by Application 2019 & 2032
- Table 71: Argentina Complementary and Alternative Medicine Industry Revenue (Million) Forecast, by Application 2019 & 2032
- Table 72: Rest of South America Complementary and Alternative Medicine Industry Revenue (Million) Forecast, by Application 2019 & 2032
Frequently Asked Questions
1. What is the projected Compound Annual Growth Rate (CAGR) of the Complementary and Alternative Medicine Industry?
The projected CAGR is approximately 19.50%.
2. Which companies are prominent players in the Complementary and Alternative Medicine Industry?
Key companies in the market include Unity Woods Yoga Center, Columbia Nutritional LLC, Quantum-Touch, Sheng Chang Pharmaceutical Company, Nordic Nutraceuticals*List Not Exhaustive, Ramamani Iyengar Memorial Yoga Institute, Pure encapsulations LLC, Herb Pharm, Yoga Tree Studios Inc, John Schumacher Unity Woods Yoga Centre, Healing Company Ltd, Ayush Ayurvedic Pte Ltd.
3. What are the main segments of the Complementary and Alternative Medicine Industry?
The market segments include Type, Application, Distribution Channel.
4. Can you provide details about the market size?
The market size is estimated to be USD XX Million as of 2022.
5. What are some drivers contributing to market growth?
Increasing Awareness About the Benefits of Complementary and Alternative Medicines; Growing Government Initiative and Growing Acceptance.
6. What are the notable trends driving market growth?
Cancer Is Expected to Hold a Significant Share Over the Forecast Period.
7. Are there any restraints impacting market growth?
Lack of Proper Scientific Evidence and Less Understanding About Alternative Medicine.
8. Can you provide examples of recent developments in the market?
December 2022: Adoratherapy launched its Alkemie Chakra Healing collection, featuring aroma perfume sprays, dry touch body oils, body lotions, and lotion candles all with the same scents. The scents were formulated to balance and heal using aromatherapy principles, in which essential oils are active ingredients.
9. What pricing options are available for accessing the report?
Pricing options include single-user, multi-user, and enterprise licenses priced at USD 4750, USD 5250, and USD 8750 respectively.
10. Is the market size provided in terms of value or volume?
The market size is provided in terms of value, measured in Million.
11. Are there any specific market keywords associated with the report?
Yes, the market keyword associated with the report is "Complementary and Alternative Medicine Industry," which aids in identifying and referencing the specific market segment covered.
12. How do I determine which pricing option suits my needs best?
The pricing options vary based on user requirements and access needs. Individual users may opt for single-user licenses, while businesses requiring broader access may choose multi-user or enterprise licenses for cost-effective access to the report.
13. Are there any additional resources or data provided in the Complementary and Alternative Medicine Industry report?
While the report offers comprehensive insights, it's advisable to review the specific contents or supplementary materials provided to ascertain if additional resources or data are available.
14. How can I stay updated on further developments or reports in the Complementary and Alternative Medicine Industry?
To stay informed about further developments, trends, and reports in the Complementary and Alternative Medicine Industry, consider subscribing to industry newsletters, following relevant companies and organizations, or regularly checking reputable industry news sources and publications.
Methodology
Step 1 - Identification of Relevant Samples Size from Population Database


Step 2 - Approaches for Defining Global Market Size (Value, Volume* & Price*)

Note*: In applicable scenarios
Step 3 - Data Sources
Primary Research
- Web Analytics
- Survey Reports
- Research Institute
- Latest Research Reports
- Opinion Leaders
Secondary Research
- Annual Reports
- White Paper
- Latest Press Release
- Industry Association
- Paid Database
- Investor Presentations

Step 4 - Data Triangulation
Involves using different sources of information in order to increase the validity of a study
These sources are likely to be stakeholders in a program - participants, other researchers, program staff, other community members, and so on.
Then we put all data in single framework & apply various statistical tools to find out the dynamic on the market.
During the analysis stage, feedback from the stakeholder groups would be compared to determine areas of agreement as well as areas of divergence
