

Key Insights
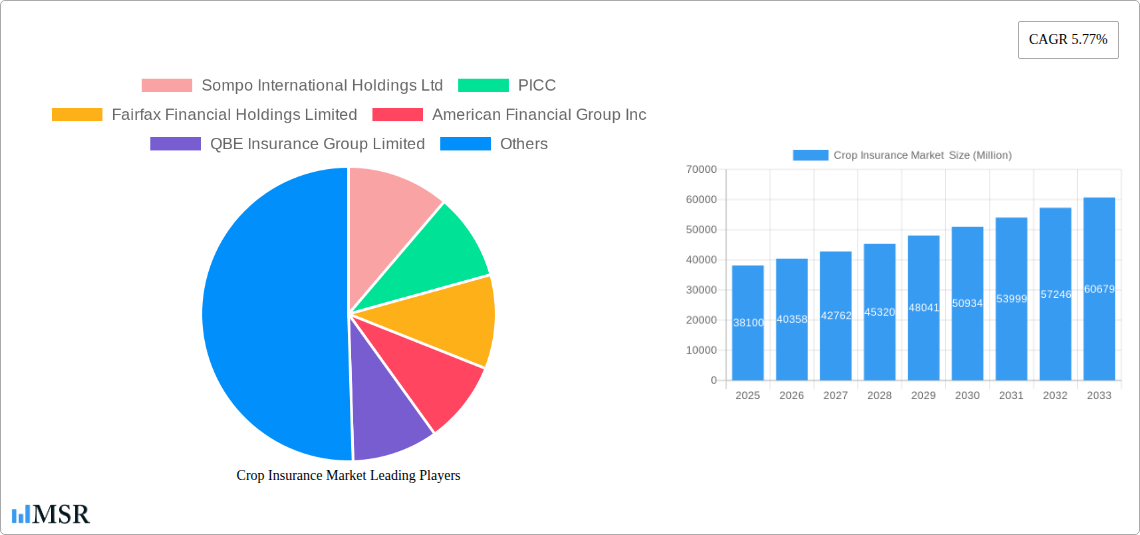
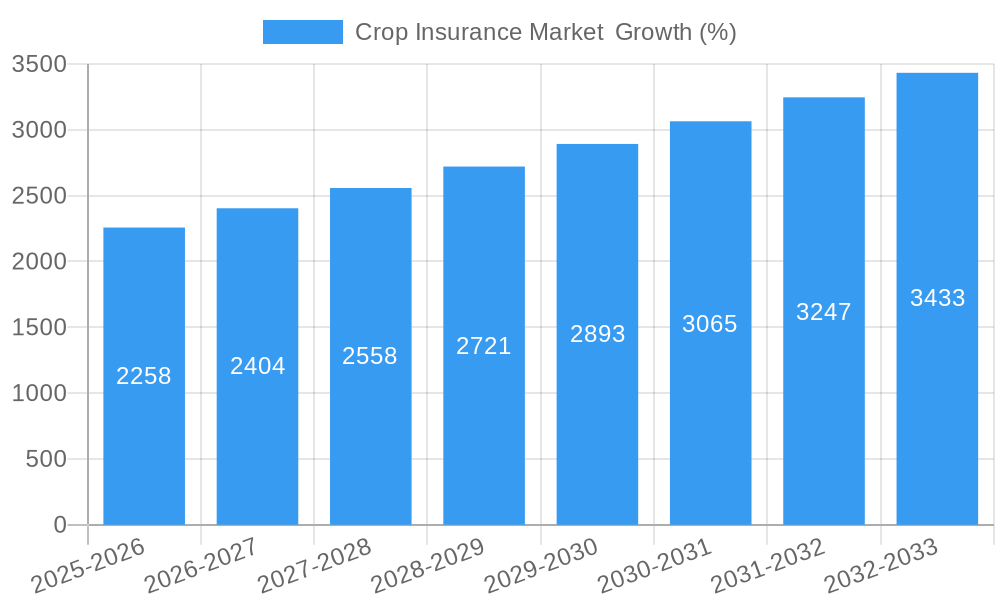
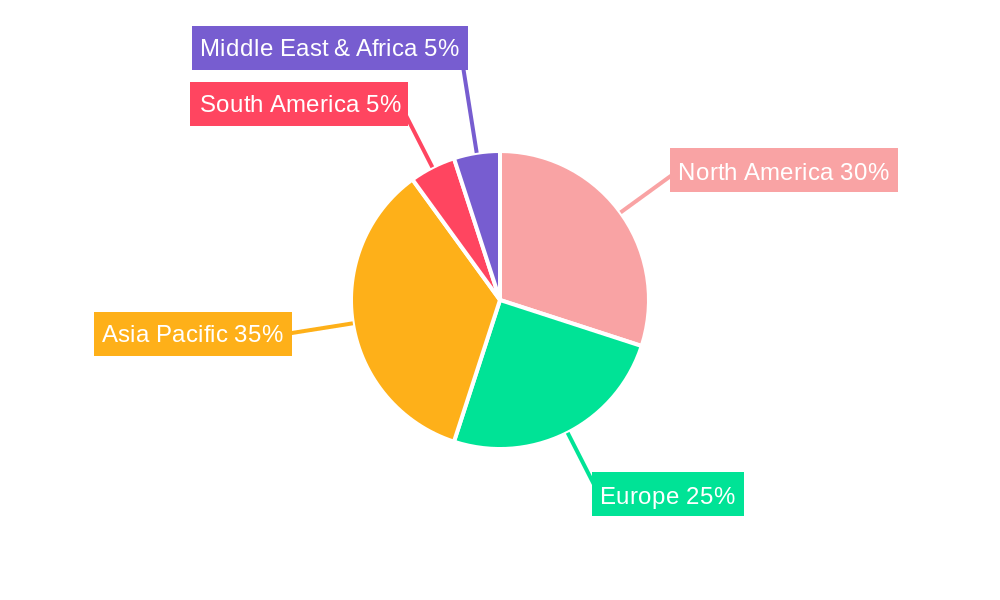
The global crop insurance market, valued at $38.10 billion in 2025, is projected to experience robust growth, driven by a Compound Annual Growth Rate (CAGR) of 5.77% from 2025 to 2033. This expansion is fueled by several key factors. Increasing frequency and severity of climate change-related events like droughts, floods, and extreme weather patterns are significantly impacting agricultural yields, compelling farmers to seek risk mitigation through insurance. Government initiatives promoting agricultural insurance, coupled with rising awareness among farmers about the benefits of risk management, are also contributing to market growth. Furthermore, technological advancements, such as precision agriculture and remote sensing, are enabling more accurate risk assessment and improved claims processing, enhancing the efficiency and appeal of crop insurance products. The market is segmented by coverage type (localized calamities, sowing/planting/germination risk, standing crop loss, post-harvest losses), distribution channel (banks, insurance companies, brokers and agents, other channels), and insurance type (multiple peril crop insurance, actual production history, crop revenue coverage). The diverse range of products caters to specific farmer needs and risk profiles. Geographically, North America and Asia-Pacific currently dominate the market, although emerging economies in regions like Africa and South America present significant growth potential as agricultural practices evolve and insurance penetration increases. Competition among major players like Sompo International Holdings Ltd, PICC, Fairfax Financial Holdings Limited, and others is driving innovation and the development of more comprehensive and affordable insurance solutions.
The market's growth trajectory is expected to remain positive throughout the forecast period, although potential restraints include the relatively low insurance penetration rate in many developing countries, difficulties in accurately assessing crop losses in remote areas, and challenges in managing fraud and ensuring timely claim payouts. However, ongoing technological advancements and supportive government policies are mitigating these challenges, paving the way for sustained market expansion. The diversification of crop insurance products and expansion into new markets will continue to be pivotal strategies for market participants striving for a larger share of this expanding sector. The increasing reliance on data-driven insights for risk assessment will further refine pricing models and improve the efficiency of the entire crop insurance value chain, leading to a more robust and sustainable market.
Crop Insurance Market: A Comprehensive Report (2019-2033)
This in-depth report provides a comprehensive analysis of the global Crop Insurance Market, offering actionable insights for industry stakeholders. With a study period spanning 2019-2033, a base year of 2025, and an estimated year of 2025, this report forecasts market trends through 2033, leveraging historical data from 2019-2024. The report segments the market by coverage type (Localized Calamities, Sowing/Planting/Germination Risk, Standing Crop Loss, Post-harvest Losses), distribution channel (Banks, Insurance Companies, Brokers and Agents, Other Distribution Channels), and insurance type (Multiple Peril Crop Insurance, Actual Production History, Crop Revenue Coverage). Key players analyzed include Sompo International Holdings Ltd, PICC, Fairfax Financial Holdings Limited, American Financial Group Inc, QBE Insurance Group Limited, ICICI Lombard General Insurance Company Limited, Zurich, Chubb, Tokio Marine HCC, and Agriculture Insurance Company of India Limited (AIC), though the list is not exhaustive. The market is expected to reach xx Million by 2033, exhibiting a CAGR of xx%.
Crop Insurance Market Market Concentration & Dynamics
The global crop insurance market exhibits a moderately concentrated landscape, with a few large multinational players holding significant market share. However, the presence of numerous regional and specialized insurers fosters competition. Market share data reveals that the top five players collectively account for approximately xx% of the global market in 2025. Innovation within the sector is driven by advancements in technology such as remote sensing, AI-powered risk assessment, and blockchain for claims processing. Regulatory frameworks vary significantly across countries, influencing market entry barriers and insurance product design. Substitute products, such as government subsidies and farmer cooperatives, compete with traditional insurance solutions. End-user trends reveal a growing demand for comprehensive and affordable crop insurance, particularly in developing economies. M&A activity has been noteworthy, with several significant deals occurring in recent years. For instance, the number of M&A deals in the crop insurance sector from 2019 to 2024 totaled approximately xx, indicating consolidation within the industry.
- Market Concentration: Top 5 players hold approximately xx% market share (2025).
- Innovation: Advancements in technology, including AI and remote sensing, are driving innovation.
- Regulatory Frameworks: Vary significantly across regions, influencing market dynamics.
- Substitute Products: Government subsidies and farmer cooperatives offer alternative risk mitigation.
- End-User Trends: Increasing demand for affordable and comprehensive crop insurance, especially in developing nations.
- M&A Activity: Approximately xx M&A deals occurred between 2019 and 2024.
Crop Insurance Market Industry Insights & Trends
The global crop insurance market is experiencing robust growth, driven by several factors. Increasing frequency and severity of extreme weather events linked to climate change are boosting demand for risk mitigation strategies. Government initiatives promoting agricultural insurance and supporting farmers are also contributing to market expansion. Technological advancements, such as precision agriculture and IoT devices, are enabling more accurate risk assessment and efficient claims processing. This has improved the accuracy of crop yield prediction, leading to better underwriting and improved risk management. Consumer behavior shows a growing preference for customized insurance products that cater to specific crop types and regional risks. The market size is estimated to reach xx Million in 2025, with a projected CAGR of xx% during the forecast period (2025-2033). This growth trajectory reflects the increasing awareness of the importance of crop insurance among farmers and the growing support from governments and financial institutions.
Key Markets & Segments Leading Crop Insurance Market
The North American region currently dominates the global crop insurance market, driven by factors such as a developed agricultural sector, strong regulatory support, and high insurance penetration among farmers. However, significant growth potential exists in developing economies across Asia and Africa, where agricultural insurance penetration remains relatively low. Within the coverage segments, standing crop loss insurance holds the largest market share, followed closely by sowing/planting/germination risk coverage. Multiple Peril Crop Insurance is the most prevalent type of crop insurance. The distribution channel analysis indicates that insurance companies are the dominant players, but banks and brokers are significantly contributing to market growth.
Key Drivers by Segment:
- North America (Dominant Region): Advanced agricultural sector, strong regulatory environment, high insurance penetration.
- Asia & Africa (High Growth Potential): Rapid economic growth, increasing agricultural production, government initiatives to promote insurance.
- By Coverage: Standing Crop Loss and Sowing/Planting/Germination Risk dominate the market.
- By Distribution Channel: Insurance companies are the key players, but banks and brokers contribute significantly.
- By Type: Multiple Peril Crop Insurance holds the largest share.
Crop Insurance Market Product Developments
Recent innovations in crop insurance involve the integration of advanced technologies like remote sensing, drones, and machine learning to enhance risk assessment accuracy and automate claims processing. These technological advancements provide insurers with improved data and analytical capabilities, leading to more precise risk profiling, and optimized pricing strategies. Moreover, the development of customized products tailored to specific crop types and regional risks allows insurers to better serve their clients' specific needs and build stronger customer relationships. These products also contribute to enhanced competitive advantage.
Challenges in the Crop Insurance Market Market
Significant challenges hinder the growth of the crop insurance market. These include inadequate infrastructure in many regions, limited access to credit and financial services for farmers, and the complexity of accurately assessing crop risks, especially in developing countries. Regulatory hurdles and a lack of awareness among farmers about the benefits of crop insurance are also factors. Furthermore, the increasing frequency and intensity of extreme weather events pose significant underwriting challenges to insurance providers, impacting profitability. These challenges collectively limit market penetration and growth potential. The estimated impact is a reduction of approximately xx Million in potential market value annually.
Forces Driving Crop Insurance Market Growth
Several factors are driving market growth. Firstly, the escalating frequency and severity of climate-related events necessitate comprehensive risk management solutions, fueling the demand for crop insurance. Government initiatives that promote agricultural insurance and provide subsidies to farmers are stimulating market adoption. Technological advancements are enhancing risk assessment and claims processing efficiency, improving market attractiveness. Lastly, the growing awareness among farmers regarding the financial protection afforded by crop insurance is also a significant driver.
Long-Term Growth Catalysts in the Crop Insurance Market
Long-term growth will be catalyzed by the continued development and adoption of innovative technologies such as AI-powered risk assessment models, the expansion of insurance coverage to underserved regions, and strategic partnerships between insurance providers and agricultural technology companies. Government initiatives to strengthen agricultural insurance programs will be crucial. The expansion into new markets, particularly in developing economies, presents a significant growth opportunity.
Emerging Opportunities in Crop Insurance Market
Emerging opportunities include the expansion into new crop types, personalized insurance offerings based on individual farm characteristics and the application of blockchain technology to streamline claim processing and reduce fraud. The increasing use of parametric insurance, where payouts are triggered by objective weather data, represents a noteworthy trend. Finally, microinsurance programs that cater to smallholder farmers in developing countries hold significant potential.
Leading Players in the Crop Insurance Market Sector
- Sompo International Holdings Ltd
- PICC
- Fairfax Financial Holdings Limited
- American Financial Group Inc
- QBE Insurance Group Limited
- ICICI Lombard General Insurance Company Limited
- Zurich
- Chubb
- Tokio Marine HCC
- Agriculture Insurance Company of India Limited (AIC)
Key Milestones in Crop Insurance Market Industry
- September 2023: Launch of the Shrimp Crop Insurance scheme by the Agricultural Insurance Company of India.
- July 2023: American Financial Group (AFG) acquires Crop Risk Services (CRS) from AIG, significantly increasing AFG's market share in the US multi-peril crop insurance market.
Strategic Outlook for Crop Insurance Market Market
The crop insurance market is poised for substantial growth, driven by climate change, technological innovation, and increasing government support. Strategic opportunities lie in developing customized insurance products, expanding into underserved markets, and leveraging technological advancements to enhance efficiency and accuracy. Collaboration between insurance providers, agricultural technology companies, and government agencies will be pivotal in unlocking the market’s full potential.
Crop Insurance Market Segmentation
-
1. Type
- 1.1. Multiple Peril Crop Insurance
- 1.2. Actual Production History
- 1.3. Crop Revenue Coverage
-
2. Coverage
- 2.1. Localized Calamities
- 2.2. Sowing/Planting/Germination Risk
- 2.3. Standing Crop Loss
- 2.4. Post-harvest Losses
-
3. Distribution Channel
- 3.1. Banks
- 3.2. Insurance Companies
- 3.3. Brokers and Agents
- 3.4. Other Distribution Channels
Crop Insurance Market Segmentation By Geography
-
1. North America
- 1.1. United States
- 1.2. Canada
- 1.3. Mexico
-
2. South America
- 2.1. Brazil
- 2.2. Argentina
- 2.3. Rest of South America
-
3. Europe
- 3.1. United Kingdom
- 3.2. Germany
- 3.3. France
- 3.4. Italy
- 3.5. Spain
- 3.6. Russia
- 3.7. Benelux
- 3.8. Nordics
- 3.9. Rest of Europe
-
4. Middle East & Africa
- 4.1. Turkey
- 4.2. Israel
- 4.3. GCC
- 4.4. North Africa
- 4.5. South Africa
- 4.6. Rest of Middle East & Africa
-
5. Asia Pacific
- 5.1. China
- 5.2. India
- 5.3. Japan
- 5.4. South Korea
- 5.5. ASEAN
- 5.6. Oceania
- 5.7. Rest of Asia Pacific
Crop Insurance Market REPORT HIGHLIGHTS
| Aspects | Details |
|---|---|
| Study Period | 2019-2033 |
| Base Year | 2024 |
| Estimated Year | 2025 |
| Forecast Period | 2025-2033 |
| Historical Period | 2019-2024 |
| Growth Rate | CAGR of 5.77% from 2019-2033 |
| Segmentation |
|
Table of Contents
- 1. Introduction
- 1.1. Research Scope
- 1.2. Market Segmentation
- 1.3. Research Methodology
- 1.4. Definitions and Assumptions
- 2. Executive Summary
- 2.1. Introduction
- 3. Market Dynamics
- 3.1. Introduction
- 3.2. Market Drivers
- 3.2.1 Government Support
- 3.2.2 Including Subsidies and Initiatives
- 3.2.3 is a Significant Driver
- 3.3. Market Restrains
- 3.3.1. Instances of Fraud or Misreporting can Impact the Integrity of the Crop Insurance System
- 3.4. Market Trends
- 3.4.1. Increasing Value Crop Protection Globally
- 4. Market Factor Analysis
- 4.1. Porters Five Forces
- 4.2. Supply/Value Chain
- 4.3. PESTEL analysis
- 4.4. Market Entropy
- 4.5. Patent/Trademark Analysis
- 5. Global Crop Insurance Market Analysis, Insights and Forecast, 2019-2031
- 5.1. Market Analysis, Insights and Forecast - by Type
- 5.1.1. Multiple Peril Crop Insurance
- 5.1.2. Actual Production History
- 5.1.3. Crop Revenue Coverage
- 5.2. Market Analysis, Insights and Forecast - by Coverage
- 5.2.1. Localized Calamities
- 5.2.2. Sowing/Planting/Germination Risk
- 5.2.3. Standing Crop Loss
- 5.2.4. Post-harvest Losses
- 5.3. Market Analysis, Insights and Forecast - by Distribution Channel
- 5.3.1. Banks
- 5.3.2. Insurance Companies
- 5.3.3. Brokers and Agents
- 5.3.4. Other Distribution Channels
- 5.4. Market Analysis, Insights and Forecast - by Region
- 5.4.1. North America
- 5.4.2. South America
- 5.4.3. Europe
- 5.4.4. Middle East & Africa
- 5.4.5. Asia Pacific
- 5.1. Market Analysis, Insights and Forecast - by Type
- 6. North America Crop Insurance Market Analysis, Insights and Forecast, 2019-2031
- 6.1. Market Analysis, Insights and Forecast - by Type
- 6.1.1. Multiple Peril Crop Insurance
- 6.1.2. Actual Production History
- 6.1.3. Crop Revenue Coverage
- 6.2. Market Analysis, Insights and Forecast - by Coverage
- 6.2.1. Localized Calamities
- 6.2.2. Sowing/Planting/Germination Risk
- 6.2.3. Standing Crop Loss
- 6.2.4. Post-harvest Losses
- 6.3. Market Analysis, Insights and Forecast - by Distribution Channel
- 6.3.1. Banks
- 6.3.2. Insurance Companies
- 6.3.3. Brokers and Agents
- 6.3.4. Other Distribution Channels
- 6.1. Market Analysis, Insights and Forecast - by Type
- 7. South America Crop Insurance Market Analysis, Insights and Forecast, 2019-2031
- 7.1. Market Analysis, Insights and Forecast - by Type
- 7.1.1. Multiple Peril Crop Insurance
- 7.1.2. Actual Production History
- 7.1.3. Crop Revenue Coverage
- 7.2. Market Analysis, Insights and Forecast - by Coverage
- 7.2.1. Localized Calamities
- 7.2.2. Sowing/Planting/Germination Risk
- 7.2.3. Standing Crop Loss
- 7.2.4. Post-harvest Losses
- 7.3. Market Analysis, Insights and Forecast - by Distribution Channel
- 7.3.1. Banks
- 7.3.2. Insurance Companies
- 7.3.3. Brokers and Agents
- 7.3.4. Other Distribution Channels
- 7.1. Market Analysis, Insights and Forecast - by Type
- 8. Europe Crop Insurance Market Analysis, Insights and Forecast, 2019-2031
- 8.1. Market Analysis, Insights and Forecast - by Type
- 8.1.1. Multiple Peril Crop Insurance
- 8.1.2. Actual Production History
- 8.1.3. Crop Revenue Coverage
- 8.2. Market Analysis, Insights and Forecast - by Coverage
- 8.2.1. Localized Calamities
- 8.2.2. Sowing/Planting/Germination Risk
- 8.2.3. Standing Crop Loss
- 8.2.4. Post-harvest Losses
- 8.3. Market Analysis, Insights and Forecast - by Distribution Channel
- 8.3.1. Banks
- 8.3.2. Insurance Companies
- 8.3.3. Brokers and Agents
- 8.3.4. Other Distribution Channels
- 8.1. Market Analysis, Insights and Forecast - by Type
- 9. Middle East & Africa Crop Insurance Market Analysis, Insights and Forecast, 2019-2031
- 9.1. Market Analysis, Insights and Forecast - by Type
- 9.1.1. Multiple Peril Crop Insurance
- 9.1.2. Actual Production History
- 9.1.3. Crop Revenue Coverage
- 9.2. Market Analysis, Insights and Forecast - by Coverage
- 9.2.1. Localized Calamities
- 9.2.2. Sowing/Planting/Germination Risk
- 9.2.3. Standing Crop Loss
- 9.2.4. Post-harvest Losses
- 9.3. Market Analysis, Insights and Forecast - by Distribution Channel
- 9.3.1. Banks
- 9.3.2. Insurance Companies
- 9.3.3. Brokers and Agents
- 9.3.4. Other Distribution Channels
- 9.1. Market Analysis, Insights and Forecast - by Type
- 10. Asia Pacific Crop Insurance Market Analysis, Insights and Forecast, 2019-2031
- 10.1. Market Analysis, Insights and Forecast - by Type
- 10.1.1. Multiple Peril Crop Insurance
- 10.1.2. Actual Production History
- 10.1.3. Crop Revenue Coverage
- 10.2. Market Analysis, Insights and Forecast - by Coverage
- 10.2.1. Localized Calamities
- 10.2.2. Sowing/Planting/Germination Risk
- 10.2.3. Standing Crop Loss
- 10.2.4. Post-harvest Losses
- 10.3. Market Analysis, Insights and Forecast - by Distribution Channel
- 10.3.1. Banks
- 10.3.2. Insurance Companies
- 10.3.3. Brokers and Agents
- 10.3.4. Other Distribution Channels
- 10.1. Market Analysis, Insights and Forecast - by Type
- 11. North America Crop Insurance Market Analysis, Insights and Forecast, 2019-2031
- 11.1. Market Analysis, Insights and Forecast - By Country/Sub-region
- 11.1.1 United States
- 11.1.2 Canada
- 11.1.3 Mexico
- 12. South America Crop Insurance Market Analysis, Insights and Forecast, 2019-2031
- 12.1. Market Analysis, Insights and Forecast - By Country/Sub-region
- 12.1.1 Brazil
- 12.1.2 Argentina
- 12.1.3 Rest of South America
- 13. Europe Crop Insurance Market Analysis, Insights and Forecast, 2019-2031
- 13.1. Market Analysis, Insights and Forecast - By Country/Sub-region
- 13.1.1 Germany
- 13.1.2 France
- 13.1.3 Italy
- 13.1.4 United Kingdom
- 13.1.5 Netherlands
- 13.1.6 Sweden
- 13.1.7 Rest of Europe
- 14. Asia Pacific Crop Insurance Market Analysis, Insights and Forecast, 2019-2031
- 14.1. Market Analysis, Insights and Forecast - By Country/Sub-region
- 14.1.1 China
- 14.1.2 Japan
- 14.1.3 India
- 14.1.4 South Korea
- 14.1.5 Taiwan
- 14.1.6 Australia
- 14.1.7 Rest of Asia-Pacific
- 15. Middle East & Africa Crop Insurance Market Analysis, Insights and Forecast, 2019-2031
- 15.1. Market Analysis, Insights and Forecast - By Country/Sub-region
- 15.1.1 UAE
- 15.1.2 South Africa
- 15.1.3 Saudi Arabia
- 15.1.4 Rest of MEA
- 16. Competitive Analysis
- 16.1. Global Market Share Analysis 2024
- 16.2. Company Profiles
- 16.2.1 Sompo International Holdings Ltd
- 16.2.1.1. Overview
- 16.2.1.2. Products
- 16.2.1.3. SWOT Analysis
- 16.2.1.4. Recent Developments
- 16.2.1.5. Financials (Based on Availability)
- 16.2.2 PICC
- 16.2.2.1. Overview
- 16.2.2.2. Products
- 16.2.2.3. SWOT Analysis
- 16.2.2.4. Recent Developments
- 16.2.2.5. Financials (Based on Availability)
- 16.2.3 Fairfax Financial Holdings Limited
- 16.2.3.1. Overview
- 16.2.3.2. Products
- 16.2.3.3. SWOT Analysis
- 16.2.3.4. Recent Developments
- 16.2.3.5. Financials (Based on Availability)
- 16.2.4 American Financial Group Inc
- 16.2.4.1. Overview
- 16.2.4.2. Products
- 16.2.4.3. SWOT Analysis
- 16.2.4.4. Recent Developments
- 16.2.4.5. Financials (Based on Availability)
- 16.2.5 QBE Insurance Group Limited
- 16.2.5.1. Overview
- 16.2.5.2. Products
- 16.2.5.3. SWOT Analysis
- 16.2.5.4. Recent Developments
- 16.2.5.5. Financials (Based on Availability)
- 16.2.6 ICICI Lombard General Insurance Company Limited
- 16.2.6.1. Overview
- 16.2.6.2. Products
- 16.2.6.3. SWOT Analysis
- 16.2.6.4. Recent Developments
- 16.2.6.5. Financials (Based on Availability)
- 16.2.7 Zurich**List Not Exhaustive
- 16.2.7.1. Overview
- 16.2.7.2. Products
- 16.2.7.3. SWOT Analysis
- 16.2.7.4. Recent Developments
- 16.2.7.5. Financials (Based on Availability)
- 16.2.8 Chubb
- 16.2.8.1. Overview
- 16.2.8.2. Products
- 16.2.8.3. SWOT Analysis
- 16.2.8.4. Recent Developments
- 16.2.8.5. Financials (Based on Availability)
- 16.2.9 Tokio Marine HCC
- 16.2.9.1. Overview
- 16.2.9.2. Products
- 16.2.9.3. SWOT Analysis
- 16.2.9.4. Recent Developments
- 16.2.9.5. Financials (Based on Availability)
- 16.2.10 Agriculture Insurance Company of India Limited (AIC)
- 16.2.10.1. Overview
- 16.2.10.2. Products
- 16.2.10.3. SWOT Analysis
- 16.2.10.4. Recent Developments
- 16.2.10.5. Financials (Based on Availability)
- 16.2.1 Sompo International Holdings Ltd
List of Figures
- Figure 1: Global Crop Insurance Market Revenue Breakdown (Million, %) by Region 2024 & 2032
- Figure 2: North America Crop Insurance Market Revenue (Million), by Country 2024 & 2032
- Figure 3: North America Crop Insurance Market Revenue Share (%), by Country 2024 & 2032
- Figure 4: South America Crop Insurance Market Revenue (Million), by Country 2024 & 2032
- Figure 5: South America Crop Insurance Market Revenue Share (%), by Country 2024 & 2032
- Figure 6: Europe Crop Insurance Market Revenue (Million), by Country 2024 & 2032
- Figure 7: Europe Crop Insurance Market Revenue Share (%), by Country 2024 & 2032
- Figure 8: Asia Pacific Crop Insurance Market Revenue (Million), by Country 2024 & 2032
- Figure 9: Asia Pacific Crop Insurance Market Revenue Share (%), by Country 2024 & 2032
- Figure 10: Middle East & Africa Crop Insurance Market Revenue (Million), by Country 2024 & 2032
- Figure 11: Middle East & Africa Crop Insurance Market Revenue Share (%), by Country 2024 & 2032
- Figure 12: North America Crop Insurance Market Revenue (Million), by Type 2024 & 2032
- Figure 13: North America Crop Insurance Market Revenue Share (%), by Type 2024 & 2032
- Figure 14: North America Crop Insurance Market Revenue (Million), by Coverage 2024 & 2032
- Figure 15: North America Crop Insurance Market Revenue Share (%), by Coverage 2024 & 2032
- Figure 16: North America Crop Insurance Market Revenue (Million), by Distribution Channel 2024 & 2032
- Figure 17: North America Crop Insurance Market Revenue Share (%), by Distribution Channel 2024 & 2032
- Figure 18: North America Crop Insurance Market Revenue (Million), by Country 2024 & 2032
- Figure 19: North America Crop Insurance Market Revenue Share (%), by Country 2024 & 2032
- Figure 20: South America Crop Insurance Market Revenue (Million), by Type 2024 & 2032
- Figure 21: South America Crop Insurance Market Revenue Share (%), by Type 2024 & 2032
- Figure 22: South America Crop Insurance Market Revenue (Million), by Coverage 2024 & 2032
- Figure 23: South America Crop Insurance Market Revenue Share (%), by Coverage 2024 & 2032
- Figure 24: South America Crop Insurance Market Revenue (Million), by Distribution Channel 2024 & 2032
- Figure 25: South America Crop Insurance Market Revenue Share (%), by Distribution Channel 2024 & 2032
- Figure 26: South America Crop Insurance Market Revenue (Million), by Country 2024 & 2032
- Figure 27: South America Crop Insurance Market Revenue Share (%), by Country 2024 & 2032
- Figure 28: Europe Crop Insurance Market Revenue (Million), by Type 2024 & 2032
- Figure 29: Europe Crop Insurance Market Revenue Share (%), by Type 2024 & 2032
- Figure 30: Europe Crop Insurance Market Revenue (Million), by Coverage 2024 & 2032
- Figure 31: Europe Crop Insurance Market Revenue Share (%), by Coverage 2024 & 2032
- Figure 32: Europe Crop Insurance Market Revenue (Million), by Distribution Channel 2024 & 2032
- Figure 33: Europe Crop Insurance Market Revenue Share (%), by Distribution Channel 2024 & 2032
- Figure 34: Europe Crop Insurance Market Revenue (Million), by Country 2024 & 2032
- Figure 35: Europe Crop Insurance Market Revenue Share (%), by Country 2024 & 2032
- Figure 36: Middle East & Africa Crop Insurance Market Revenue (Million), by Type 2024 & 2032
- Figure 37: Middle East & Africa Crop Insurance Market Revenue Share (%), by Type 2024 & 2032
- Figure 38: Middle East & Africa Crop Insurance Market Revenue (Million), by Coverage 2024 & 2032
- Figure 39: Middle East & Africa Crop Insurance Market Revenue Share (%), by Coverage 2024 & 2032
- Figure 40: Middle East & Africa Crop Insurance Market Revenue (Million), by Distribution Channel 2024 & 2032
- Figure 41: Middle East & Africa Crop Insurance Market Revenue Share (%), by Distribution Channel 2024 & 2032
- Figure 42: Middle East & Africa Crop Insurance Market Revenue (Million), by Country 2024 & 2032
- Figure 43: Middle East & Africa Crop Insurance Market Revenue Share (%), by Country 2024 & 2032
- Figure 44: Asia Pacific Crop Insurance Market Revenue (Million), by Type 2024 & 2032
- Figure 45: Asia Pacific Crop Insurance Market Revenue Share (%), by Type 2024 & 2032
- Figure 46: Asia Pacific Crop Insurance Market Revenue (Million), by Coverage 2024 & 2032
- Figure 47: Asia Pacific Crop Insurance Market Revenue Share (%), by Coverage 2024 & 2032
- Figure 48: Asia Pacific Crop Insurance Market Revenue (Million), by Distribution Channel 2024 & 2032
- Figure 49: Asia Pacific Crop Insurance Market Revenue Share (%), by Distribution Channel 2024 & 2032
- Figure 50: Asia Pacific Crop Insurance Market Revenue (Million), by Country 2024 & 2032
- Figure 51: Asia Pacific Crop Insurance Market Revenue Share (%), by Country 2024 & 2032
List of Tables
- Table 1: Global Crop Insurance Market Revenue Million Forecast, by Region 2019 & 2032
- Table 2: Global Crop Insurance Market Revenue Million Forecast, by Type 2019 & 2032
- Table 3: Global Crop Insurance Market Revenue Million Forecast, by Coverage 2019 & 2032
- Table 4: Global Crop Insurance Market Revenue Million Forecast, by Distribution Channel 2019 & 2032
- Table 5: Global Crop Insurance Market Revenue Million Forecast, by Region 2019 & 2032
- Table 6: Global Crop Insurance Market Revenue Million Forecast, by Country 2019 & 2032
- Table 7: United States Crop Insurance Market Revenue (Million) Forecast, by Application 2019 & 2032
- Table 8: Canada Crop Insurance Market Revenue (Million) Forecast, by Application 2019 & 2032
- Table 9: Mexico Crop Insurance Market Revenue (Million) Forecast, by Application 2019 & 2032
- Table 10: Global Crop Insurance Market Revenue Million Forecast, by Country 2019 & 2032
- Table 11: Brazil Crop Insurance Market Revenue (Million) Forecast, by Application 2019 & 2032
- Table 12: Argentina Crop Insurance Market Revenue (Million) Forecast, by Application 2019 & 2032
- Table 13: Rest of South America Crop Insurance Market Revenue (Million) Forecast, by Application 2019 & 2032
- Table 14: Global Crop Insurance Market Revenue Million Forecast, by Country 2019 & 2032
- Table 15: Germany Crop Insurance Market Revenue (Million) Forecast, by Application 2019 & 2032
- Table 16: France Crop Insurance Market Revenue (Million) Forecast, by Application 2019 & 2032
- Table 17: Italy Crop Insurance Market Revenue (Million) Forecast, by Application 2019 & 2032
- Table 18: United Kingdom Crop Insurance Market Revenue (Million) Forecast, by Application 2019 & 2032
- Table 19: Netherlands Crop Insurance Market Revenue (Million) Forecast, by Application 2019 & 2032
- Table 20: Sweden Crop Insurance Market Revenue (Million) Forecast, by Application 2019 & 2032
- Table 21: Rest of Europe Crop Insurance Market Revenue (Million) Forecast, by Application 2019 & 2032
- Table 22: Global Crop Insurance Market Revenue Million Forecast, by Country 2019 & 2032
- Table 23: China Crop Insurance Market Revenue (Million) Forecast, by Application 2019 & 2032
- Table 24: Japan Crop Insurance Market Revenue (Million) Forecast, by Application 2019 & 2032
- Table 25: India Crop Insurance Market Revenue (Million) Forecast, by Application 2019 & 2032
- Table 26: South Korea Crop Insurance Market Revenue (Million) Forecast, by Application 2019 & 2032
- Table 27: Taiwan Crop Insurance Market Revenue (Million) Forecast, by Application 2019 & 2032
- Table 28: Australia Crop Insurance Market Revenue (Million) Forecast, by Application 2019 & 2032
- Table 29: Rest of Asia-Pacific Crop Insurance Market Revenue (Million) Forecast, by Application 2019 & 2032
- Table 30: Global Crop Insurance Market Revenue Million Forecast, by Country 2019 & 2032
- Table 31: UAE Crop Insurance Market Revenue (Million) Forecast, by Application 2019 & 2032
- Table 32: South Africa Crop Insurance Market Revenue (Million) Forecast, by Application 2019 & 2032
- Table 33: Saudi Arabia Crop Insurance Market Revenue (Million) Forecast, by Application 2019 & 2032
- Table 34: Rest of MEA Crop Insurance Market Revenue (Million) Forecast, by Application 2019 & 2032
- Table 35: Global Crop Insurance Market Revenue Million Forecast, by Type 2019 & 2032
- Table 36: Global Crop Insurance Market Revenue Million Forecast, by Coverage 2019 & 2032
- Table 37: Global Crop Insurance Market Revenue Million Forecast, by Distribution Channel 2019 & 2032
- Table 38: Global Crop Insurance Market Revenue Million Forecast, by Country 2019 & 2032
- Table 39: United States Crop Insurance Market Revenue (Million) Forecast, by Application 2019 & 2032
- Table 40: Canada Crop Insurance Market Revenue (Million) Forecast, by Application 2019 & 2032
- Table 41: Mexico Crop Insurance Market Revenue (Million) Forecast, by Application 2019 & 2032
- Table 42: Global Crop Insurance Market Revenue Million Forecast, by Type 2019 & 2032
- Table 43: Global Crop Insurance Market Revenue Million Forecast, by Coverage 2019 & 2032
- Table 44: Global Crop Insurance Market Revenue Million Forecast, by Distribution Channel 2019 & 2032
- Table 45: Global Crop Insurance Market Revenue Million Forecast, by Country 2019 & 2032
- Table 46: Brazil Crop Insurance Market Revenue (Million) Forecast, by Application 2019 & 2032
- Table 47: Argentina Crop Insurance Market Revenue (Million) Forecast, by Application 2019 & 2032
- Table 48: Rest of South America Crop Insurance Market Revenue (Million) Forecast, by Application 2019 & 2032
- Table 49: Global Crop Insurance Market Revenue Million Forecast, by Type 2019 & 2032
- Table 50: Global Crop Insurance Market Revenue Million Forecast, by Coverage 2019 & 2032
- Table 51: Global Crop Insurance Market Revenue Million Forecast, by Distribution Channel 2019 & 2032
- Table 52: Global Crop Insurance Market Revenue Million Forecast, by Country 2019 & 2032
- Table 53: United Kingdom Crop Insurance Market Revenue (Million) Forecast, by Application 2019 & 2032
- Table 54: Germany Crop Insurance Market Revenue (Million) Forecast, by Application 2019 & 2032
- Table 55: France Crop Insurance Market Revenue (Million) Forecast, by Application 2019 & 2032
- Table 56: Italy Crop Insurance Market Revenue (Million) Forecast, by Application 2019 & 2032
- Table 57: Spain Crop Insurance Market Revenue (Million) Forecast, by Application 2019 & 2032
- Table 58: Russia Crop Insurance Market Revenue (Million) Forecast, by Application 2019 & 2032
- Table 59: Benelux Crop Insurance Market Revenue (Million) Forecast, by Application 2019 & 2032
- Table 60: Nordics Crop Insurance Market Revenue (Million) Forecast, by Application 2019 & 2032
- Table 61: Rest of Europe Crop Insurance Market Revenue (Million) Forecast, by Application 2019 & 2032
- Table 62: Global Crop Insurance Market Revenue Million Forecast, by Type 2019 & 2032
- Table 63: Global Crop Insurance Market Revenue Million Forecast, by Coverage 2019 & 2032
- Table 64: Global Crop Insurance Market Revenue Million Forecast, by Distribution Channel 2019 & 2032
- Table 65: Global Crop Insurance Market Revenue Million Forecast, by Country 2019 & 2032
- Table 66: Turkey Crop Insurance Market Revenue (Million) Forecast, by Application 2019 & 2032
- Table 67: Israel Crop Insurance Market Revenue (Million) Forecast, by Application 2019 & 2032
- Table 68: GCC Crop Insurance Market Revenue (Million) Forecast, by Application 2019 & 2032
- Table 69: North Africa Crop Insurance Market Revenue (Million) Forecast, by Application 2019 & 2032
- Table 70: South Africa Crop Insurance Market Revenue (Million) Forecast, by Application 2019 & 2032
- Table 71: Rest of Middle East & Africa Crop Insurance Market Revenue (Million) Forecast, by Application 2019 & 2032
- Table 72: Global Crop Insurance Market Revenue Million Forecast, by Type 2019 & 2032
- Table 73: Global Crop Insurance Market Revenue Million Forecast, by Coverage 2019 & 2032
- Table 74: Global Crop Insurance Market Revenue Million Forecast, by Distribution Channel 2019 & 2032
- Table 75: Global Crop Insurance Market Revenue Million Forecast, by Country 2019 & 2032
- Table 76: China Crop Insurance Market Revenue (Million) Forecast, by Application 2019 & 2032
- Table 77: India Crop Insurance Market Revenue (Million) Forecast, by Application 2019 & 2032
- Table 78: Japan Crop Insurance Market Revenue (Million) Forecast, by Application 2019 & 2032
- Table 79: South Korea Crop Insurance Market Revenue (Million) Forecast, by Application 2019 & 2032
- Table 80: ASEAN Crop Insurance Market Revenue (Million) Forecast, by Application 2019 & 2032
- Table 81: Oceania Crop Insurance Market Revenue (Million) Forecast, by Application 2019 & 2032
- Table 82: Rest of Asia Pacific Crop Insurance Market Revenue (Million) Forecast, by Application 2019 & 2032
Frequently Asked Questions
1. What is the projected Compound Annual Growth Rate (CAGR) of the Crop Insurance Market ?
The projected CAGR is approximately 5.77%.
2. Which companies are prominent players in the Crop Insurance Market ?
Key companies in the market include Sompo International Holdings Ltd, PICC, Fairfax Financial Holdings Limited, American Financial Group Inc, QBE Insurance Group Limited, ICICI Lombard General Insurance Company Limited, Zurich**List Not Exhaustive, Chubb, Tokio Marine HCC, Agriculture Insurance Company of India Limited (AIC).
3. What are the main segments of the Crop Insurance Market ?
The market segments include Type, Coverage, Distribution Channel.
4. Can you provide details about the market size?
The market size is estimated to be USD 38.10 Million as of 2022.
5. What are some drivers contributing to market growth?
Government Support. Including Subsidies and Initiatives. is a Significant Driver.
6. What are the notable trends driving market growth?
Increasing Value Crop Protection Globally.
7. Are there any restraints impacting market growth?
Instances of Fraud or Misreporting can Impact the Integrity of the Crop Insurance System.
8. Can you provide examples of recent developments in the market?
September 2023: The Shrimp Crop Insurance scheme developed by the Agricultural Insurance Company was launched in India. The insurance cover starts from the initial stage to 130 days till the shrimps are ready.
9. What pricing options are available for accessing the report?
Pricing options include single-user, multi-user, and enterprise licenses priced at USD 3800, USD 4500, and USD 5800 respectively.
10. Is the market size provided in terms of value or volume?
The market size is provided in terms of value, measured in Million.
11. Are there any specific market keywords associated with the report?
Yes, the market keyword associated with the report is "Crop Insurance Market ," which aids in identifying and referencing the specific market segment covered.
12. How do I determine which pricing option suits my needs best?
The pricing options vary based on user requirements and access needs. Individual users may opt for single-user licenses, while businesses requiring broader access may choose multi-user or enterprise licenses for cost-effective access to the report.
13. Are there any additional resources or data provided in the Crop Insurance Market report?
While the report offers comprehensive insights, it's advisable to review the specific contents or supplementary materials provided to ascertain if additional resources or data are available.
14. How can I stay updated on further developments or reports in the Crop Insurance Market ?
To stay informed about further developments, trends, and reports in the Crop Insurance Market , consider subscribing to industry newsletters, following relevant companies and organizations, or regularly checking reputable industry news sources and publications.
Methodology
Step 1 - Identification of Relevant Samples Size from Population Database


Step 2 - Approaches for Defining Global Market Size (Value, Volume* & Price*)

Note*: In applicable scenarios
Step 3 - Data Sources
Primary Research
- Web Analytics
- Survey Reports
- Research Institute
- Latest Research Reports
- Opinion Leaders
Secondary Research
- Annual Reports
- White Paper
- Latest Press Release
- Industry Association
- Paid Database
- Investor Presentations

Step 4 - Data Triangulation
Involves using different sources of information in order to increase the validity of a study
These sources are likely to be stakeholders in a program - participants, other researchers, program staff, other community members, and so on.
Then we put all data in single framework & apply various statistical tools to find out the dynamic on the market.
During the analysis stage, feedback from the stakeholder groups would be compared to determine areas of agreement as well as areas of divergence
