

Key Insights
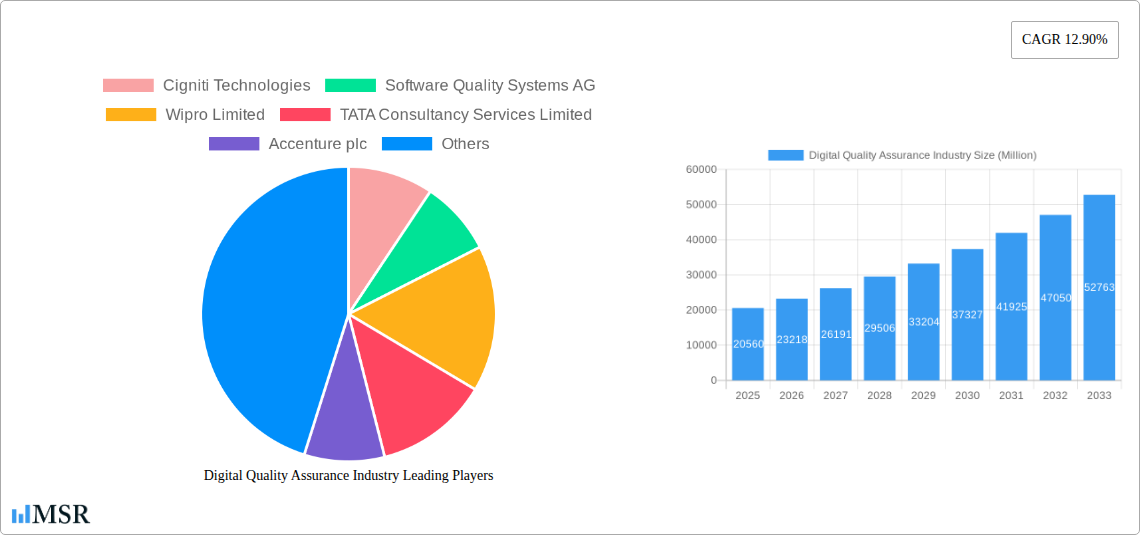
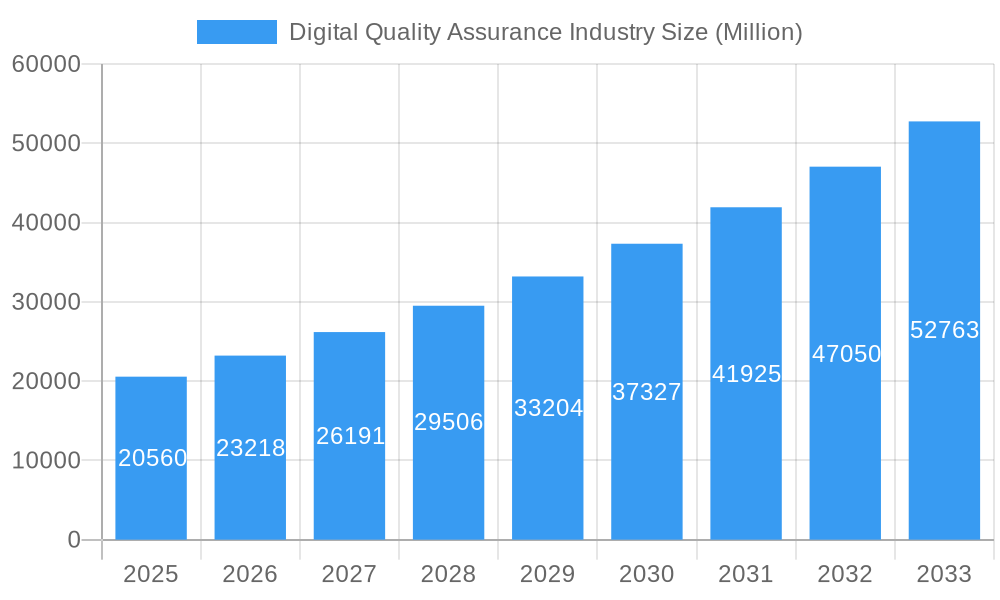
The Digital Quality Assurance (DQA) industry is experiencing robust expansion, projected to reach a significant market size of USD 20,560 Million by 2025, with a compelling Compound Annual Growth Rate (CAGR) of 12.90% over the forecast period of 2025-2033. This accelerated growth is primarily fueled by the increasing complexity of digital landscapes, the proliferation of sophisticated applications, and the paramount importance of delivering flawless user experiences. Businesses across all sectors are recognizing that comprehensive testing is no longer an option but a strategic imperative to maintain customer trust, brand reputation, and competitive advantage. The demand for agile and efficient DQA solutions is intensifying, driven by rapid software development cycles and the need to adapt to evolving technological paradigms like cloud computing, AI, and IoT. Furthermore, the growing cybersecurity threats necessitate robust security testing to safeguard sensitive data and critical infrastructure, further propelling market expansion.
Digital Quality Assurance Industry Market Size (In Billion)
Key segments are demonstrating substantial traction. Within testing types, Functional Testing Solutions and Performance & Usability Testing are leading the charge, reflecting the core need for reliable and user-friendly digital products. The shift towards Test Automation Deployment is a significant trend, offering increased efficiency, reduced costs, and faster time-to-market. This adoption is evident across various end-user verticals, with IT & Telecommunication, BFSI (Banking, Financial Services, and Insurance), and Healthcare emerging as major adopters due to their high reliance on robust and secure digital systems. Emerging markets in the Asia Pacific are expected to witness particularly dynamic growth, driven by digital transformation initiatives and a burgeoning tech ecosystem. While the market benefits from these strong drivers, potential restraints such as the shortage of skilled QA professionals and the initial investment costs for advanced automation tools could pose challenges, necessitating strategic talent development and cost-benefit analysis for organizations.
Digital Quality Assurance Industry Company Market Share
Digital Quality Assurance Industry: Comprehensive Market Analysis and Strategic Outlook (2019-2033)
This in-depth report offers a panoramic view of the global Digital Quality Assurance (DQA) industry, meticulously analyzing market dynamics, growth drivers, emerging trends, and competitive landscapes. Covering the historical period of 2019–2024 and projecting growth through 2033, with a base and estimated year of 2025, this report is an indispensable resource for industry stakeholders, investors, and strategists seeking to navigate this rapidly evolving sector. We provide granular insights into Software Testing, QA Services, Test Automation, Performance Testing, Security Testing, and API Testing across key verticals such as BFSI, Healthcare, IT & Telecommunication, and Government.
Digital Quality Assurance Industry Market Concentration & Dynamics
The Digital Quality Assurance industry exhibits a moderately consolidated market structure, characterized by strategic mergers, acquisitions, and partnerships aimed at expanding service portfolios and geographical reach. Innovation ecosystems are thriving, driven by the increasing demand for robust Software Quality Assurance and sophisticated Test Automation Deployment. Regulatory frameworks, particularly concerning data privacy and cybersecurity, are shaping the service offerings, pushing for enhanced Security Testing capabilities. Substitute products, such as in-house testing capabilities, exist but often fall short of the specialized expertise and scalability offered by leading DQA providers. End-user trends are heavily influenced by digital transformation initiatives, demanding continuous integration and delivery (CI/CD) pipelines and a strong focus on end-to-end QA Services. The increasing complexity of software applications necessitates advanced solutions for Functional Testing Solution, Performance & Usability Testing, and API Testing.
- Market Share Dynamics: Leading players command significant market share, with a concentrated group of top companies dominating the global DQA landscape.
- M&A Activities: The historical period has seen a consistent trend of strategic acquisitions, with an estimated XX major M&A deals in the last five years, focusing on acquiring niche expertise in areas like Cloud Testing and AI-driven QA.
- Innovation Ecosystems: Collaboration between DQA providers, technology vendors, and research institutions fosters a dynamic innovation landscape.
Digital Quality Assurance Industry Industry Insights & Trends
The Digital Quality Assurance industry is experiencing robust growth, projected to reach a market size of approximately XXX Million by 2033, with a Compound Annual Growth Rate (CAGR) of XX% during the forecast period of 2025–2033. This expansion is fueled by the relentless pace of digital transformation across all sectors, compelling organizations to prioritize Software Quality to ensure seamless user experiences and mitigate risks. The increasing adoption of cloud computing, big data analytics, and the Internet of Things (IoT) introduces complex testing requirements, driving demand for specialized QA Services. Furthermore, the rise of agile methodologies and DevOps practices necessitates continuous testing throughout the software development lifecycle, bolstering the adoption of Test Automation Deployment. Cybersecurity threats are escalating, making comprehensive Security Testing a non-negotiable aspect of DQA, leading to significant investments in this segment. The proliferation of APIs across applications and services also underscores the growing importance of thorough API Testing to ensure interoperability and data integrity. The evolving consumer behaviors, with heightened expectations for application performance and reliability, further propels the need for sophisticated Performance & Usability Testing.
Key Markets & Segments Leading Digital Quality Assurance Industry
The global Digital Quality Assurance industry is witnessing significant traction across various regions and segments. North America and Europe currently lead in terms of market share, driven by mature economies with high digital adoption rates and stringent regulatory environments demanding robust QA Services. Asia-Pacific is emerging as a high-growth region, fueled by rapid digital transformation initiatives and a burgeoning IT services sector.
Dominant Segments by Testing Type:
- Functional Testing Solution: This foundational segment remains crucial, ensuring applications meet specified requirements. Its dominance is driven by the fundamental need for bug-free software across all verticals.
- Performance & Usability Testing: With increasing user expectations for speed and ease of use, this segment is experiencing substantial growth, particularly in e-commerce and mobile applications.
- Security Testing: The escalating threat landscape has propelled Security Testing to the forefront, becoming a critical component of DQA strategies across all industries, especially BFSI and Government.
- API Testing: The microservices architecture and interconnectedness of applications make API Testing indispensable for ensuring seamless data exchange and integration.
- Network Testing: Crucial for organizations relying on robust network infrastructure, this segment is vital for industries like IT & Telecommunication and Government.
Dominant Segments by Testing Mode:
- Test Automation Deployment: This segment is witnessing exponential growth due to its efficiency, speed, and scalability benefits, enabling faster release cycles for Software Testing.
- Manual Testing Deployment: While automation is gaining ground, manual testing remains vital for exploratory testing, usability assessments, and scenarios where human intuition is paramount.
Dominant End-User Verticals:
- IT & Telecommunication: As a technology-driven sector, it consistently invests in DQA to ensure the reliability and performance of its complex offerings.
- BFSI (Banking, Financial Services, and Insurance): High transaction volumes, stringent security requirements, and regulatory compliance mandates make DQA a critical function.
- Healthcare: The increasing digitization of patient records and medical devices necessitates rigorous testing for data security, privacy, and device functionality.
- Government: With the growing implementation of e-governance initiatives, the demand for secure and reliable digital services drives significant DQA investments.
- Manufacturing: The integration of IoT and automation in smart factories increases the reliance on robust software, making DQA crucial for operational efficiency and safety.
- Media & Entertainment: The demand for high-quality streaming services and interactive platforms drives the need for extensive performance and usability testing.
Digital Quality Assurance Industry Product Developments
Product development in the Digital Quality Assurance industry is rapidly advancing, focusing on AI-powered test automation, predictive analytics for defect identification, and intelligent test case generation. Companies are innovating in areas such as codeless test automation platforms, blockchain-based testing solutions for enhanced security and transparency, and virtualized testing environments for complex system integrations. These advancements enable faster, more efficient, and comprehensive testing, providing a significant competitive edge.
Challenges in the Digital Quality Assurance Industry Market
The Digital Quality Assurance industry faces several challenges, including the increasing complexity of software architectures, the shortage of skilled QA professionals, and the ever-evolving threat landscape that demands constant adaptation of Security Testing strategies. Budgetary constraints in some organizations can also limit investments in advanced DQA tools and services. Furthermore, the pressure for faster release cycles can sometimes compromise the thoroughness of Software Testing.
Forces Driving Digital Quality Assurance Industry Growth
Several forces are propelling the growth of the Digital Quality Assurance industry. The global push towards digital transformation is paramount, requiring businesses to ensure the quality of their digital offerings. The increasing sophistication of cyber threats necessitates robust Security Testing and compliance. The adoption of Agile and DevOps methodologies inherently demands continuous integration and testing, driving the adoption of Test Automation Deployment. Furthermore, the proliferation of mobile devices and applications creates a vast market for Performance & Usability Testing.
Challenges in the Digital Quality Assurance Industry Market
Long-term growth catalysts for the Digital Quality Assurance industry include the pervasive adoption of AI and Machine Learning in test automation, leading to more intelligent and efficient testing processes. The expansion of cloud-native application development and the growth of IoT devices present new frontiers for specialized testing services. Strategic partnerships between DQA providers and cloud platform vendors, as well as enterprise software providers, will further accelerate market penetration and innovation.
Emerging Opportunities in Digital Quality Assurance Industry
Emerging opportunities in the Digital Quality Assurance industry lie in the burgeoning markets for IoT testing, blockchain testing, and AI-driven QA solutions. The increasing demand for compliance in regulated industries like healthcare and finance presents a significant opportunity for specialized testing services. Furthermore, the shift towards low-code/no-code platforms opens avenues for new approaches to testing and quality assurance. The rise of the metaverse and extended reality (XR) applications also signals new testing paradigms.
Leading Players in the Digital Quality Assurance Industry Sector
- Cigniti Technologies
- Software Quality Systems AG
- Wipro Limited
- TATA Consultancy Services Limited
- Accenture plc
- Hexaware Technologies
- Capgemini SE
- Thinksys Inc
- DXC Technology Company
- Atos SE
- Sixth Gear Studios
- Micro Focus
- Maven Infosoft Pvt Ltd
Key Milestones in Digital Quality Assurance Industry Industry
- September 2022: Cigniti Technologies, an AI and IP-led digital assurance and engineering services company, opened a new born intensive care unit (NICU) and special newborn care unit (SNCU) facility at the Mother and Child Health Center (MCHC) in Hyderabad's Nalgonda district. This initiative addressed the shortage of NICU/SNCU beds and provided critical medical equipment, showcasing a commitment to corporate social responsibility and community support beyond core business operations.
- February 2022: ProArch acquired Enhops, a USA-based cloud consulting, data, cybersecurity, and product engineering services provider. The integration of 120 Enhops employees significantly boosted ProArch's quality assurance competence, expanding its software testing capabilities and product engineering practice, demonstrating strategic M&A activity focused on enhancing service offerings.
Strategic Outlook for Digital Quality Assurance Industry Market
The strategic outlook for the Digital Quality Assurance industry remains exceptionally bright. Continued investment in AI and ML-driven automation will be crucial for maintaining a competitive edge. Expanding service offerings to include specialized testing for emerging technologies like blockchain and IoT will unlock new revenue streams. Strategic partnerships and acquisitions will continue to shape the market, allowing companies to consolidate market share and gain access to new expertise. Focusing on niche verticals with stringent quality requirements will also be a key growth accelerator.
Digital Quality Assurance Industry Segmentation
-
1. Testing Type
- 1.1. Functional Testing Solution
- 1.2. Performance & Usability Testing
- 1.3. Security Testing
- 1.4. API Testing
- 1.5. Network Testing
-
2. Testing Mode
- 2.1. Manual Testing Deployment
- 2.2. Test Automation Deployment
-
3. End-user Verticals
- 3.1. Government
- 3.2. BFSI
- 3.3. Healthcare
- 3.4. Manufacturing
- 3.5. IT & Telecommunication
- 3.6. Media & Entertainment
- 3.7. Others End-Users
Digital Quality Assurance Industry Segmentation By Geography
- 1. North America
- 2. Europe
- 3. Asia Pacific
- 4. Latin America
- 5. Middle East
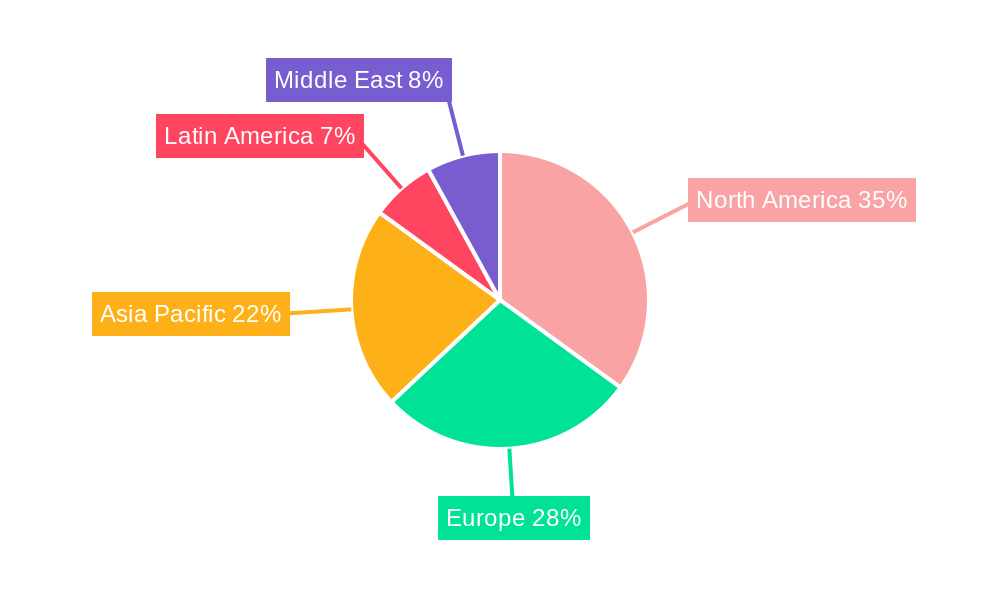
Digital Quality Assurance Industry Regional Market Share
Geographic Coverage of Digital Quality Assurance Industry
Digital Quality Assurance Industry REPORT HIGHLIGHTS
| Aspects | Details |
|---|---|
| Study Period | 2020-2034 |
| Base Year | 2025 |
| Estimated Year | 2026 |
| Forecast Period | 2026-2034 |
| Historical Period | 2020-2025 |
| Growth Rate | CAGR of 25.2% from 2020-2034 |
| Segmentation |
|
Table of Contents
- 1. Introduction
- 1.1. Research Scope
- 1.2. Market Segmentation
- 1.3. Research Objective
- 1.4. Definitions and Assumptions
- 2. Executive Summary
- 2.1. Market Snapshot
- 3. Market Dynamics
- 3.1. Market Drivers
- 3.2. Market Restrains
- 3.3. Market Trends
- 3.4. Market Opportunities
- 4. Market Factor Analysis
- 4.1. Porters Five Forces
- 4.1.1. Bargaining Power of Suppliers
- 4.1.2. Bargaining Power of Buyers
- 4.1.3. Threat of New Entrants
- 4.1.4. Threat of Substitutes
- 4.1.5. Competitive Rivalry
- 4.2. PESTEL analysis
- 4.3. BCG Analysis
- 4.3.1. Stars (High Growth, High Market Share)
- 4.3.2. Cash Cows (Low Growth, High Market Share)
- 4.3.3. Question Mark (High Growth, Low Market Share)
- 4.3.4. Dogs (Low Growth, Low Market Share)
- 4.4. Ansoff Matrix Analysis
- 4.5. Supply Chain Analysis
- 4.6. Regulatory Landscape
- 4.7. Current Market Potential and Opportunity Assessment (TAM–SAM–SOM Framework)
- 4.8. MSR Analyst Note
- 4.1. Porters Five Forces
- 5. Market Analysis, Insights and Forecast 2021-2033
- 5.1. Market Analysis, Insights and Forecast - by Testing Type
- 5.1.1. Functional Testing Solution
- 5.1.2. Performance & Usability Testing
- 5.1.3. Security Testing
- 5.1.4. API Testing
- 5.1.5. Network Testing
- 5.2. Market Analysis, Insights and Forecast - by Testing Mode
- 5.2.1. Manual Testing Deployment
- 5.2.2. Test Automation Deployment
- 5.3. Market Analysis, Insights and Forecast - by End-user Verticals
- 5.3.1. Government
- 5.3.2. BFSI
- 5.3.3. Healthcare
- 5.3.4. Manufacturing
- 5.3.5. IT & Telecommunication
- 5.3.6. Media & Entertainment
- 5.3.7. Others End-Users
- 5.4. Market Analysis, Insights and Forecast - by Region
- 5.4.1. North America
- 5.4.2. Europe
- 5.4.3. Asia Pacific
- 5.4.4. Latin America
- 5.4.5. Middle East
- 5.1. Market Analysis, Insights and Forecast - by Testing Type
- 6. Global Digital Quality Assurance Industry Analysis, Insights and Forecast, 2021-2033
- 6.1. Market Analysis, Insights and Forecast - by Testing Type
- 6.1.1. Functional Testing Solution
- 6.1.2. Performance & Usability Testing
- 6.1.3. Security Testing
- 6.1.4. API Testing
- 6.1.5. Network Testing
- 6.2. Market Analysis, Insights and Forecast - by Testing Mode
- 6.2.1. Manual Testing Deployment
- 6.2.2. Test Automation Deployment
- 6.3. Market Analysis, Insights and Forecast - by End-user Verticals
- 6.3.1. Government
- 6.3.2. BFSI
- 6.3.3. Healthcare
- 6.3.4. Manufacturing
- 6.3.5. IT & Telecommunication
- 6.3.6. Media & Entertainment
- 6.3.7. Others End-Users
- 6.1. Market Analysis, Insights and Forecast - by Testing Type
- 7. North America Digital Quality Assurance Industry Analysis, Insights and Forecast, 2020-2032
- 7.1. Market Analysis, Insights and Forecast - by Testing Type
- 7.1.1. Functional Testing Solution
- 7.1.2. Performance & Usability Testing
- 7.1.3. Security Testing
- 7.1.4. API Testing
- 7.1.5. Network Testing
- 7.2. Market Analysis, Insights and Forecast - by Testing Mode
- 7.2.1. Manual Testing Deployment
- 7.2.2. Test Automation Deployment
- 7.3. Market Analysis, Insights and Forecast - by End-user Verticals
- 7.3.1. Government
- 7.3.2. BFSI
- 7.3.3. Healthcare
- 7.3.4. Manufacturing
- 7.3.5. IT & Telecommunication
- 7.3.6. Media & Entertainment
- 7.3.7. Others End-Users
- 7.1. Market Analysis, Insights and Forecast - by Testing Type
- 8. Europe Digital Quality Assurance Industry Analysis, Insights and Forecast, 2020-2032
- 8.1. Market Analysis, Insights and Forecast - by Testing Type
- 8.1.1. Functional Testing Solution
- 8.1.2. Performance & Usability Testing
- 8.1.3. Security Testing
- 8.1.4. API Testing
- 8.1.5. Network Testing
- 8.2. Market Analysis, Insights and Forecast - by Testing Mode
- 8.2.1. Manual Testing Deployment
- 8.2.2. Test Automation Deployment
- 8.3. Market Analysis, Insights and Forecast - by End-user Verticals
- 8.3.1. Government
- 8.3.2. BFSI
- 8.3.3. Healthcare
- 8.3.4. Manufacturing
- 8.3.5. IT & Telecommunication
- 8.3.6. Media & Entertainment
- 8.3.7. Others End-Users
- 8.1. Market Analysis, Insights and Forecast - by Testing Type
- 9. Asia Pacific Digital Quality Assurance Industry Analysis, Insights and Forecast, 2020-2032
- 9.1. Market Analysis, Insights and Forecast - by Testing Type
- 9.1.1. Functional Testing Solution
- 9.1.2. Performance & Usability Testing
- 9.1.3. Security Testing
- 9.1.4. API Testing
- 9.1.5. Network Testing
- 9.2. Market Analysis, Insights and Forecast - by Testing Mode
- 9.2.1. Manual Testing Deployment
- 9.2.2. Test Automation Deployment
- 9.3. Market Analysis, Insights and Forecast - by End-user Verticals
- 9.3.1. Government
- 9.3.2. BFSI
- 9.3.3. Healthcare
- 9.3.4. Manufacturing
- 9.3.5. IT & Telecommunication
- 9.3.6. Media & Entertainment
- 9.3.7. Others End-Users
- 9.1. Market Analysis, Insights and Forecast - by Testing Type
- 10. Latin America Digital Quality Assurance Industry Analysis, Insights and Forecast, 2020-2032
- 10.1. Market Analysis, Insights and Forecast - by Testing Type
- 10.1.1. Functional Testing Solution
- 10.1.2. Performance & Usability Testing
- 10.1.3. Security Testing
- 10.1.4. API Testing
- 10.1.5. Network Testing
- 10.2. Market Analysis, Insights and Forecast - by Testing Mode
- 10.2.1. Manual Testing Deployment
- 10.2.2. Test Automation Deployment
- 10.3. Market Analysis, Insights and Forecast - by End-user Verticals
- 10.3.1. Government
- 10.3.2. BFSI
- 10.3.3. Healthcare
- 10.3.4. Manufacturing
- 10.3.5. IT & Telecommunication
- 10.3.6. Media & Entertainment
- 10.3.7. Others End-Users
- 10.1. Market Analysis, Insights and Forecast - by Testing Type
- 11. Middle East Digital Quality Assurance Industry Analysis, Insights and Forecast, 2020-2032
- 11.1. Market Analysis, Insights and Forecast - by Testing Type
- 11.1.1. Functional Testing Solution
- 11.1.2. Performance & Usability Testing
- 11.1.3. Security Testing
- 11.1.4. API Testing
- 11.1.5. Network Testing
- 11.2. Market Analysis, Insights and Forecast - by Testing Mode
- 11.2.1. Manual Testing Deployment
- 11.2.2. Test Automation Deployment
- 11.3. Market Analysis, Insights and Forecast - by End-user Verticals
- 11.3.1. Government
- 11.3.2. BFSI
- 11.3.3. Healthcare
- 11.3.4. Manufacturing
- 11.3.5. IT & Telecommunication
- 11.3.6. Media & Entertainment
- 11.3.7. Others End-Users
- 11.1. Market Analysis, Insights and Forecast - by Testing Type
- 12. Competitive Analysis
- 12.1. Company Profiles
- 12.1.1 Cigniti Technologies
- 12.1.1.1. Company Overview
- 12.1.1.2. Products
- 12.1.1.3. Company Financials
- 12.1.1.4. SWOT Analysis
- 12.1.2 Software Quality Systems AG
- 12.1.2.1. Company Overview
- 12.1.2.2. Products
- 12.1.2.3. Company Financials
- 12.1.2.4. SWOT Analysis
- 12.1.3 Wipro Limited
- 12.1.3.1. Company Overview
- 12.1.3.2. Products
- 12.1.3.3. Company Financials
- 12.1.3.4. SWOT Analysis
- 12.1.4 TATA Consultancy Services Limited
- 12.1.4.1. Company Overview
- 12.1.4.2. Products
- 12.1.4.3. Company Financials
- 12.1.4.4. SWOT Analysis
- 12.1.5 Accenture plc
- 12.1.5.1. Company Overview
- 12.1.5.2. Products
- 12.1.5.3. Company Financials
- 12.1.5.4. SWOT Analysis
- 12.1.6 Hexaware Technologies
- 12.1.6.1. Company Overview
- 12.1.6.2. Products
- 12.1.6.3. Company Financials
- 12.1.6.4. SWOT Analysis
- 12.1.7 Capgemini SE
- 12.1.7.1. Company Overview
- 12.1.7.2. Products
- 12.1.7.3. Company Financials
- 12.1.7.4. SWOT Analysis
- 12.1.8 Thinksys Inc
- 12.1.8.1. Company Overview
- 12.1.8.2. Products
- 12.1.8.3. Company Financials
- 12.1.8.4. SWOT Analysis
- 12.1.9 DXC Technology Company
- 12.1.9.1. Company Overview
- 12.1.9.2. Products
- 12.1.9.3. Company Financials
- 12.1.9.4. SWOT Analysis
- 12.1.10 Atos SE
- 12.1.10.1. Company Overview
- 12.1.10.2. Products
- 12.1.10.3. Company Financials
- 12.1.10.4. SWOT Analysis
- 12.1.11 Sixth Gear Studios
- 12.1.11.1. Company Overview
- 12.1.11.2. Products
- 12.1.11.3. Company Financials
- 12.1.11.4. SWOT Analysis
- 12.1.12 Micro Focus
- 12.1.12.1. Company Overview
- 12.1.12.2. Products
- 12.1.12.3. Company Financials
- 12.1.12.4. SWOT Analysis
- 12.1.13 Maven Infosoft Pvt Ltd
- 12.1.13.1. Company Overview
- 12.1.13.2. Products
- 12.1.13.3. Company Financials
- 12.1.13.4. SWOT Analysis
- 12.1.1 Cigniti Technologies
- 12.2. Market Entropy
- 12.2.1 Company's Key Areas Served
- 12.2.2 Recent Developments
- 12.3. Company Market Share Analysis 2025
- 12.3.1 Top 5 Companies Market Share Analysis
- 12.3.2 Top 3 Companies Market Share Analysis
- 12.4. List of Potential Customers
- 13. Research Methodology
List of Figures
- Figure 1: Global Digital Quality Assurance Industry Revenue Breakdown (billion, %) by Region 2025 & 2033
- Figure 2: Global Digital Quality Assurance Industry Volume Breakdown (K Unit, %) by Region 2025 & 2033
- Figure 3: North America Digital Quality Assurance Industry Revenue (billion), by Testing Type 2025 & 2033
- Figure 4: North America Digital Quality Assurance Industry Volume (K Unit), by Testing Type 2025 & 2033
- Figure 5: North America Digital Quality Assurance Industry Revenue Share (%), by Testing Type 2025 & 2033
- Figure 6: North America Digital Quality Assurance Industry Volume Share (%), by Testing Type 2025 & 2033
- Figure 7: North America Digital Quality Assurance Industry Revenue (billion), by Testing Mode 2025 & 2033
- Figure 8: North America Digital Quality Assurance Industry Volume (K Unit), by Testing Mode 2025 & 2033
- Figure 9: North America Digital Quality Assurance Industry Revenue Share (%), by Testing Mode 2025 & 2033
- Figure 10: North America Digital Quality Assurance Industry Volume Share (%), by Testing Mode 2025 & 2033
- Figure 11: North America Digital Quality Assurance Industry Revenue (billion), by End-user Verticals 2025 & 2033
- Figure 12: North America Digital Quality Assurance Industry Volume (K Unit), by End-user Verticals 2025 & 2033
- Figure 13: North America Digital Quality Assurance Industry Revenue Share (%), by End-user Verticals 2025 & 2033
- Figure 14: North America Digital Quality Assurance Industry Volume Share (%), by End-user Verticals 2025 & 2033
- Figure 15: North America Digital Quality Assurance Industry Revenue (billion), by Country 2025 & 2033
- Figure 16: North America Digital Quality Assurance Industry Volume (K Unit), by Country 2025 & 2033
- Figure 17: North America Digital Quality Assurance Industry Revenue Share (%), by Country 2025 & 2033
- Figure 18: North America Digital Quality Assurance Industry Volume Share (%), by Country 2025 & 2033
- Figure 19: Europe Digital Quality Assurance Industry Revenue (billion), by Testing Type 2025 & 2033
- Figure 20: Europe Digital Quality Assurance Industry Volume (K Unit), by Testing Type 2025 & 2033
- Figure 21: Europe Digital Quality Assurance Industry Revenue Share (%), by Testing Type 2025 & 2033
- Figure 22: Europe Digital Quality Assurance Industry Volume Share (%), by Testing Type 2025 & 2033
- Figure 23: Europe Digital Quality Assurance Industry Revenue (billion), by Testing Mode 2025 & 2033
- Figure 24: Europe Digital Quality Assurance Industry Volume (K Unit), by Testing Mode 2025 & 2033
- Figure 25: Europe Digital Quality Assurance Industry Revenue Share (%), by Testing Mode 2025 & 2033
- Figure 26: Europe Digital Quality Assurance Industry Volume Share (%), by Testing Mode 2025 & 2033
- Figure 27: Europe Digital Quality Assurance Industry Revenue (billion), by End-user Verticals 2025 & 2033
- Figure 28: Europe Digital Quality Assurance Industry Volume (K Unit), by End-user Verticals 2025 & 2033
- Figure 29: Europe Digital Quality Assurance Industry Revenue Share (%), by End-user Verticals 2025 & 2033
- Figure 30: Europe Digital Quality Assurance Industry Volume Share (%), by End-user Verticals 2025 & 2033
- Figure 31: Europe Digital Quality Assurance Industry Revenue (billion), by Country 2025 & 2033
- Figure 32: Europe Digital Quality Assurance Industry Volume (K Unit), by Country 2025 & 2033
- Figure 33: Europe Digital Quality Assurance Industry Revenue Share (%), by Country 2025 & 2033
- Figure 34: Europe Digital Quality Assurance Industry Volume Share (%), by Country 2025 & 2033
- Figure 35: Asia Pacific Digital Quality Assurance Industry Revenue (billion), by Testing Type 2025 & 2033
- Figure 36: Asia Pacific Digital Quality Assurance Industry Volume (K Unit), by Testing Type 2025 & 2033
- Figure 37: Asia Pacific Digital Quality Assurance Industry Revenue Share (%), by Testing Type 2025 & 2033
- Figure 38: Asia Pacific Digital Quality Assurance Industry Volume Share (%), by Testing Type 2025 & 2033
- Figure 39: Asia Pacific Digital Quality Assurance Industry Revenue (billion), by Testing Mode 2025 & 2033
- Figure 40: Asia Pacific Digital Quality Assurance Industry Volume (K Unit), by Testing Mode 2025 & 2033
- Figure 41: Asia Pacific Digital Quality Assurance Industry Revenue Share (%), by Testing Mode 2025 & 2033
- Figure 42: Asia Pacific Digital Quality Assurance Industry Volume Share (%), by Testing Mode 2025 & 2033
- Figure 43: Asia Pacific Digital Quality Assurance Industry Revenue (billion), by End-user Verticals 2025 & 2033
- Figure 44: Asia Pacific Digital Quality Assurance Industry Volume (K Unit), by End-user Verticals 2025 & 2033
- Figure 45: Asia Pacific Digital Quality Assurance Industry Revenue Share (%), by End-user Verticals 2025 & 2033
- Figure 46: Asia Pacific Digital Quality Assurance Industry Volume Share (%), by End-user Verticals 2025 & 2033
- Figure 47: Asia Pacific Digital Quality Assurance Industry Revenue (billion), by Country 2025 & 2033
- Figure 48: Asia Pacific Digital Quality Assurance Industry Volume (K Unit), by Country 2025 & 2033
- Figure 49: Asia Pacific Digital Quality Assurance Industry Revenue Share (%), by Country 2025 & 2033
- Figure 50: Asia Pacific Digital Quality Assurance Industry Volume Share (%), by Country 2025 & 2033
- Figure 51: Latin America Digital Quality Assurance Industry Revenue (billion), by Testing Type 2025 & 2033
- Figure 52: Latin America Digital Quality Assurance Industry Volume (K Unit), by Testing Type 2025 & 2033
- Figure 53: Latin America Digital Quality Assurance Industry Revenue Share (%), by Testing Type 2025 & 2033
- Figure 54: Latin America Digital Quality Assurance Industry Volume Share (%), by Testing Type 2025 & 2033
- Figure 55: Latin America Digital Quality Assurance Industry Revenue (billion), by Testing Mode 2025 & 2033
- Figure 56: Latin America Digital Quality Assurance Industry Volume (K Unit), by Testing Mode 2025 & 2033
- Figure 57: Latin America Digital Quality Assurance Industry Revenue Share (%), by Testing Mode 2025 & 2033
- Figure 58: Latin America Digital Quality Assurance Industry Volume Share (%), by Testing Mode 2025 & 2033
- Figure 59: Latin America Digital Quality Assurance Industry Revenue (billion), by End-user Verticals 2025 & 2033
- Figure 60: Latin America Digital Quality Assurance Industry Volume (K Unit), by End-user Verticals 2025 & 2033
- Figure 61: Latin America Digital Quality Assurance Industry Revenue Share (%), by End-user Verticals 2025 & 2033
- Figure 62: Latin America Digital Quality Assurance Industry Volume Share (%), by End-user Verticals 2025 & 2033
- Figure 63: Latin America Digital Quality Assurance Industry Revenue (billion), by Country 2025 & 2033
- Figure 64: Latin America Digital Quality Assurance Industry Volume (K Unit), by Country 2025 & 2033
- Figure 65: Latin America Digital Quality Assurance Industry Revenue Share (%), by Country 2025 & 2033
- Figure 66: Latin America Digital Quality Assurance Industry Volume Share (%), by Country 2025 & 2033
- Figure 67: Middle East Digital Quality Assurance Industry Revenue (billion), by Testing Type 2025 & 2033
- Figure 68: Middle East Digital Quality Assurance Industry Volume (K Unit), by Testing Type 2025 & 2033
- Figure 69: Middle East Digital Quality Assurance Industry Revenue Share (%), by Testing Type 2025 & 2033
- Figure 70: Middle East Digital Quality Assurance Industry Volume Share (%), by Testing Type 2025 & 2033
- Figure 71: Middle East Digital Quality Assurance Industry Revenue (billion), by Testing Mode 2025 & 2033
- Figure 72: Middle East Digital Quality Assurance Industry Volume (K Unit), by Testing Mode 2025 & 2033
- Figure 73: Middle East Digital Quality Assurance Industry Revenue Share (%), by Testing Mode 2025 & 2033
- Figure 74: Middle East Digital Quality Assurance Industry Volume Share (%), by Testing Mode 2025 & 2033
- Figure 75: Middle East Digital Quality Assurance Industry Revenue (billion), by End-user Verticals 2025 & 2033
- Figure 76: Middle East Digital Quality Assurance Industry Volume (K Unit), by End-user Verticals 2025 & 2033
- Figure 77: Middle East Digital Quality Assurance Industry Revenue Share (%), by End-user Verticals 2025 & 2033
- Figure 78: Middle East Digital Quality Assurance Industry Volume Share (%), by End-user Verticals 2025 & 2033
- Figure 79: Middle East Digital Quality Assurance Industry Revenue (billion), by Country 2025 & 2033
- Figure 80: Middle East Digital Quality Assurance Industry Volume (K Unit), by Country 2025 & 2033
- Figure 81: Middle East Digital Quality Assurance Industry Revenue Share (%), by Country 2025 & 2033
- Figure 82: Middle East Digital Quality Assurance Industry Volume Share (%), by Country 2025 & 2033
List of Tables
- Table 1: Global Digital Quality Assurance Industry Revenue billion Forecast, by Testing Type 2020 & 2033
- Table 2: Global Digital Quality Assurance Industry Volume K Unit Forecast, by Testing Type 2020 & 2033
- Table 3: Global Digital Quality Assurance Industry Revenue billion Forecast, by Testing Mode 2020 & 2033
- Table 4: Global Digital Quality Assurance Industry Volume K Unit Forecast, by Testing Mode 2020 & 2033
- Table 5: Global Digital Quality Assurance Industry Revenue billion Forecast, by End-user Verticals 2020 & 2033
- Table 6: Global Digital Quality Assurance Industry Volume K Unit Forecast, by End-user Verticals 2020 & 2033
- Table 7: Global Digital Quality Assurance Industry Revenue billion Forecast, by Region 2020 & 2033
- Table 8: Global Digital Quality Assurance Industry Volume K Unit Forecast, by Region 2020 & 2033
- Table 9: Global Digital Quality Assurance Industry Revenue billion Forecast, by Testing Type 2020 & 2033
- Table 10: Global Digital Quality Assurance Industry Volume K Unit Forecast, by Testing Type 2020 & 2033
- Table 11: Global Digital Quality Assurance Industry Revenue billion Forecast, by Testing Mode 2020 & 2033
- Table 12: Global Digital Quality Assurance Industry Volume K Unit Forecast, by Testing Mode 2020 & 2033
- Table 13: Global Digital Quality Assurance Industry Revenue billion Forecast, by End-user Verticals 2020 & 2033
- Table 14: Global Digital Quality Assurance Industry Volume K Unit Forecast, by End-user Verticals 2020 & 2033
- Table 15: Global Digital Quality Assurance Industry Revenue billion Forecast, by Country 2020 & 2033
- Table 16: Global Digital Quality Assurance Industry Volume K Unit Forecast, by Country 2020 & 2033
- Table 17: Global Digital Quality Assurance Industry Revenue billion Forecast, by Testing Type 2020 & 2033
- Table 18: Global Digital Quality Assurance Industry Volume K Unit Forecast, by Testing Type 2020 & 2033
- Table 19: Global Digital Quality Assurance Industry Revenue billion Forecast, by Testing Mode 2020 & 2033
- Table 20: Global Digital Quality Assurance Industry Volume K Unit Forecast, by Testing Mode 2020 & 2033
- Table 21: Global Digital Quality Assurance Industry Revenue billion Forecast, by End-user Verticals 2020 & 2033
- Table 22: Global Digital Quality Assurance Industry Volume K Unit Forecast, by End-user Verticals 2020 & 2033
- Table 23: Global Digital Quality Assurance Industry Revenue billion Forecast, by Country 2020 & 2033
- Table 24: Global Digital Quality Assurance Industry Volume K Unit Forecast, by Country 2020 & 2033
- Table 25: Global Digital Quality Assurance Industry Revenue billion Forecast, by Testing Type 2020 & 2033
- Table 26: Global Digital Quality Assurance Industry Volume K Unit Forecast, by Testing Type 2020 & 2033
- Table 27: Global Digital Quality Assurance Industry Revenue billion Forecast, by Testing Mode 2020 & 2033
- Table 28: Global Digital Quality Assurance Industry Volume K Unit Forecast, by Testing Mode 2020 & 2033
- Table 29: Global Digital Quality Assurance Industry Revenue billion Forecast, by End-user Verticals 2020 & 2033
- Table 30: Global Digital Quality Assurance Industry Volume K Unit Forecast, by End-user Verticals 2020 & 2033
- Table 31: Global Digital Quality Assurance Industry Revenue billion Forecast, by Country 2020 & 2033
- Table 32: Global Digital Quality Assurance Industry Volume K Unit Forecast, by Country 2020 & 2033
- Table 33: Global Digital Quality Assurance Industry Revenue billion Forecast, by Testing Type 2020 & 2033
- Table 34: Global Digital Quality Assurance Industry Volume K Unit Forecast, by Testing Type 2020 & 2033
- Table 35: Global Digital Quality Assurance Industry Revenue billion Forecast, by Testing Mode 2020 & 2033
- Table 36: Global Digital Quality Assurance Industry Volume K Unit Forecast, by Testing Mode 2020 & 2033
- Table 37: Global Digital Quality Assurance Industry Revenue billion Forecast, by End-user Verticals 2020 & 2033
- Table 38: Global Digital Quality Assurance Industry Volume K Unit Forecast, by End-user Verticals 2020 & 2033
- Table 39: Global Digital Quality Assurance Industry Revenue billion Forecast, by Country 2020 & 2033
- Table 40: Global Digital Quality Assurance Industry Volume K Unit Forecast, by Country 2020 & 2033
- Table 41: Global Digital Quality Assurance Industry Revenue billion Forecast, by Testing Type 2020 & 2033
- Table 42: Global Digital Quality Assurance Industry Volume K Unit Forecast, by Testing Type 2020 & 2033
- Table 43: Global Digital Quality Assurance Industry Revenue billion Forecast, by Testing Mode 2020 & 2033
- Table 44: Global Digital Quality Assurance Industry Volume K Unit Forecast, by Testing Mode 2020 & 2033
- Table 45: Global Digital Quality Assurance Industry Revenue billion Forecast, by End-user Verticals 2020 & 2033
- Table 46: Global Digital Quality Assurance Industry Volume K Unit Forecast, by End-user Verticals 2020 & 2033
- Table 47: Global Digital Quality Assurance Industry Revenue billion Forecast, by Country 2020 & 2033
- Table 48: Global Digital Quality Assurance Industry Volume K Unit Forecast, by Country 2020 & 2033
Frequently Asked Questions
1. What is the projected Compound Annual Growth Rate (CAGR) of the Digital Quality Assurance Industry?
The projected CAGR is approximately 25.2%.
2. Which companies are prominent players in the Digital Quality Assurance Industry?
Key companies in the market include Cigniti Technologies, Software Quality Systems AG, Wipro Limited, TATA Consultancy Services Limited, Accenture plc, Hexaware Technologies, Capgemini SE, Thinksys Inc, DXC Technology Company, Atos SE, Sixth Gear Studios, Micro Focus, Maven Infosoft Pvt Ltd.
3. What are the main segments of the Digital Quality Assurance Industry?
The market segments include Testing Type, Testing Mode, End-user Verticals.
4. Can you provide details about the market size?
The market size is estimated to be USD 7.42 billion as of 2022.
5. What are some drivers contributing to market growth?
Growing Need of API Monitoring in the Digital Economy; The Increasing Use of Test Automation Leads to Lower the Operational Costs and Enhance the QA.
6. What are the notable trends driving market growth?
Healthcare sector is expected to register significant growth.
7. Are there any restraints impacting market growth?
High Initial Setup Cost; Large Installation Space.
8. Can you provide examples of recent developments in the market?
September 2022 - A new born intensive care unit (NICU) and special newborn care unit (SNCU) facility was recently opened at the Mother and Child Health Center (MCHC) in Hyderabad's Nalgonda district by Cigniti Technologies, an AI and IP-led digital assurance and engineering services company. The digital company claimed that it worked with the non-profit Nirmaan to address the shortage of NICU/SNCU beds, medical equipment such radiant warmers, phototherapy machines, pulse oximeters, syringe and infusion pumps, multipara monitors, HFNC devices, and ward air conditioners.
9. What pricing options are available for accessing the report?
Pricing options include single-user, multi-user, and enterprise licenses priced at USD 4750, USD 5250, and USD 8750 respectively.
10. Is the market size provided in terms of value or volume?
The market size is provided in terms of value, measured in billion and volume, measured in K Unit.
11. Are there any specific market keywords associated with the report?
Yes, the market keyword associated with the report is "Digital Quality Assurance Industry," which aids in identifying and referencing the specific market segment covered.
12. How do I determine which pricing option suits my needs best?
The pricing options vary based on user requirements and access needs. Individual users may opt for single-user licenses, while businesses requiring broader access may choose multi-user or enterprise licenses for cost-effective access to the report.
13. Are there any additional resources or data provided in the Digital Quality Assurance Industry report?
While the report offers comprehensive insights, it's advisable to review the specific contents or supplementary materials provided to ascertain if additional resources or data are available.
14. How can I stay updated on further developments or reports in the Digital Quality Assurance Industry?
To stay informed about further developments, trends, and reports in the Digital Quality Assurance Industry, consider subscribing to industry newsletters, following relevant companies and organizations, or regularly checking reputable industry news sources and publications.
Methodology
Step 1 - Identification of Relevant Samples Size from Population Database


Step 2 - Approaches for Defining Global Market Size (Value, Volume* & Price*)

Note*: In applicable scenarios
Step 3 - Data Sources
Primary Research
- Web Analytics
- Survey Reports
- Research Institute
- Latest Research Reports
- Opinion Leaders
Secondary Research
- Annual Reports
- White Paper
- Latest Press Release
- Industry Association
- Paid Database
- Investor Presentations

Step 4 - Data Triangulation
Involves using different sources of information in order to increase the validity of a study
These sources are likely to be stakeholders in a program - participants, other researchers, program staff, other community members, and so on.
Then we put all data in single framework & apply various statistical tools to find out the dynamic on the market.
During the analysis stage, feedback from the stakeholder groups would be compared to determine areas of agreement as well as areas of divergence