

Key Insights
The edible glitter market, while niche, exhibits significant growth potential driven by increasing demand for decorative food items across various applications. The market's expansion is fueled by rising consumer preference for visually appealing and aesthetically enhanced food products, particularly in the bakery, confectionery, and beverage sectors. This trend is particularly strong amongst younger demographics and those engaging in celebratory occasions such as birthdays, weddings, and holidays. Furthermore, the growing popularity of cake decorating, baking shows, and DIY food crafting contributes to increased demand for high-quality, safe, and vibrant edible glitter. The market is segmented by type (e.g., biodegradable, non-biodegradable), application (e.g., cakes, chocolates, drinks), and distribution channel (e.g., online, offline). Key players such as Dr. Oetker, Ultimate Baker, and Glanbia Nutritionals are leveraging innovation in product formulation and packaging to capture market share. While challenges exist, such as regulatory scrutiny regarding food safety and potential environmental concerns surrounding non-biodegradable glitter, the overall market outlook remains positive. We project a robust compound annual growth rate (CAGR), leading to substantial market expansion throughout the forecast period. The market's expansion will be geographically varied with developed markets potentially showing slower growth compared to developing markets with increasing disposable incomes and expanding food service sectors. Competitive activity will likely center around product differentiation, sustainability initiatives, and brand building.
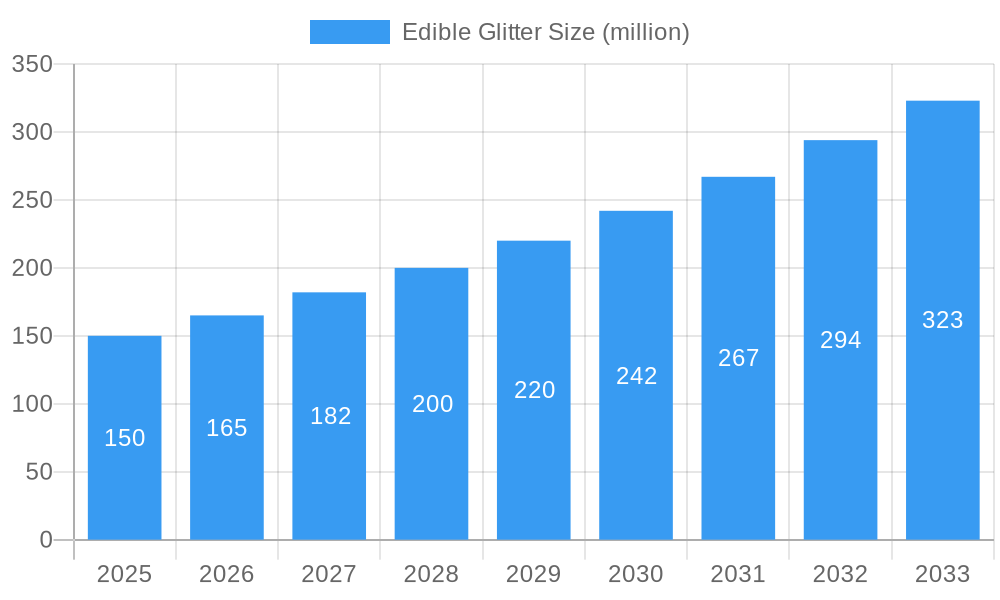
Edible Glitter Market Size (In Million)
The edible glitter market is expected to experience steady growth, fueled by ongoing trends in the food and beverage industry. The focus on premiumization and aesthetically pleasing products is driving demand for high-quality edible glitter. Market players are adapting by offering a wider range of colours, particle sizes, and bio-degradable options to cater to the diverse needs of consumers and comply with evolving regulations. Strategic partnerships and collaborations amongst manufacturers and food businesses are also expected to drive market penetration. A geographical shift in demand is anticipated, with emerging economies experiencing faster growth rates compared to mature markets. The increasing popularity of online sales channels presents significant opportunities for businesses to expand their reach and target specific customer segments. The successful players will need to balance innovation with cost-effectiveness to maintain profitability within a competitive landscape. This includes efficient production methods and strategic pricing strategies while continuously exploring new applications and markets for their products.
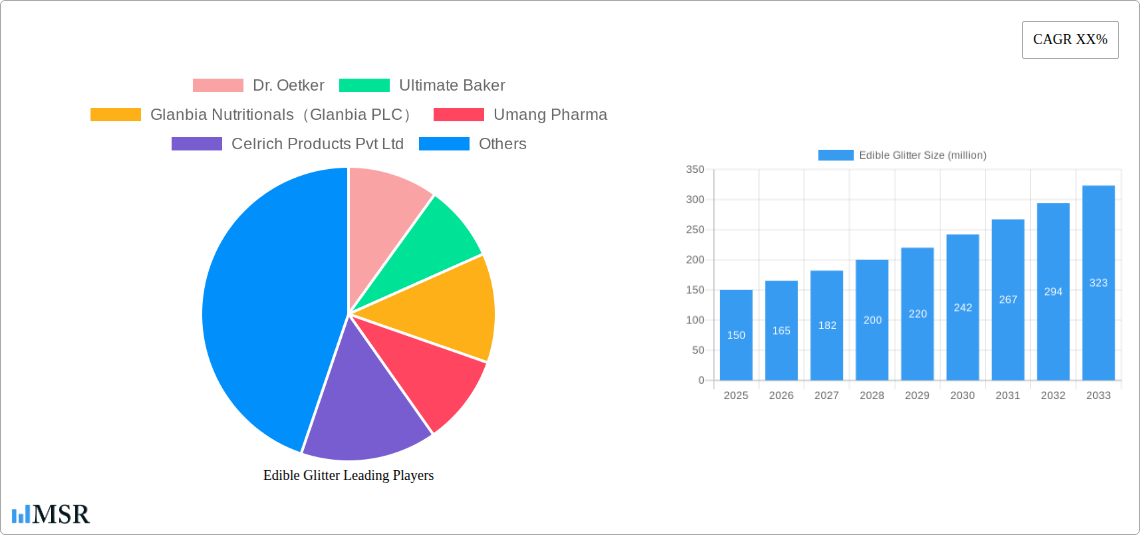
Edible Glitter Company Market Share
Edible Glitter Market Report: 2019-2033 - A Comprehensive Analysis of a Multi-Million Dollar Industry
This comprehensive report provides an in-depth analysis of the global edible glitter market, projecting a value exceeding xx million by 2033. The study period spans from 2019 to 2033, with 2025 serving as both the base and estimated year. This report is essential for industry stakeholders, investors, and businesses seeking to understand the market dynamics, growth drivers, and future potential of edible glitter. Key players like Dr. Oetker, Ultimate Baker, Glanbia Nutritionals (Glanbia PLC), Umang Pharma, and Celrich Products Pvt Ltd are profiled, providing valuable insights into their market strategies and contributions.
Edible Glitter Market Concentration & Dynamics
The global edible glitter market exhibits a moderately concentrated structure, with a few major players commanding significant market share. Dr. Oetker and Glanbia Nutritionals hold an estimated xx% and xx% market share, respectively, as of 2025. The market is characterized by an active innovation ecosystem, with ongoing developments in glitter materials, application methods, and safety regulations. The regulatory landscape varies across regions, impacting product approvals and market entry strategies. Substitute products, such as non-edible glitter and other decorative options, pose a moderate competitive threat. End-user trends, particularly within the baking and confectionery sectors, significantly influence market demand. M&A activity in the edible glitter market has been relatively low in recent years, with only xx deals recorded between 2019 and 2024.
- Market Share (2025): Dr. Oetker (xx%), Glanbia Nutritionals (xx%), Others (xx%)
- M&A Deal Count (2019-2024): xx
- Key Regulatory Frameworks: Vary by region (details within the full report)
- Substitute Products: Non-edible glitter, alternative decorative elements.
Edible Glitter Industry Insights & Trends
The global edible glitter market is experiencing robust growth, driven by rising demand from the food and beverage industry, particularly in confectionery, baking, and beverage applications. The market size in 2025 is estimated at xx million, with a Compound Annual Growth Rate (CAGR) of xx% projected from 2025 to 2033. Key growth drivers include increasing consumer demand for visually appealing products, growing popularity of customized cakes and desserts, and the expansion of online retail channels. Technological advancements, such as the development of biodegradable and sustainably sourced edible glitter, are also shaping market dynamics. Evolving consumer preferences towards healthier and more natural food products are creating new opportunities for edible glitter manufacturers to cater to these demands. The introduction of novel colors, finishes, and glitter sizes further contributes to market expansion.
Key Markets & Segments Leading Edible Glitter
The North American region currently dominates the edible glitter market, accounting for an estimated xx% of global revenue in 2025. This dominance is attributed to:
- High Consumer Spending: Strong disposable incomes and high demand for premium food products.
- Well-Established Food and Beverage Industry: A large and well-developed food processing and distribution network.
- Innovation Hub: High concentration of food product innovation and development activities.
Further detailed analysis within the report reveals a strong presence in European markets as well. However, the Asia-Pacific region shows the highest growth potential, driven by rising middle-class incomes and increasing adoption of Western food trends.
The bakery segment leads in edible glitter consumption, driven by its versatile application in decorating cakes, cookies, and other baked goods.
Edible Glitter Product Developments
Recent product innovations in edible glitter focus on enhancing color vibrancy, texture, and safety. The development of biodegradable and non-allergenic options caters to growing consumer concerns about health and sustainability. These advancements provide competitive advantages by enabling manufacturers to attract health-conscious consumers and comply with increasingly stringent food safety regulations. New application technologies and formats, such as pre-mixed glitter blends and easy-to-use dispensing systems, also contribute to product differentiation.
Challenges in the Edible Glitter Market
The edible glitter market faces challenges including stringent regulatory compliance requirements for food additives, fluctuations in raw material costs, and intensifying competition from substitute products. Supply chain disruptions can significantly impact production and availability, leading to price increases and potential shortages. The need for continuous innovation and adaptation to meet evolving consumer preferences and regulatory changes represents an ongoing challenge. These issues are estimated to negatively impact the growth rate by approximately xx% in the short term.
Forces Driving Edible Glitter Growth
Several factors drive edible glitter market growth, including the increasing demand for visually appealing food and beverages, advancements in manufacturing techniques resulting in improved quality and safety, and the growing popularity of personalized and customized food items. Expanding applications in various food categories, such as chocolates, ice cream, and cocktails, further contribute to market expansion. Government regulations promoting the use of natural food additives present growth opportunities, as do the expanding global e-commerce platforms that provide increased reach and accessibility.
Long-Term Growth Catalysts in Edible Glitter
Long-term growth will be fueled by continuous innovation in glitter materials, such as the development of sustainable and biodegradable options. Strategic partnerships between edible glitter manufacturers and food companies will enable broader market penetration and product integration. Furthermore, expanding into new and emerging markets, particularly in developing economies, presents significant long-term growth opportunities.
Emerging Opportunities in Edible Glitter
Emerging opportunities lie in the development of novel glitter formats and application methods, catering to the growing demand for convenience and ease of use. The increasing adoption of natural and organic ingredients in food products creates opportunities for edible glitter manufacturers to offer products aligned with these trends. The exploration of new applications in niche markets, such as cosmetic and craft industries, presents further potential for growth.
Leading Players in the Edible Glitter Sector
- Dr. Oetker
- Ultimate Baker
- Glanbia Nutritionals (Glanbia PLC)
- Umang Pharma
- Celrich Products Pvt Ltd
Key Milestones in Edible Glitter Industry
- 2020: Introduction of biodegradable edible glitter by [Company Name - if available, otherwise omit].
- 2022: Launch of a new line of organically sourced edible glitter by [Company Name - if available, otherwise omit].
- 2023: [Significant development - if available, otherwise omit]
Strategic Outlook for Edible Glitter Market
The edible glitter market is poised for continued growth driven by innovation, consumer demand for visually appealing food products, and expansion into new markets. Strategic opportunities exist for manufacturers to focus on developing sustainable and healthy products, leveraging digital marketing channels, and building strong partnerships within the food and beverage industry. The market is expected to reach xx million by 2033, representing significant potential for industry players.
Edible Glitter Segmentation
-
1. Application
- 1.1. Bakery Products & Confectionery
- 1.2. Breakfast Cereals
- 1.3. Beverages
- 1.4. Frozen Desserts & Ice-Cream
- 1.5. Chocolate
- 1.6. Dietary Supplements
- 1.7. Others
-
2. Types
- 2.1. Gold
- 2.2. Silver
- 2.3. Multicolor
- 2.4. White
- 2.5. Pink
- 2.6. Orange
- 2.7. Purple
- 2.8. Red
- 2.9. Blue
- 2.10. Other
Edible Glitter Segmentation By Geography
-
1. North America
- 1.1. United States
- 1.2. Canada
- 1.3. Mexico
-
2. South America
- 2.1. Brazil
- 2.2. Argentina
- 2.3. Rest of South America
-
3. Europe
- 3.1. United Kingdom
- 3.2. Germany
- 3.3. France
- 3.4. Italy
- 3.5. Spain
- 3.6. Russia
- 3.7. Benelux
- 3.8. Nordics
- 3.9. Rest of Europe
-
4. Middle East & Africa
- 4.1. Turkey
- 4.2. Israel
- 4.3. GCC
- 4.4. North Africa
- 4.5. South Africa
- 4.6. Rest of Middle East & Africa
-
5. Asia Pacific
- 5.1. China
- 5.2. India
- 5.3. Japan
- 5.4. South Korea
- 5.5. ASEAN
- 5.6. Oceania
- 5.7. Rest of Asia Pacific

Edible Glitter Regional Market Share
Geographic Coverage of Edible Glitter
Edible Glitter REPORT HIGHLIGHTS
| Aspects | Details |
|---|---|
| Study Period | 2020-2034 |
| Base Year | 2025 |
| Estimated Year | 2026 |
| Forecast Period | 2026-2034 |
| Historical Period | 2020-2025 |
| Growth Rate | CAGR of XX% from 2020-2034 |
| Segmentation |
|
Table of Contents
- 1. Introduction
- 1.1. Research Scope
- 1.2. Market Segmentation
- 1.3. Research Methodology
- 1.4. Definitions and Assumptions
- 2. Executive Summary
- 2.1. Introduction
- 3. Market Dynamics
- 3.1. Introduction
- 3.2. Market Drivers
- 3.3. Market Restrains
- 3.4. Market Trends
- 4. Market Factor Analysis
- 4.1. Porters Five Forces
- 4.2. Supply/Value Chain
- 4.3. PESTEL analysis
- 4.4. Market Entropy
- 4.5. Patent/Trademark Analysis
- 5. Global Edible Glitter Analysis, Insights and Forecast, 2020-2032
- 5.1. Market Analysis, Insights and Forecast - by Application
- 5.1.1. Bakery Products & Confectionery
- 5.1.2. Breakfast Cereals
- 5.1.3. Beverages
- 5.1.4. Frozen Desserts & Ice-Cream
- 5.1.5. Chocolate
- 5.1.6. Dietary Supplements
- 5.1.7. Others
- 5.2. Market Analysis, Insights and Forecast - by Types
- 5.2.1. Gold
- 5.2.2. Silver
- 5.2.3. Multicolor
- 5.2.4. White
- 5.2.5. Pink
- 5.2.6. Orange
- 5.2.7. Purple
- 5.2.8. Red
- 5.2.9. Blue
- 5.2.10. Other
- 5.3. Market Analysis, Insights and Forecast - by Region
- 5.3.1. North America
- 5.3.2. South America
- 5.3.3. Europe
- 5.3.4. Middle East & Africa
- 5.3.5. Asia Pacific
- 5.1. Market Analysis, Insights and Forecast - by Application
- 6. North America Edible Glitter Analysis, Insights and Forecast, 2020-2032
- 6.1. Market Analysis, Insights and Forecast - by Application
- 6.1.1. Bakery Products & Confectionery
- 6.1.2. Breakfast Cereals
- 6.1.3. Beverages
- 6.1.4. Frozen Desserts & Ice-Cream
- 6.1.5. Chocolate
- 6.1.6. Dietary Supplements
- 6.1.7. Others
- 6.2. Market Analysis, Insights and Forecast - by Types
- 6.2.1. Gold
- 6.2.2. Silver
- 6.2.3. Multicolor
- 6.2.4. White
- 6.2.5. Pink
- 6.2.6. Orange
- 6.2.7. Purple
- 6.2.8. Red
- 6.2.9. Blue
- 6.2.10. Other
- 6.1. Market Analysis, Insights and Forecast - by Application
- 7. South America Edible Glitter Analysis, Insights and Forecast, 2020-2032
- 7.1. Market Analysis, Insights and Forecast - by Application
- 7.1.1. Bakery Products & Confectionery
- 7.1.2. Breakfast Cereals
- 7.1.3. Beverages
- 7.1.4. Frozen Desserts & Ice-Cream
- 7.1.5. Chocolate
- 7.1.6. Dietary Supplements
- 7.1.7. Others
- 7.2. Market Analysis, Insights and Forecast - by Types
- 7.2.1. Gold
- 7.2.2. Silver
- 7.2.3. Multicolor
- 7.2.4. White
- 7.2.5. Pink
- 7.2.6. Orange
- 7.2.7. Purple
- 7.2.8. Red
- 7.2.9. Blue
- 7.2.10. Other
- 7.1. Market Analysis, Insights and Forecast - by Application
- 8. Europe Edible Glitter Analysis, Insights and Forecast, 2020-2032
- 8.1. Market Analysis, Insights and Forecast - by Application
- 8.1.1. Bakery Products & Confectionery
- 8.1.2. Breakfast Cereals
- 8.1.3. Beverages
- 8.1.4. Frozen Desserts & Ice-Cream
- 8.1.5. Chocolate
- 8.1.6. Dietary Supplements
- 8.1.7. Others
- 8.2. Market Analysis, Insights and Forecast - by Types
- 8.2.1. Gold
- 8.2.2. Silver
- 8.2.3. Multicolor
- 8.2.4. White
- 8.2.5. Pink
- 8.2.6. Orange
- 8.2.7. Purple
- 8.2.8. Red
- 8.2.9. Blue
- 8.2.10. Other
- 8.1. Market Analysis, Insights and Forecast - by Application
- 9. Middle East & Africa Edible Glitter Analysis, Insights and Forecast, 2020-2032
- 9.1. Market Analysis, Insights and Forecast - by Application
- 9.1.1. Bakery Products & Confectionery
- 9.1.2. Breakfast Cereals
- 9.1.3. Beverages
- 9.1.4. Frozen Desserts & Ice-Cream
- 9.1.5. Chocolate
- 9.1.6. Dietary Supplements
- 9.1.7. Others
- 9.2. Market Analysis, Insights and Forecast - by Types
- 9.2.1. Gold
- 9.2.2. Silver
- 9.2.3. Multicolor
- 9.2.4. White
- 9.2.5. Pink
- 9.2.6. Orange
- 9.2.7. Purple
- 9.2.8. Red
- 9.2.9. Blue
- 9.2.10. Other
- 9.1. Market Analysis, Insights and Forecast - by Application
- 10. Asia Pacific Edible Glitter Analysis, Insights and Forecast, 2020-2032
- 10.1. Market Analysis, Insights and Forecast - by Application
- 10.1.1. Bakery Products & Confectionery
- 10.1.2. Breakfast Cereals
- 10.1.3. Beverages
- 10.1.4. Frozen Desserts & Ice-Cream
- 10.1.5. Chocolate
- 10.1.6. Dietary Supplements
- 10.1.7. Others
- 10.2. Market Analysis, Insights and Forecast - by Types
- 10.2.1. Gold
- 10.2.2. Silver
- 10.2.3. Multicolor
- 10.2.4. White
- 10.2.5. Pink
- 10.2.6. Orange
- 10.2.7. Purple
- 10.2.8. Red
- 10.2.9. Blue
- 10.2.10. Other
- 10.1. Market Analysis, Insights and Forecast - by Application
- 11. Competitive Analysis
- 11.1. Global Market Share Analysis 2025
- 11.2. Company Profiles
- 11.2.1 Dr. Oetker
- 11.2.1.1. Overview
- 11.2.1.2. Products
- 11.2.1.3. SWOT Analysis
- 11.2.1.4. Recent Developments
- 11.2.1.5. Financials (Based on Availability)
- 11.2.2 Ultimate Baker
- 11.2.2.1. Overview
- 11.2.2.2. Products
- 11.2.2.3. SWOT Analysis
- 11.2.2.4. Recent Developments
- 11.2.2.5. Financials (Based on Availability)
- 11.2.3 Glanbia Nutritionals(Glanbia PLC)
- 11.2.3.1. Overview
- 11.2.3.2. Products
- 11.2.3.3. SWOT Analysis
- 11.2.3.4. Recent Developments
- 11.2.3.5. Financials (Based on Availability)
- 11.2.4 Umang Pharma
- 11.2.4.1. Overview
- 11.2.4.2. Products
- 11.2.4.3. SWOT Analysis
- 11.2.4.4. Recent Developments
- 11.2.4.5. Financials (Based on Availability)
- 11.2.5 Celrich Products Pvt Ltd
- 11.2.5.1. Overview
- 11.2.5.2. Products
- 11.2.5.3. SWOT Analysis
- 11.2.5.4. Recent Developments
- 11.2.5.5. Financials (Based on Availability)
- 11.2.1 Dr. Oetker
List of Figures
- Figure 1: Global Edible Glitter Revenue Breakdown (million, %) by Region 2025 & 2033
- Figure 2: Global Edible Glitter Volume Breakdown (K, %) by Region 2025 & 2033
- Figure 3: North America Edible Glitter Revenue (million), by Application 2025 & 2033
- Figure 4: North America Edible Glitter Volume (K), by Application 2025 & 2033
- Figure 5: North America Edible Glitter Revenue Share (%), by Application 2025 & 2033
- Figure 6: North America Edible Glitter Volume Share (%), by Application 2025 & 2033
- Figure 7: North America Edible Glitter Revenue (million), by Types 2025 & 2033
- Figure 8: North America Edible Glitter Volume (K), by Types 2025 & 2033
- Figure 9: North America Edible Glitter Revenue Share (%), by Types 2025 & 2033
- Figure 10: North America Edible Glitter Volume Share (%), by Types 2025 & 2033
- Figure 11: North America Edible Glitter Revenue (million), by Country 2025 & 2033
- Figure 12: North America Edible Glitter Volume (K), by Country 2025 & 2033
- Figure 13: North America Edible Glitter Revenue Share (%), by Country 2025 & 2033
- Figure 14: North America Edible Glitter Volume Share (%), by Country 2025 & 2033
- Figure 15: South America Edible Glitter Revenue (million), by Application 2025 & 2033
- Figure 16: South America Edible Glitter Volume (K), by Application 2025 & 2033
- Figure 17: South America Edible Glitter Revenue Share (%), by Application 2025 & 2033
- Figure 18: South America Edible Glitter Volume Share (%), by Application 2025 & 2033
- Figure 19: South America Edible Glitter Revenue (million), by Types 2025 & 2033
- Figure 20: South America Edible Glitter Volume (K), by Types 2025 & 2033
- Figure 21: South America Edible Glitter Revenue Share (%), by Types 2025 & 2033
- Figure 22: South America Edible Glitter Volume Share (%), by Types 2025 & 2033
- Figure 23: South America Edible Glitter Revenue (million), by Country 2025 & 2033
- Figure 24: South America Edible Glitter Volume (K), by Country 2025 & 2033
- Figure 25: South America Edible Glitter Revenue Share (%), by Country 2025 & 2033
- Figure 26: South America Edible Glitter Volume Share (%), by Country 2025 & 2033
- Figure 27: Europe Edible Glitter Revenue (million), by Application 2025 & 2033
- Figure 28: Europe Edible Glitter Volume (K), by Application 2025 & 2033
- Figure 29: Europe Edible Glitter Revenue Share (%), by Application 2025 & 2033
- Figure 30: Europe Edible Glitter Volume Share (%), by Application 2025 & 2033
- Figure 31: Europe Edible Glitter Revenue (million), by Types 2025 & 2033
- Figure 32: Europe Edible Glitter Volume (K), by Types 2025 & 2033
- Figure 33: Europe Edible Glitter Revenue Share (%), by Types 2025 & 2033
- Figure 34: Europe Edible Glitter Volume Share (%), by Types 2025 & 2033
- Figure 35: Europe Edible Glitter Revenue (million), by Country 2025 & 2033
- Figure 36: Europe Edible Glitter Volume (K), by Country 2025 & 2033
- Figure 37: Europe Edible Glitter Revenue Share (%), by Country 2025 & 2033
- Figure 38: Europe Edible Glitter Volume Share (%), by Country 2025 & 2033
- Figure 39: Middle East & Africa Edible Glitter Revenue (million), by Application 2025 & 2033
- Figure 40: Middle East & Africa Edible Glitter Volume (K), by Application 2025 & 2033
- Figure 41: Middle East & Africa Edible Glitter Revenue Share (%), by Application 2025 & 2033
- Figure 42: Middle East & Africa Edible Glitter Volume Share (%), by Application 2025 & 2033
- Figure 43: Middle East & Africa Edible Glitter Revenue (million), by Types 2025 & 2033
- Figure 44: Middle East & Africa Edible Glitter Volume (K), by Types 2025 & 2033
- Figure 45: Middle East & Africa Edible Glitter Revenue Share (%), by Types 2025 & 2033
- Figure 46: Middle East & Africa Edible Glitter Volume Share (%), by Types 2025 & 2033
- Figure 47: Middle East & Africa Edible Glitter Revenue (million), by Country 2025 & 2033
- Figure 48: Middle East & Africa Edible Glitter Volume (K), by Country 2025 & 2033
- Figure 49: Middle East & Africa Edible Glitter Revenue Share (%), by Country 2025 & 2033
- Figure 50: Middle East & Africa Edible Glitter Volume Share (%), by Country 2025 & 2033
- Figure 51: Asia Pacific Edible Glitter Revenue (million), by Application 2025 & 2033
- Figure 52: Asia Pacific Edible Glitter Volume (K), by Application 2025 & 2033
- Figure 53: Asia Pacific Edible Glitter Revenue Share (%), by Application 2025 & 2033
- Figure 54: Asia Pacific Edible Glitter Volume Share (%), by Application 2025 & 2033
- Figure 55: Asia Pacific Edible Glitter Revenue (million), by Types 2025 & 2033
- Figure 56: Asia Pacific Edible Glitter Volume (K), by Types 2025 & 2033
- Figure 57: Asia Pacific Edible Glitter Revenue Share (%), by Types 2025 & 2033
- Figure 58: Asia Pacific Edible Glitter Volume Share (%), by Types 2025 & 2033
- Figure 59: Asia Pacific Edible Glitter Revenue (million), by Country 2025 & 2033
- Figure 60: Asia Pacific Edible Glitter Volume (K), by Country 2025 & 2033
- Figure 61: Asia Pacific Edible Glitter Revenue Share (%), by Country 2025 & 2033
- Figure 62: Asia Pacific Edible Glitter Volume Share (%), by Country 2025 & 2033
List of Tables
- Table 1: Global Edible Glitter Revenue million Forecast, by Application 2020 & 2033
- Table 2: Global Edible Glitter Volume K Forecast, by Application 2020 & 2033
- Table 3: Global Edible Glitter Revenue million Forecast, by Types 2020 & 2033
- Table 4: Global Edible Glitter Volume K Forecast, by Types 2020 & 2033
- Table 5: Global Edible Glitter Revenue million Forecast, by Region 2020 & 2033
- Table 6: Global Edible Glitter Volume K Forecast, by Region 2020 & 2033
- Table 7: Global Edible Glitter Revenue million Forecast, by Application 2020 & 2033
- Table 8: Global Edible Glitter Volume K Forecast, by Application 2020 & 2033
- Table 9: Global Edible Glitter Revenue million Forecast, by Types 2020 & 2033
- Table 10: Global Edible Glitter Volume K Forecast, by Types 2020 & 2033
- Table 11: Global Edible Glitter Revenue million Forecast, by Country 2020 & 2033
- Table 12: Global Edible Glitter Volume K Forecast, by Country 2020 & 2033
- Table 13: United States Edible Glitter Revenue (million) Forecast, by Application 2020 & 2033
- Table 14: United States Edible Glitter Volume (K) Forecast, by Application 2020 & 2033
- Table 15: Canada Edible Glitter Revenue (million) Forecast, by Application 2020 & 2033
- Table 16: Canada Edible Glitter Volume (K) Forecast, by Application 2020 & 2033
- Table 17: Mexico Edible Glitter Revenue (million) Forecast, by Application 2020 & 2033
- Table 18: Mexico Edible Glitter Volume (K) Forecast, by Application 2020 & 2033
- Table 19: Global Edible Glitter Revenue million Forecast, by Application 2020 & 2033
- Table 20: Global Edible Glitter Volume K Forecast, by Application 2020 & 2033
- Table 21: Global Edible Glitter Revenue million Forecast, by Types 2020 & 2033
- Table 22: Global Edible Glitter Volume K Forecast, by Types 2020 & 2033
- Table 23: Global Edible Glitter Revenue million Forecast, by Country 2020 & 2033
- Table 24: Global Edible Glitter Volume K Forecast, by Country 2020 & 2033
- Table 25: Brazil Edible Glitter Revenue (million) Forecast, by Application 2020 & 2033
- Table 26: Brazil Edible Glitter Volume (K) Forecast, by Application 2020 & 2033
- Table 27: Argentina Edible Glitter Revenue (million) Forecast, by Application 2020 & 2033
- Table 28: Argentina Edible Glitter Volume (K) Forecast, by Application 2020 & 2033
- Table 29: Rest of South America Edible Glitter Revenue (million) Forecast, by Application 2020 & 2033
- Table 30: Rest of South America Edible Glitter Volume (K) Forecast, by Application 2020 & 2033
- Table 31: Global Edible Glitter Revenue million Forecast, by Application 2020 & 2033
- Table 32: Global Edible Glitter Volume K Forecast, by Application 2020 & 2033
- Table 33: Global Edible Glitter Revenue million Forecast, by Types 2020 & 2033
- Table 34: Global Edible Glitter Volume K Forecast, by Types 2020 & 2033
- Table 35: Global Edible Glitter Revenue million Forecast, by Country 2020 & 2033
- Table 36: Global Edible Glitter Volume K Forecast, by Country 2020 & 2033
- Table 37: United Kingdom Edible Glitter Revenue (million) Forecast, by Application 2020 & 2033
- Table 38: United Kingdom Edible Glitter Volume (K) Forecast, by Application 2020 & 2033
- Table 39: Germany Edible Glitter Revenue (million) Forecast, by Application 2020 & 2033
- Table 40: Germany Edible Glitter Volume (K) Forecast, by Application 2020 & 2033
- Table 41: France Edible Glitter Revenue (million) Forecast, by Application 2020 & 2033
- Table 42: France Edible Glitter Volume (K) Forecast, by Application 2020 & 2033
- Table 43: Italy Edible Glitter Revenue (million) Forecast, by Application 2020 & 2033
- Table 44: Italy Edible Glitter Volume (K) Forecast, by Application 2020 & 2033
- Table 45: Spain Edible Glitter Revenue (million) Forecast, by Application 2020 & 2033
- Table 46: Spain Edible Glitter Volume (K) Forecast, by Application 2020 & 2033
- Table 47: Russia Edible Glitter Revenue (million) Forecast, by Application 2020 & 2033
- Table 48: Russia Edible Glitter Volume (K) Forecast, by Application 2020 & 2033
- Table 49: Benelux Edible Glitter Revenue (million) Forecast, by Application 2020 & 2033
- Table 50: Benelux Edible Glitter Volume (K) Forecast, by Application 2020 & 2033
- Table 51: Nordics Edible Glitter Revenue (million) Forecast, by Application 2020 & 2033
- Table 52: Nordics Edible Glitter Volume (K) Forecast, by Application 2020 & 2033
- Table 53: Rest of Europe Edible Glitter Revenue (million) Forecast, by Application 2020 & 2033
- Table 54: Rest of Europe Edible Glitter Volume (K) Forecast, by Application 2020 & 2033
- Table 55: Global Edible Glitter Revenue million Forecast, by Application 2020 & 2033
- Table 56: Global Edible Glitter Volume K Forecast, by Application 2020 & 2033
- Table 57: Global Edible Glitter Revenue million Forecast, by Types 2020 & 2033
- Table 58: Global Edible Glitter Volume K Forecast, by Types 2020 & 2033
- Table 59: Global Edible Glitter Revenue million Forecast, by Country 2020 & 2033
- Table 60: Global Edible Glitter Volume K Forecast, by Country 2020 & 2033
- Table 61: Turkey Edible Glitter Revenue (million) Forecast, by Application 2020 & 2033
- Table 62: Turkey Edible Glitter Volume (K) Forecast, by Application 2020 & 2033
- Table 63: Israel Edible Glitter Revenue (million) Forecast, by Application 2020 & 2033
- Table 64: Israel Edible Glitter Volume (K) Forecast, by Application 2020 & 2033
- Table 65: GCC Edible Glitter Revenue (million) Forecast, by Application 2020 & 2033
- Table 66: GCC Edible Glitter Volume (K) Forecast, by Application 2020 & 2033
- Table 67: North Africa Edible Glitter Revenue (million) Forecast, by Application 2020 & 2033
- Table 68: North Africa Edible Glitter Volume (K) Forecast, by Application 2020 & 2033
- Table 69: South Africa Edible Glitter Revenue (million) Forecast, by Application 2020 & 2033
- Table 70: South Africa Edible Glitter Volume (K) Forecast, by Application 2020 & 2033
- Table 71: Rest of Middle East & Africa Edible Glitter Revenue (million) Forecast, by Application 2020 & 2033
- Table 72: Rest of Middle East & Africa Edible Glitter Volume (K) Forecast, by Application 2020 & 2033
- Table 73: Global Edible Glitter Revenue million Forecast, by Application 2020 & 2033
- Table 74: Global Edible Glitter Volume K Forecast, by Application 2020 & 2033
- Table 75: Global Edible Glitter Revenue million Forecast, by Types 2020 & 2033
- Table 76: Global Edible Glitter Volume K Forecast, by Types 2020 & 2033
- Table 77: Global Edible Glitter Revenue million Forecast, by Country 2020 & 2033
- Table 78: Global Edible Glitter Volume K Forecast, by Country 2020 & 2033
- Table 79: China Edible Glitter Revenue (million) Forecast, by Application 2020 & 2033
- Table 80: China Edible Glitter Volume (K) Forecast, by Application 2020 & 2033
- Table 81: India Edible Glitter Revenue (million) Forecast, by Application 2020 & 2033
- Table 82: India Edible Glitter Volume (K) Forecast, by Application 2020 & 2033
- Table 83: Japan Edible Glitter Revenue (million) Forecast, by Application 2020 & 2033
- Table 84: Japan Edible Glitter Volume (K) Forecast, by Application 2020 & 2033
- Table 85: South Korea Edible Glitter Revenue (million) Forecast, by Application 2020 & 2033
- Table 86: South Korea Edible Glitter Volume (K) Forecast, by Application 2020 & 2033
- Table 87: ASEAN Edible Glitter Revenue (million) Forecast, by Application 2020 & 2033
- Table 88: ASEAN Edible Glitter Volume (K) Forecast, by Application 2020 & 2033
- Table 89: Oceania Edible Glitter Revenue (million) Forecast, by Application 2020 & 2033
- Table 90: Oceania Edible Glitter Volume (K) Forecast, by Application 2020 & 2033
- Table 91: Rest of Asia Pacific Edible Glitter Revenue (million) Forecast, by Application 2020 & 2033
- Table 92: Rest of Asia Pacific Edible Glitter Volume (K) Forecast, by Application 2020 & 2033
Frequently Asked Questions
1. What is the projected Compound Annual Growth Rate (CAGR) of the Edible Glitter?
The projected CAGR is approximately XX%.
2. Which companies are prominent players in the Edible Glitter?
Key companies in the market include Dr. Oetker, Ultimate Baker, Glanbia Nutritionals(Glanbia PLC), Umang Pharma, Celrich Products Pvt Ltd.
3. What are the main segments of the Edible Glitter?
The market segments include Application, Types.
4. Can you provide details about the market size?
The market size is estimated to be USD XXX million as of 2022.
5. What are some drivers contributing to market growth?
N/A
6. What are the notable trends driving market growth?
N/A
7. Are there any restraints impacting market growth?
N/A
8. Can you provide examples of recent developments in the market?
N/A
9. What pricing options are available for accessing the report?
Pricing options include single-user, multi-user, and enterprise licenses priced at USD 3950.00, USD 5925.00, and USD 7900.00 respectively.
10. Is the market size provided in terms of value or volume?
The market size is provided in terms of value, measured in million and volume, measured in K.
11. Are there any specific market keywords associated with the report?
Yes, the market keyword associated with the report is "Edible Glitter," which aids in identifying and referencing the specific market segment covered.
12. How do I determine which pricing option suits my needs best?
The pricing options vary based on user requirements and access needs. Individual users may opt for single-user licenses, while businesses requiring broader access may choose multi-user or enterprise licenses for cost-effective access to the report.
13. Are there any additional resources or data provided in the Edible Glitter report?
While the report offers comprehensive insights, it's advisable to review the specific contents or supplementary materials provided to ascertain if additional resources or data are available.
14. How can I stay updated on further developments or reports in the Edible Glitter?
To stay informed about further developments, trends, and reports in the Edible Glitter, consider subscribing to industry newsletters, following relevant companies and organizations, or regularly checking reputable industry news sources and publications.
Methodology
Step 1 - Identification of Relevant Samples Size from Population Database


Step 2 - Approaches for Defining Global Market Size (Value, Volume* & Price*)

Note*: In applicable scenarios
Step 3 - Data Sources
Primary Research
- Web Analytics
- Survey Reports
- Research Institute
- Latest Research Reports
- Opinion Leaders
Secondary Research
- Annual Reports
- White Paper
- Latest Press Release
- Industry Association
- Paid Database
- Investor Presentations

Step 4 - Data Triangulation
Involves using different sources of information in order to increase the validity of a study
These sources are likely to be stakeholders in a program - participants, other researchers, program staff, other community members, and so on.
Then we put all data in single framework & apply various statistical tools to find out the dynamic on the market.
During the analysis stage, feedback from the stakeholder groups would be compared to determine areas of agreement as well as areas of divergence