

Key Insights
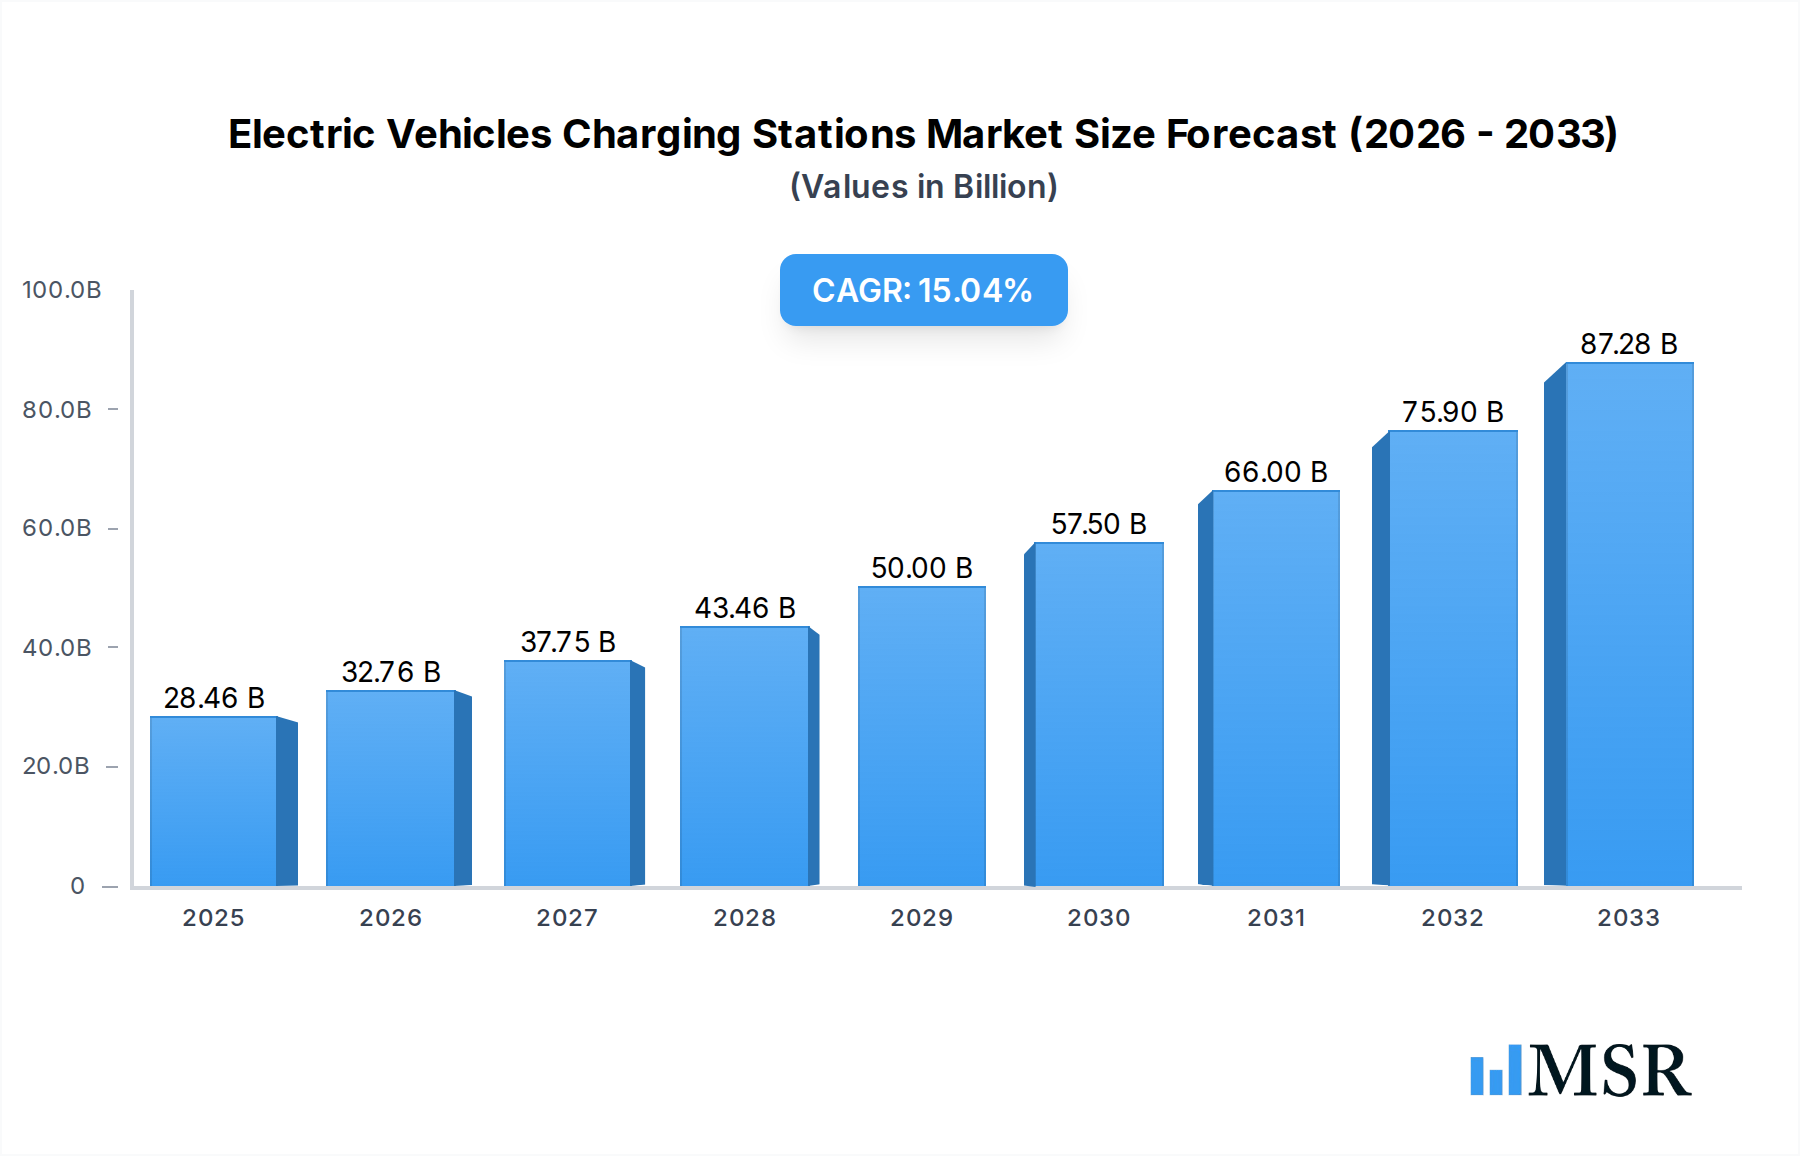
The global Electric Vehicle (EV) Charging Stations market is poised for substantial expansion, projected to reach an estimated $28.46 billion in 2025. This rapid growth is fueled by a confluence of factors, including escalating government incentives for EV adoption, increasing consumer awareness regarding environmental sustainability, and a significant rise in the number of EV models available across various price points. The market is expected to witness a Compound Annual Growth Rate (CAGR) of 15.1% from 2025 to 2033, indicating a robust and sustained upward trajectory. Key drivers include the expanding charging infrastructure network, technological advancements in charging speed and efficiency (such as the increasing prevalence of DC fast charging), and the growing demand for smart charging solutions that offer grid integration and energy management capabilities.

Electric Vehicles Charging Stations Market Size (In Billion)
The market is segmented across diverse applications, with 'Personal Use' and 'Commercial' applications driving demand for both AC and DC charging stations. The proliferation of public charging infrastructure for commercial fleets and ride-sharing services, alongside the growing adoption of home charging solutions, will shape market dynamics. Inductive charging stations, while currently a smaller segment, are anticipated to gain traction due to their convenience and potential for seamless integration into urban environments. Geographically, Asia Pacific, led by China, is expected to be a dominant force in the EV charging station market, owing to strong government support and a burgeoning EV ecosystem. North America and Europe are also critical markets, characterized by significant investments in charging infrastructure and supportive regulatory frameworks. Despite the promising outlook, challenges such as high initial installation costs for charging infrastructure and the need for grid upgrades to accommodate increased electricity demand may present some restraints.
Electric Vehicles Charging Stations Company Market Share
This comprehensive report delves into the burgeoning Electric Vehicles Charging Stations Market, a critical sector poised for exponential growth as global EV adoption accelerates. Analyzing market dynamics from 2019 to 2033, with a base year of 2025 and a forecast period extending to 2033, this research provides invaluable insights for stakeholders seeking to capitalize on this transformative industry. We project the global electric vehicle charging infrastructure market size to reach billions of dollars, driven by technological advancements, supportive government policies, and evolving consumer preferences. This report dissects market concentration, innovation, regulatory landscapes, and key players, offering a strategic roadmap for navigating the evolving EV charging solutions ecosystem.
Electric Vehicles Charging Stations Market Concentration & Dynamics
The Electric Vehicles Charging Stations Market exhibits moderate to high concentration, with key players like ABB, AeroVironment, GE, and Schneider Electric dominating significant market share. The innovation ecosystem is robust, characterized by continuous advancements in DC fast charging stations, AC charging stations, and the emerging inductive charging station technology. Regulatory frameworks, including government incentives and charging infrastructure mandates, are pivotal in shaping market dynamics and accelerating adoption. While substitute products are limited in direct charging functionality, the broader energy sector and alternative transportation modes present indirect competitive pressures. End-user trends are shifting rapidly, with a growing demand for convenient, fast, and integrated charging solutions in both personal use and commercial applications. Mergers and acquisitions (M&A) activities are on the rise as companies seek to expand their geographical reach, technological capabilities, and service offerings. We anticipate billions in M&A deals throughout the forecast period as consolidation continues in this high-growth sector.
Electric Vehicles Charging Stations Industry Insights & Trends
The Electric Vehicles Charging Stations Industry is experiencing unprecedented growth, fueled by a confluence of factors. The projected electric vehicle charging market size is expected to reach billions by 2025 and continue its upward trajectory throughout the forecast period. A significant market size is projected for the global EV charging infrastructure market. The compound annual growth rate (CAGR) is exceptionally strong, reflecting the rapid pace of EV adoption and the corresponding demand for robust charging networks. Technological disruptions are at the forefront, with advancements in smart charging, vehicle-to-grid (V2G) technology, and faster charging speeds for both DC charging stations and AC charging stations. Evolving consumer behaviors are driving demand for seamless user experiences, including mobile app integration, contactless payments, and reliable charging availability. The expansion of public charging infrastructure, coupled with the increasing installation of home and workplace chargers, is crucial for sustained market expansion. The trend towards electrifying commercial fleets further propels the demand for specialized commercial charging solutions. The market's trajectory is further bolstered by increasing awareness of environmental sustainability and the desire to reduce carbon footprints.
Key Markets & Segments Leading Electric Vehicles Charging Stations
The Electric Vehicles Charging Stations Market is witnessing significant growth across diverse regions and segments.
Dominant Regions and Countries:
- North America and Europe are leading the charge due to strong government support, established automotive industries, and high EV adoption rates. Economic growth and increased disposable incomes in these regions further fuel the demand for personal use charging solutions.
- Asia Pacific is emerging as a powerhouse, driven by massive investments in EV manufacturing and charging infrastructure development in countries like China. Rapid urbanization and government initiatives to curb pollution are key drivers.
Dominant Segments:
- Application:
- Commercial: The demand for commercial charging stations is surging, driven by fleet electrification, public charging networks, and the need to support businesses transitioning to electric fleets. This segment is projected to account for billions in revenue.
- Personal Use: As EV ownership becomes more mainstream, the market for home and workplace personal use charging stations is expanding rapidly, offering convenience and cost savings to individual EV owners.
- Types:
- DC Charging Station: These high-power chargers are crucial for rapid refueling and are experiencing immense growth, particularly for long-distance travel and public charging networks. The projected market value for this segment is in the billions.
- AC Charging Station: While slower than DC charging, AC chargers remain essential for overnight charging at homes and workplaces, offering a cost-effective solution for everyday charging needs.
- Inductive Charging Station: This nascent technology, offering wireless charging convenience, is gaining traction and is expected to contribute significantly to market growth in the coming years, representing a future billion-dollar opportunity.
Drivers for this dominance include robust economic growth, aggressive government incentives for EV adoption and infrastructure development, and increasing consumer awareness of the benefits of electric mobility. The expanding charging infrastructure in urban and suburban areas is a critical enabler for widespread EV adoption, further solidifying the growth of these key markets and segments.
Electric Vehicles Charging Stations Product Developments
The Electric Vehicles Charging Stations Market is characterized by continuous product innovation focused on enhancing charging speed, convenience, and intelligence. Companies are introducing advanced DC fast charging stations capable of delivering billions of miles of range in minutes, significantly reducing charging times. Integration of smart grid technologies enables AC charging stations to optimize charging based on grid load and electricity prices, offering cost savings and grid stability benefits. The development of inductive charging station technology promises a seamless, cable-free charging experience for EVs, further enhancing user convenience. These innovations are crucial for addressing range anxiety and improving the overall EV ownership experience, thereby driving market adoption and creating new revenue streams in the billions.
Challenges in the Electric Vehicles Charging Stations Market
Despite the robust growth, the Electric Vehicles Charging Stations Market faces several challenges that could impact its trajectory. Regulatory hurdles, including varying standards and permitting processes across different regions, can slow down deployment. Supply chain disruptions for critical components, such as semiconductors and rare earth materials, can lead to increased costs and production delays, potentially impacting the availability of billions of dollars worth of charging equipment. Intense competitive pressures among a growing number of players can lead to price wars and reduced profit margins. Furthermore, the significant upfront investment required for large-scale charging infrastructure deployment remains a barrier for some organizations and municipalities.
Forces Driving Electric Vehicles Charging Stations Growth
Several powerful forces are propelling the Electric Vehicles Charging Stations Market forward. Government incentives, such as tax credits and subsidies for EV purchases and charging infrastructure development, are a primary catalyst. The increasing stringency of emission regulations globally is compelling automakers to shift towards electric powertrains, thereby boosting EV sales and the demand for charging solutions. Technological advancements in battery technology are leading to longer EV ranges and faster charging capabilities, alleviating range anxiety and making EVs more practical for a wider audience. The declining total cost of ownership for EVs, coupled with the growing environmental consciousness among consumers, is also a significant growth driver, contributing to billions in market expansion.
Challenges in the Electric Vehicles Charging Stations Market
The long-term growth of the Electric Vehicles Charging Stations Market is underpinned by ongoing innovation and strategic collaborations. The development of ultra-fast charging technology, capable of replenishing EV batteries in a matter of minutes, will be a game-changer, potentially unlocking billions in new market opportunities. Partnerships between charging network operators, utility companies, and automotive manufacturers are crucial for building integrated and seamless charging ecosystems. The expansion of charging infrastructure into underserved rural areas and the development of interoperable charging standards will further accelerate adoption, creating sustained growth for years to come. Investments in smart charging and V2G technologies will unlock additional revenue streams and enhance grid stability, contributing billions to the overall market value.
Emerging Opportunities in Electric Vehicles Charging Stations
The Electric Vehicles Charging Stations Market is brimming with emerging opportunities. The growing demand for integrated charging solutions in residential complexes, commercial buildings, and public spaces presents significant growth potential, valued in the billions. The electrification of commercial fleets, including delivery vans and buses, is creating a substantial market for specialized charging infrastructure. Furthermore, the development of renewable energy-integrated charging stations, powered by solar and wind energy, aligns with sustainability goals and offers a unique selling proposition. The potential of vehicle-to-grid (V2G) technology to provide grid services and generate revenue for EV owners represents a transformative opportunity, promising billions in future market value.
Leading Players in the Electric Vehicles Charging Stations Sector
- ABB
- AeroVironment
- Elektromotive
- GE
- Schneider Electric
Key Milestones in Electric Vehicles Charging Stations Industry
- 2019: Significant government investment announcements in charging infrastructure across key markets, setting the stage for future growth.
- 2020: Major automakers commit to ambitious EV production targets, increasing projected demand for charging solutions.
- 2021: Introduction of new, higher-powered DC fast charging standards, significantly reducing charging times.
- 2022: Increased M&A activity as larger companies acquire smaller charging infrastructure providers to expand their market share.
- 2023: Growing focus on smart charging and V2G technologies by leading companies, signaling future integration opportunities.
- 2024: Expansion of charging networks into new geographical regions and commercial sectors.
Strategic Outlook for Electric Vehicles Charging Stations Market
The Electric Vehicles Charging Stations Market is on a path of sustained and significant growth, projected to reach billions in value. Key growth accelerators include continued government support through favorable policies and incentives, ongoing technological advancements in charging speed and intelligence, and the accelerating global transition towards electric mobility. Strategic investments in expanding charging infrastructure, particularly in public and commercial sectors, will be crucial. Furthermore, fostering interoperability and standardization across different charging networks will enhance user experience and drive wider adoption. The market's future potential lies in the integration of renewable energy sources and smart grid capabilities, creating a more sustainable and efficient charging ecosystem that will generate billions in revenue for stakeholders.
Electric Vehicles Charging Stations Segmentation
-
1. Application
- 1.1. Personal Use
- 1.2. Commercial
-
2. Types
- 2.1. AC Charging Station
- 2.2. DC Charging Station
- 2.3. Inductive Charging Station
Electric Vehicles Charging Stations Segmentation By Geography
-
1. North America
- 1.1. United States
- 1.2. Canada
- 1.3. Mexico
-
2. South America
- 2.1. Brazil
- 2.2. Argentina
- 2.3. Rest of South America
-
3. Europe
- 3.1. United Kingdom
- 3.2. Germany
- 3.3. France
- 3.4. Italy
- 3.5. Spain
- 3.6. Russia
- 3.7. Benelux
- 3.8. Nordics
- 3.9. Rest of Europe
-
4. Middle East & Africa
- 4.1. Turkey
- 4.2. Israel
- 4.3. GCC
- 4.4. North Africa
- 4.5. South Africa
- 4.6. Rest of Middle East & Africa
-
5. Asia Pacific
- 5.1. China
- 5.2. India
- 5.3. Japan
- 5.4. South Korea
- 5.5. ASEAN
- 5.6. Oceania
- 5.7. Rest of Asia Pacific
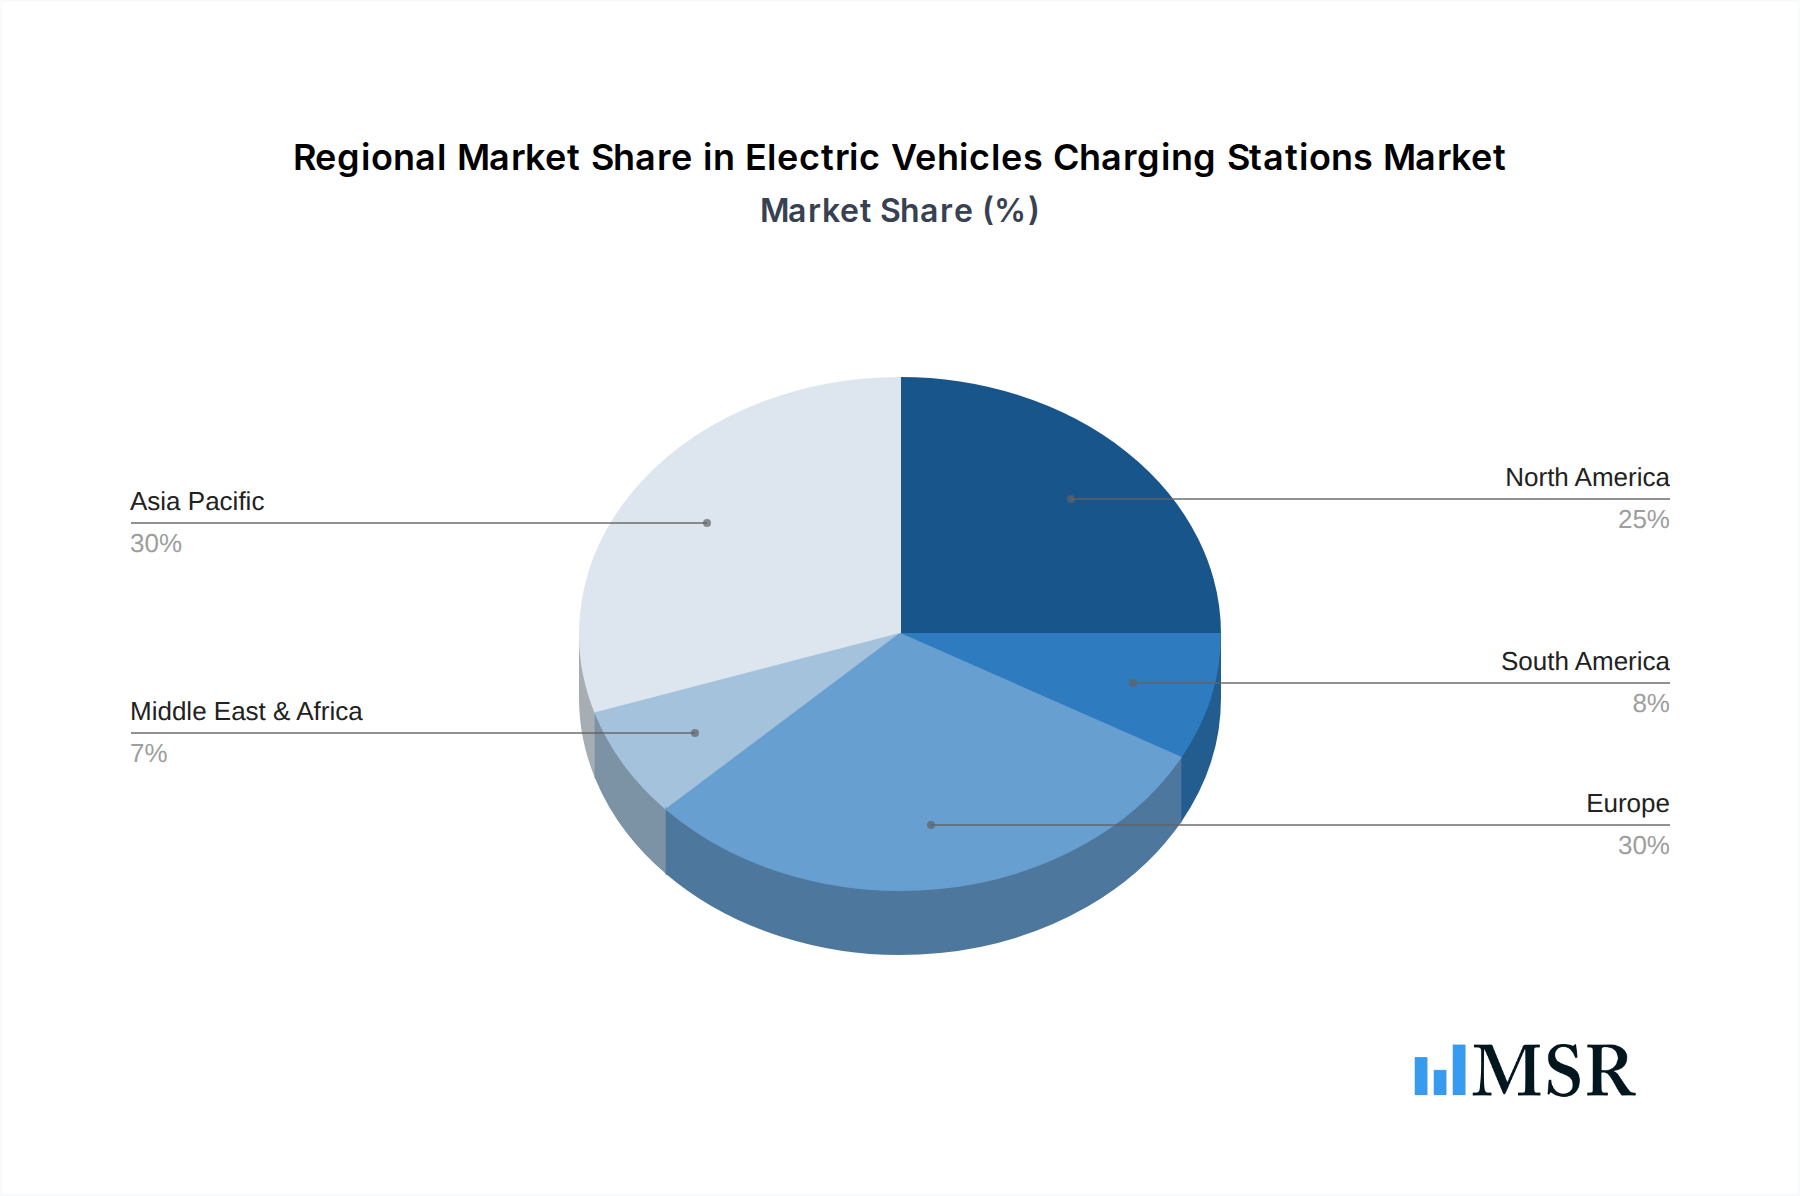
Electric Vehicles Charging Stations Regional Market Share
Geographic Coverage of Electric Vehicles Charging Stations
Electric Vehicles Charging Stations REPORT HIGHLIGHTS
| Aspects | Details |
|---|---|
| Study Period | 2020-2034 |
| Base Year | 2025 |
| Estimated Year | 2026 |
| Forecast Period | 2026-2034 |
| Historical Period | 2020-2025 |
| Growth Rate | CAGR of 15.1% from 2020-2034 |
| Segmentation |
|
Table of Contents
- 1. Introduction
- 1.1. Research Scope
- 1.2. Market Segmentation
- 1.3. Research Methodology
- 1.4. Definitions and Assumptions
- 2. Executive Summary
- 2.1. Introduction
- 3. Market Dynamics
- 3.1. Introduction
- 3.2. Market Drivers
- 3.3. Market Restrains
- 3.4. Market Trends
- 4. Market Factor Analysis
- 4.1. Porters Five Forces
- 4.2. Supply/Value Chain
- 4.3. PESTEL analysis
- 4.4. Market Entropy
- 4.5. Patent/Trademark Analysis
- 5. Global Electric Vehicles Charging Stations Analysis, Insights and Forecast, 2020-2032
- 5.1. Market Analysis, Insights and Forecast - by Application
- 5.1.1. Personal Use
- 5.1.2. Commercial
- 5.2. Market Analysis, Insights and Forecast - by Types
- 5.2.1. AC Charging Station
- 5.2.2. DC Charging Station
- 5.2.3. Inductive Charging Station
- 5.3. Market Analysis, Insights and Forecast - by Region
- 5.3.1. North America
- 5.3.2. South America
- 5.3.3. Europe
- 5.3.4. Middle East & Africa
- 5.3.5. Asia Pacific
- 5.1. Market Analysis, Insights and Forecast - by Application
- 6. North America Electric Vehicles Charging Stations Analysis, Insights and Forecast, 2020-2032
- 6.1. Market Analysis, Insights and Forecast - by Application
- 6.1.1. Personal Use
- 6.1.2. Commercial
- 6.2. Market Analysis, Insights and Forecast - by Types
- 6.2.1. AC Charging Station
- 6.2.2. DC Charging Station
- 6.2.3. Inductive Charging Station
- 6.1. Market Analysis, Insights and Forecast - by Application
- 7. South America Electric Vehicles Charging Stations Analysis, Insights and Forecast, 2020-2032
- 7.1. Market Analysis, Insights and Forecast - by Application
- 7.1.1. Personal Use
- 7.1.2. Commercial
- 7.2. Market Analysis, Insights and Forecast - by Types
- 7.2.1. AC Charging Station
- 7.2.2. DC Charging Station
- 7.2.3. Inductive Charging Station
- 7.1. Market Analysis, Insights and Forecast - by Application
- 8. Europe Electric Vehicles Charging Stations Analysis, Insights and Forecast, 2020-2032
- 8.1. Market Analysis, Insights and Forecast - by Application
- 8.1.1. Personal Use
- 8.1.2. Commercial
- 8.2. Market Analysis, Insights and Forecast - by Types
- 8.2.1. AC Charging Station
- 8.2.2. DC Charging Station
- 8.2.3. Inductive Charging Station
- 8.1. Market Analysis, Insights and Forecast - by Application
- 9. Middle East & Africa Electric Vehicles Charging Stations Analysis, Insights and Forecast, 2020-2032
- 9.1. Market Analysis, Insights and Forecast - by Application
- 9.1.1. Personal Use
- 9.1.2. Commercial
- 9.2. Market Analysis, Insights and Forecast - by Types
- 9.2.1. AC Charging Station
- 9.2.2. DC Charging Station
- 9.2.3. Inductive Charging Station
- 9.1. Market Analysis, Insights and Forecast - by Application
- 10. Asia Pacific Electric Vehicles Charging Stations Analysis, Insights and Forecast, 2020-2032
- 10.1. Market Analysis, Insights and Forecast - by Application
- 10.1.1. Personal Use
- 10.1.2. Commercial
- 10.2. Market Analysis, Insights and Forecast - by Types
- 10.2.1. AC Charging Station
- 10.2.2. DC Charging Station
- 10.2.3. Inductive Charging Station
- 10.1. Market Analysis, Insights and Forecast - by Application
- 11. Competitive Analysis
- 11.1. Global Market Share Analysis 2025
- 11.2. Company Profiles
- 11.2.1 ABB
- 11.2.1.1. Overview
- 11.2.1.2. Products
- 11.2.1.3. SWOT Analysis
- 11.2.1.4. Recent Developments
- 11.2.1.5. Financials (Based on Availability)
- 11.2.2 AeroVironment
- 11.2.2.1. Overview
- 11.2.2.2. Products
- 11.2.2.3. SWOT Analysis
- 11.2.2.4. Recent Developments
- 11.2.2.5. Financials (Based on Availability)
- 11.2.3 Elektromotive
- 11.2.3.1. Overview
- 11.2.3.2. Products
- 11.2.3.3. SWOT Analysis
- 11.2.3.4. Recent Developments
- 11.2.3.5. Financials (Based on Availability)
- 11.2.4 GE
- 11.2.4.1. Overview
- 11.2.4.2. Products
- 11.2.4.3. SWOT Analysis
- 11.2.4.4. Recent Developments
- 11.2.4.5. Financials (Based on Availability)
- 11.2.5 Schneider Electric
- 11.2.5.1. Overview
- 11.2.5.2. Products
- 11.2.5.3. SWOT Analysis
- 11.2.5.4. Recent Developments
- 11.2.5.5. Financials (Based on Availability)
- 11.2.1 ABB
List of Figures
- Figure 1: Global Electric Vehicles Charging Stations Revenue Breakdown (billion, %) by Region 2025 & 2033
- Figure 2: Global Electric Vehicles Charging Stations Volume Breakdown (K, %) by Region 2025 & 2033
- Figure 3: North America Electric Vehicles Charging Stations Revenue (billion), by Application 2025 & 2033
- Figure 4: North America Electric Vehicles Charging Stations Volume (K), by Application 2025 & 2033
- Figure 5: North America Electric Vehicles Charging Stations Revenue Share (%), by Application 2025 & 2033
- Figure 6: North America Electric Vehicles Charging Stations Volume Share (%), by Application 2025 & 2033
- Figure 7: North America Electric Vehicles Charging Stations Revenue (billion), by Types 2025 & 2033
- Figure 8: North America Electric Vehicles Charging Stations Volume (K), by Types 2025 & 2033
- Figure 9: North America Electric Vehicles Charging Stations Revenue Share (%), by Types 2025 & 2033
- Figure 10: North America Electric Vehicles Charging Stations Volume Share (%), by Types 2025 & 2033
- Figure 11: North America Electric Vehicles Charging Stations Revenue (billion), by Country 2025 & 2033
- Figure 12: North America Electric Vehicles Charging Stations Volume (K), by Country 2025 & 2033
- Figure 13: North America Electric Vehicles Charging Stations Revenue Share (%), by Country 2025 & 2033
- Figure 14: North America Electric Vehicles Charging Stations Volume Share (%), by Country 2025 & 2033
- Figure 15: South America Electric Vehicles Charging Stations Revenue (billion), by Application 2025 & 2033
- Figure 16: South America Electric Vehicles Charging Stations Volume (K), by Application 2025 & 2033
- Figure 17: South America Electric Vehicles Charging Stations Revenue Share (%), by Application 2025 & 2033
- Figure 18: South America Electric Vehicles Charging Stations Volume Share (%), by Application 2025 & 2033
- Figure 19: South America Electric Vehicles Charging Stations Revenue (billion), by Types 2025 & 2033
- Figure 20: South America Electric Vehicles Charging Stations Volume (K), by Types 2025 & 2033
- Figure 21: South America Electric Vehicles Charging Stations Revenue Share (%), by Types 2025 & 2033
- Figure 22: South America Electric Vehicles Charging Stations Volume Share (%), by Types 2025 & 2033
- Figure 23: South America Electric Vehicles Charging Stations Revenue (billion), by Country 2025 & 2033
- Figure 24: South America Electric Vehicles Charging Stations Volume (K), by Country 2025 & 2033
- Figure 25: South America Electric Vehicles Charging Stations Revenue Share (%), by Country 2025 & 2033
- Figure 26: South America Electric Vehicles Charging Stations Volume Share (%), by Country 2025 & 2033
- Figure 27: Europe Electric Vehicles Charging Stations Revenue (billion), by Application 2025 & 2033
- Figure 28: Europe Electric Vehicles Charging Stations Volume (K), by Application 2025 & 2033
- Figure 29: Europe Electric Vehicles Charging Stations Revenue Share (%), by Application 2025 & 2033
- Figure 30: Europe Electric Vehicles Charging Stations Volume Share (%), by Application 2025 & 2033
- Figure 31: Europe Electric Vehicles Charging Stations Revenue (billion), by Types 2025 & 2033
- Figure 32: Europe Electric Vehicles Charging Stations Volume (K), by Types 2025 & 2033
- Figure 33: Europe Electric Vehicles Charging Stations Revenue Share (%), by Types 2025 & 2033
- Figure 34: Europe Electric Vehicles Charging Stations Volume Share (%), by Types 2025 & 2033
- Figure 35: Europe Electric Vehicles Charging Stations Revenue (billion), by Country 2025 & 2033
- Figure 36: Europe Electric Vehicles Charging Stations Volume (K), by Country 2025 & 2033
- Figure 37: Europe Electric Vehicles Charging Stations Revenue Share (%), by Country 2025 & 2033
- Figure 38: Europe Electric Vehicles Charging Stations Volume Share (%), by Country 2025 & 2033
- Figure 39: Middle East & Africa Electric Vehicles Charging Stations Revenue (billion), by Application 2025 & 2033
- Figure 40: Middle East & Africa Electric Vehicles Charging Stations Volume (K), by Application 2025 & 2033
- Figure 41: Middle East & Africa Electric Vehicles Charging Stations Revenue Share (%), by Application 2025 & 2033
- Figure 42: Middle East & Africa Electric Vehicles Charging Stations Volume Share (%), by Application 2025 & 2033
- Figure 43: Middle East & Africa Electric Vehicles Charging Stations Revenue (billion), by Types 2025 & 2033
- Figure 44: Middle East & Africa Electric Vehicles Charging Stations Volume (K), by Types 2025 & 2033
- Figure 45: Middle East & Africa Electric Vehicles Charging Stations Revenue Share (%), by Types 2025 & 2033
- Figure 46: Middle East & Africa Electric Vehicles Charging Stations Volume Share (%), by Types 2025 & 2033
- Figure 47: Middle East & Africa Electric Vehicles Charging Stations Revenue (billion), by Country 2025 & 2033
- Figure 48: Middle East & Africa Electric Vehicles Charging Stations Volume (K), by Country 2025 & 2033
- Figure 49: Middle East & Africa Electric Vehicles Charging Stations Revenue Share (%), by Country 2025 & 2033
- Figure 50: Middle East & Africa Electric Vehicles Charging Stations Volume Share (%), by Country 2025 & 2033
- Figure 51: Asia Pacific Electric Vehicles Charging Stations Revenue (billion), by Application 2025 & 2033
- Figure 52: Asia Pacific Electric Vehicles Charging Stations Volume (K), by Application 2025 & 2033
- Figure 53: Asia Pacific Electric Vehicles Charging Stations Revenue Share (%), by Application 2025 & 2033
- Figure 54: Asia Pacific Electric Vehicles Charging Stations Volume Share (%), by Application 2025 & 2033
- Figure 55: Asia Pacific Electric Vehicles Charging Stations Revenue (billion), by Types 2025 & 2033
- Figure 56: Asia Pacific Electric Vehicles Charging Stations Volume (K), by Types 2025 & 2033
- Figure 57: Asia Pacific Electric Vehicles Charging Stations Revenue Share (%), by Types 2025 & 2033
- Figure 58: Asia Pacific Electric Vehicles Charging Stations Volume Share (%), by Types 2025 & 2033
- Figure 59: Asia Pacific Electric Vehicles Charging Stations Revenue (billion), by Country 2025 & 2033
- Figure 60: Asia Pacific Electric Vehicles Charging Stations Volume (K), by Country 2025 & 2033
- Figure 61: Asia Pacific Electric Vehicles Charging Stations Revenue Share (%), by Country 2025 & 2033
- Figure 62: Asia Pacific Electric Vehicles Charging Stations Volume Share (%), by Country 2025 & 2033
List of Tables
- Table 1: Global Electric Vehicles Charging Stations Revenue billion Forecast, by Application 2020 & 2033
- Table 2: Global Electric Vehicles Charging Stations Volume K Forecast, by Application 2020 & 2033
- Table 3: Global Electric Vehicles Charging Stations Revenue billion Forecast, by Types 2020 & 2033
- Table 4: Global Electric Vehicles Charging Stations Volume K Forecast, by Types 2020 & 2033
- Table 5: Global Electric Vehicles Charging Stations Revenue billion Forecast, by Region 2020 & 2033
- Table 6: Global Electric Vehicles Charging Stations Volume K Forecast, by Region 2020 & 2033
- Table 7: Global Electric Vehicles Charging Stations Revenue billion Forecast, by Application 2020 & 2033
- Table 8: Global Electric Vehicles Charging Stations Volume K Forecast, by Application 2020 & 2033
- Table 9: Global Electric Vehicles Charging Stations Revenue billion Forecast, by Types 2020 & 2033
- Table 10: Global Electric Vehicles Charging Stations Volume K Forecast, by Types 2020 & 2033
- Table 11: Global Electric Vehicles Charging Stations Revenue billion Forecast, by Country 2020 & 2033
- Table 12: Global Electric Vehicles Charging Stations Volume K Forecast, by Country 2020 & 2033
- Table 13: United States Electric Vehicles Charging Stations Revenue (billion) Forecast, by Application 2020 & 2033
- Table 14: United States Electric Vehicles Charging Stations Volume (K) Forecast, by Application 2020 & 2033
- Table 15: Canada Electric Vehicles Charging Stations Revenue (billion) Forecast, by Application 2020 & 2033
- Table 16: Canada Electric Vehicles Charging Stations Volume (K) Forecast, by Application 2020 & 2033
- Table 17: Mexico Electric Vehicles Charging Stations Revenue (billion) Forecast, by Application 2020 & 2033
- Table 18: Mexico Electric Vehicles Charging Stations Volume (K) Forecast, by Application 2020 & 2033
- Table 19: Global Electric Vehicles Charging Stations Revenue billion Forecast, by Application 2020 & 2033
- Table 20: Global Electric Vehicles Charging Stations Volume K Forecast, by Application 2020 & 2033
- Table 21: Global Electric Vehicles Charging Stations Revenue billion Forecast, by Types 2020 & 2033
- Table 22: Global Electric Vehicles Charging Stations Volume K Forecast, by Types 2020 & 2033
- Table 23: Global Electric Vehicles Charging Stations Revenue billion Forecast, by Country 2020 & 2033
- Table 24: Global Electric Vehicles Charging Stations Volume K Forecast, by Country 2020 & 2033
- Table 25: Brazil Electric Vehicles Charging Stations Revenue (billion) Forecast, by Application 2020 & 2033
- Table 26: Brazil Electric Vehicles Charging Stations Volume (K) Forecast, by Application 2020 & 2033
- Table 27: Argentina Electric Vehicles Charging Stations Revenue (billion) Forecast, by Application 2020 & 2033
- Table 28: Argentina Electric Vehicles Charging Stations Volume (K) Forecast, by Application 2020 & 2033
- Table 29: Rest of South America Electric Vehicles Charging Stations Revenue (billion) Forecast, by Application 2020 & 2033
- Table 30: Rest of South America Electric Vehicles Charging Stations Volume (K) Forecast, by Application 2020 & 2033
- Table 31: Global Electric Vehicles Charging Stations Revenue billion Forecast, by Application 2020 & 2033
- Table 32: Global Electric Vehicles Charging Stations Volume K Forecast, by Application 2020 & 2033
- Table 33: Global Electric Vehicles Charging Stations Revenue billion Forecast, by Types 2020 & 2033
- Table 34: Global Electric Vehicles Charging Stations Volume K Forecast, by Types 2020 & 2033
- Table 35: Global Electric Vehicles Charging Stations Revenue billion Forecast, by Country 2020 & 2033
- Table 36: Global Electric Vehicles Charging Stations Volume K Forecast, by Country 2020 & 2033
- Table 37: United Kingdom Electric Vehicles Charging Stations Revenue (billion) Forecast, by Application 2020 & 2033
- Table 38: United Kingdom Electric Vehicles Charging Stations Volume (K) Forecast, by Application 2020 & 2033
- Table 39: Germany Electric Vehicles Charging Stations Revenue (billion) Forecast, by Application 2020 & 2033
- Table 40: Germany Electric Vehicles Charging Stations Volume (K) Forecast, by Application 2020 & 2033
- Table 41: France Electric Vehicles Charging Stations Revenue (billion) Forecast, by Application 2020 & 2033
- Table 42: France Electric Vehicles Charging Stations Volume (K) Forecast, by Application 2020 & 2033
- Table 43: Italy Electric Vehicles Charging Stations Revenue (billion) Forecast, by Application 2020 & 2033
- Table 44: Italy Electric Vehicles Charging Stations Volume (K) Forecast, by Application 2020 & 2033
- Table 45: Spain Electric Vehicles Charging Stations Revenue (billion) Forecast, by Application 2020 & 2033
- Table 46: Spain Electric Vehicles Charging Stations Volume (K) Forecast, by Application 2020 & 2033
- Table 47: Russia Electric Vehicles Charging Stations Revenue (billion) Forecast, by Application 2020 & 2033
- Table 48: Russia Electric Vehicles Charging Stations Volume (K) Forecast, by Application 2020 & 2033
- Table 49: Benelux Electric Vehicles Charging Stations Revenue (billion) Forecast, by Application 2020 & 2033
- Table 50: Benelux Electric Vehicles Charging Stations Volume (K) Forecast, by Application 2020 & 2033
- Table 51: Nordics Electric Vehicles Charging Stations Revenue (billion) Forecast, by Application 2020 & 2033
- Table 52: Nordics Electric Vehicles Charging Stations Volume (K) Forecast, by Application 2020 & 2033
- Table 53: Rest of Europe Electric Vehicles Charging Stations Revenue (billion) Forecast, by Application 2020 & 2033
- Table 54: Rest of Europe Electric Vehicles Charging Stations Volume (K) Forecast, by Application 2020 & 2033
- Table 55: Global Electric Vehicles Charging Stations Revenue billion Forecast, by Application 2020 & 2033
- Table 56: Global Electric Vehicles Charging Stations Volume K Forecast, by Application 2020 & 2033
- Table 57: Global Electric Vehicles Charging Stations Revenue billion Forecast, by Types 2020 & 2033
- Table 58: Global Electric Vehicles Charging Stations Volume K Forecast, by Types 2020 & 2033
- Table 59: Global Electric Vehicles Charging Stations Revenue billion Forecast, by Country 2020 & 2033
- Table 60: Global Electric Vehicles Charging Stations Volume K Forecast, by Country 2020 & 2033
- Table 61: Turkey Electric Vehicles Charging Stations Revenue (billion) Forecast, by Application 2020 & 2033
- Table 62: Turkey Electric Vehicles Charging Stations Volume (K) Forecast, by Application 2020 & 2033
- Table 63: Israel Electric Vehicles Charging Stations Revenue (billion) Forecast, by Application 2020 & 2033
- Table 64: Israel Electric Vehicles Charging Stations Volume (K) Forecast, by Application 2020 & 2033
- Table 65: GCC Electric Vehicles Charging Stations Revenue (billion) Forecast, by Application 2020 & 2033
- Table 66: GCC Electric Vehicles Charging Stations Volume (K) Forecast, by Application 2020 & 2033
- Table 67: North Africa Electric Vehicles Charging Stations Revenue (billion) Forecast, by Application 2020 & 2033
- Table 68: North Africa Electric Vehicles Charging Stations Volume (K) Forecast, by Application 2020 & 2033
- Table 69: South Africa Electric Vehicles Charging Stations Revenue (billion) Forecast, by Application 2020 & 2033
- Table 70: South Africa Electric Vehicles Charging Stations Volume (K) Forecast, by Application 2020 & 2033
- Table 71: Rest of Middle East & Africa Electric Vehicles Charging Stations Revenue (billion) Forecast, by Application 2020 & 2033
- Table 72: Rest of Middle East & Africa Electric Vehicles Charging Stations Volume (K) Forecast, by Application 2020 & 2033
- Table 73: Global Electric Vehicles Charging Stations Revenue billion Forecast, by Application 2020 & 2033
- Table 74: Global Electric Vehicles Charging Stations Volume K Forecast, by Application 2020 & 2033
- Table 75: Global Electric Vehicles Charging Stations Revenue billion Forecast, by Types 2020 & 2033
- Table 76: Global Electric Vehicles Charging Stations Volume K Forecast, by Types 2020 & 2033
- Table 77: Global Electric Vehicles Charging Stations Revenue billion Forecast, by Country 2020 & 2033
- Table 78: Global Electric Vehicles Charging Stations Volume K Forecast, by Country 2020 & 2033
- Table 79: China Electric Vehicles Charging Stations Revenue (billion) Forecast, by Application 2020 & 2033
- Table 80: China Electric Vehicles Charging Stations Volume (K) Forecast, by Application 2020 & 2033
- Table 81: India Electric Vehicles Charging Stations Revenue (billion) Forecast, by Application 2020 & 2033
- Table 82: India Electric Vehicles Charging Stations Volume (K) Forecast, by Application 2020 & 2033
- Table 83: Japan Electric Vehicles Charging Stations Revenue (billion) Forecast, by Application 2020 & 2033
- Table 84: Japan Electric Vehicles Charging Stations Volume (K) Forecast, by Application 2020 & 2033
- Table 85: South Korea Electric Vehicles Charging Stations Revenue (billion) Forecast, by Application 2020 & 2033
- Table 86: South Korea Electric Vehicles Charging Stations Volume (K) Forecast, by Application 2020 & 2033
- Table 87: ASEAN Electric Vehicles Charging Stations Revenue (billion) Forecast, by Application 2020 & 2033
- Table 88: ASEAN Electric Vehicles Charging Stations Volume (K) Forecast, by Application 2020 & 2033
- Table 89: Oceania Electric Vehicles Charging Stations Revenue (billion) Forecast, by Application 2020 & 2033
- Table 90: Oceania Electric Vehicles Charging Stations Volume (K) Forecast, by Application 2020 & 2033
- Table 91: Rest of Asia Pacific Electric Vehicles Charging Stations Revenue (billion) Forecast, by Application 2020 & 2033
- Table 92: Rest of Asia Pacific Electric Vehicles Charging Stations Volume (K) Forecast, by Application 2020 & 2033
Frequently Asked Questions
1. What is the projected Compound Annual Growth Rate (CAGR) of the Electric Vehicles Charging Stations?
The projected CAGR is approximately 15.1%.
2. Which companies are prominent players in the Electric Vehicles Charging Stations?
Key companies in the market include ABB, AeroVironment, Elektromotive, GE, Schneider Electric.
3. What are the main segments of the Electric Vehicles Charging Stations?
The market segments include Application, Types.
4. Can you provide details about the market size?
The market size is estimated to be USD 28.46 billion as of 2022.
5. What are some drivers contributing to market growth?
N/A
6. What are the notable trends driving market growth?
N/A
7. Are there any restraints impacting market growth?
N/A
8. Can you provide examples of recent developments in the market?
N/A
9. What pricing options are available for accessing the report?
Pricing options include single-user, multi-user, and enterprise licenses priced at USD 3350.00, USD 5025.00, and USD 6700.00 respectively.
10. Is the market size provided in terms of value or volume?
The market size is provided in terms of value, measured in billion and volume, measured in K.
11. Are there any specific market keywords associated with the report?
Yes, the market keyword associated with the report is "Electric Vehicles Charging Stations," which aids in identifying and referencing the specific market segment covered.
12. How do I determine which pricing option suits my needs best?
The pricing options vary based on user requirements and access needs. Individual users may opt for single-user licenses, while businesses requiring broader access may choose multi-user or enterprise licenses for cost-effective access to the report.
13. Are there any additional resources or data provided in the Electric Vehicles Charging Stations report?
While the report offers comprehensive insights, it's advisable to review the specific contents or supplementary materials provided to ascertain if additional resources or data are available.
14. How can I stay updated on further developments or reports in the Electric Vehicles Charging Stations?
To stay informed about further developments, trends, and reports in the Electric Vehicles Charging Stations, consider subscribing to industry newsletters, following relevant companies and organizations, or regularly checking reputable industry news sources and publications.
Methodology
Step 1 - Identification of Relevant Samples Size from Population Database


Step 2 - Approaches for Defining Global Market Size (Value, Volume* & Price*)

Note*: In applicable scenarios
Step 3 - Data Sources
Primary Research
- Web Analytics
- Survey Reports
- Research Institute
- Latest Research Reports
- Opinion Leaders
Secondary Research
- Annual Reports
- White Paper
- Latest Press Release
- Industry Association
- Paid Database
- Investor Presentations

Step 4 - Data Triangulation
Involves using different sources of information in order to increase the validity of a study
These sources are likely to be stakeholders in a program - participants, other researchers, program staff, other community members, and so on.
Then we put all data in single framework & apply various statistical tools to find out the dynamic on the market.
During the analysis stage, feedback from the stakeholder groups would be compared to determine areas of agreement as well as areas of divergence