

Key Insights
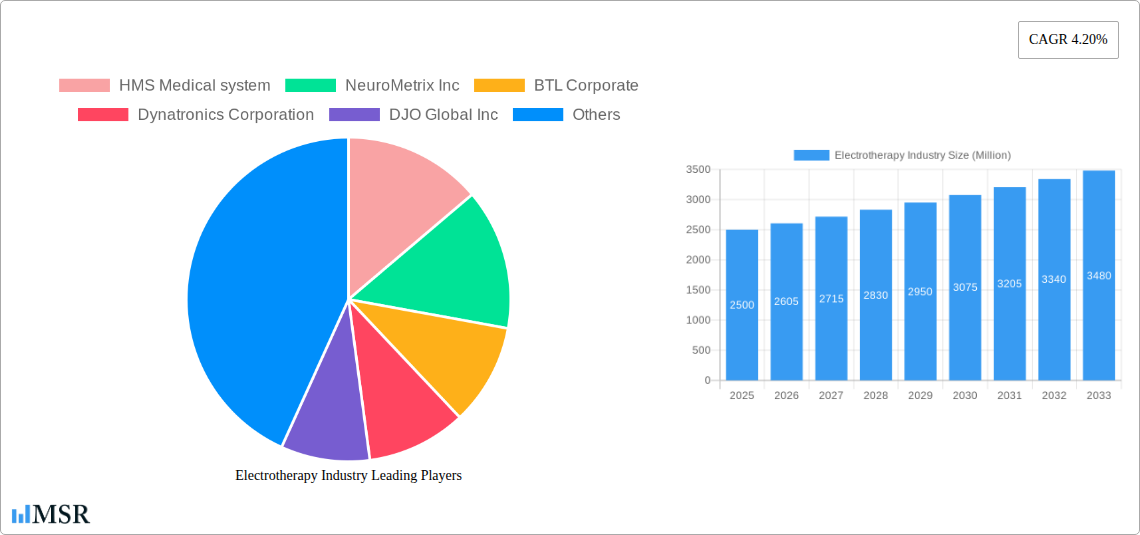
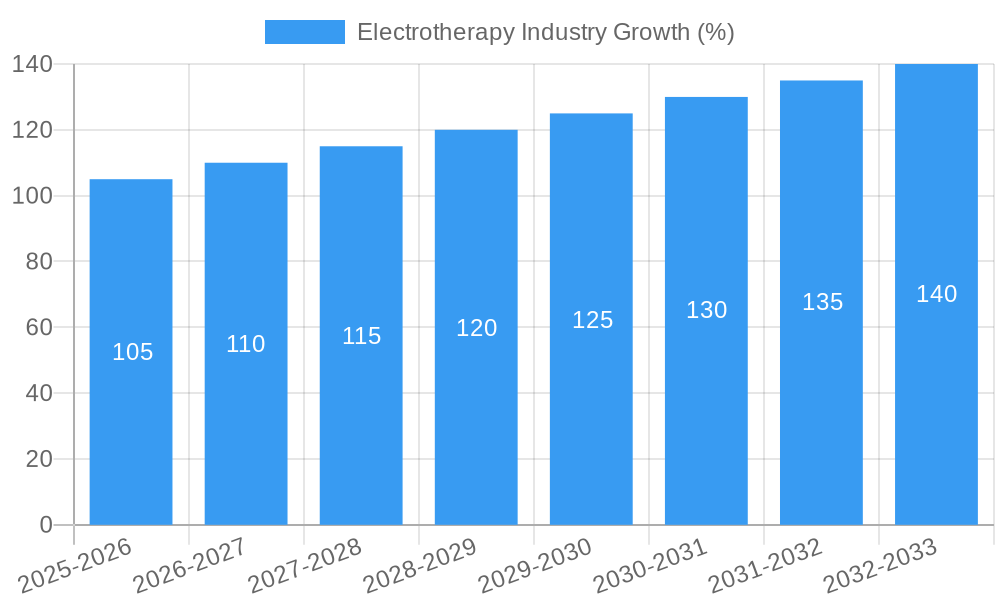
The global electrotherapy market, valued at approximately $XX million in 2025, is projected to experience robust growth, driven by a Compound Annual Growth Rate (CAGR) of 4.20% from 2025 to 2033. This expansion is fueled by several key factors. The rising prevalence of chronic pain conditions, neurological disorders, and musculoskeletal injuries is creating significant demand for non-invasive and effective pain management solutions. Electrotherapy devices offer a compelling alternative to pharmaceuticals, appealing to patients seeking less invasive and potentially less side-effect prone treatment options. Technological advancements, such as the development of more sophisticated and portable devices with enhanced user interfaces and therapeutic capabilities, are also contributing to market growth. Furthermore, increasing awareness of electrotherapy's effectiveness among healthcare professionals and patients, coupled with favorable reimbursement policies in several regions, are further boosting market adoption. The segment encompassing high-frequency devices is likely to dominate the product type category due to their efficacy in treating a wider range of conditions. Geographically, North America and Europe are currently major market players, benefitting from established healthcare infrastructure and high healthcare expenditure. However, the Asia-Pacific region is expected to witness significant growth in the coming years, driven by rising disposable incomes and increasing healthcare awareness. The market faces challenges such as the high initial cost of some devices and concerns surrounding potential side effects in specific patient populations; however, ongoing innovation and improved patient education are likely to mitigate these challenges.
The market segmentation highlights diverse applications, including nervous system diseases, muscle injuries, inflammation, and pain relief. While pain relief applications currently constitute a large portion of the market, the increasing understanding of electrotherapy's effectiveness in treating neurological conditions will likely drive significant growth within this segment over the forecast period. Competitive landscape analysis reveals a mix of established players like Medtronic PLC and DJO Global Inc., alongside smaller, specialized companies focusing on innovation within niche areas of electrotherapy. The continued development of advanced features, such as personalized treatment protocols and integration with telehealth platforms, will be crucial for sustaining market momentum and attracting new segments of patients and healthcare providers. The long-term outlook for the electrotherapy market remains exceptionally positive, with continued growth driven by evolving healthcare needs and technological advancements.
This comprehensive report provides a detailed analysis of the global electrotherapy market, offering invaluable insights for industry stakeholders, investors, and market entrants. With a study period spanning 2019-2033, a base year of 2025, and a forecast period of 2025-2033, this report meticulously examines market dynamics, key segments, leading players, and future growth prospects. The market is projected to reach xx Million by 2033, exhibiting a CAGR of xx% during the forecast period.
Electrotherapy Industry Market Concentration & Dynamics
The global electrotherapy market exhibits a moderately concentrated landscape, with several major players holding significant market share. The market share distribution is influenced by factors such as brand recognition, technological innovation, distribution networks, and regulatory approvals. While precise market share figures for each company require further dedicated research for exact figures, key players such as Medtronic PLC and DJO Global Inc are likely to hold a substantial share. Innovation ecosystems play a crucial role, with companies constantly developing new devices and treatment modalities. Regulatory frameworks, particularly those related to medical device approvals, significantly impact market entry and growth. The presence of substitute products, such as pharmaceutical pain relievers, presents a competitive challenge. End-user trends, including increasing demand for non-invasive pain management solutions, fuel market expansion. M&A activities are relatively frequent, driven by strategic acquisitions to expand product portfolios and market reach. In the historical period (2019-2024), an estimated xx M&A deals occurred within the electrotherapy sector, contributing to market consolidation. Further analysis of data will provide exact values on individual company performance during the specific period.
Electrotherapy Industry Insights & Trends
The global electrotherapy market is experiencing robust growth, driven by several key factors. The increasing prevalence of chronic pain conditions, including back pain, arthritis, and neuropathic pain, is a major catalyst. Technological advancements, such as the development of more sophisticated devices with improved efficacy and portability, are further propelling market expansion. Consumer preferences are shifting towards minimally invasive, non-pharmaceutical pain management options. The rising adoption of electrotherapy devices in hospitals, clinics, and home healthcare settings contributes to market growth. The market is also influenced by increasing healthcare expenditure and rising geriatric populations in developed and developing countries. The market size reached approximately xx Million in 2024 and is projected to reach xx Million by 2033, driven by a significant CAGR (Compound Annual Growth Rate) of xx%. This growth is expected to continue due to factors such as an aging global population and increasing preference for non-pharmacological pain management solutions.
Key Markets & Segments Leading Electrotherapy Industry
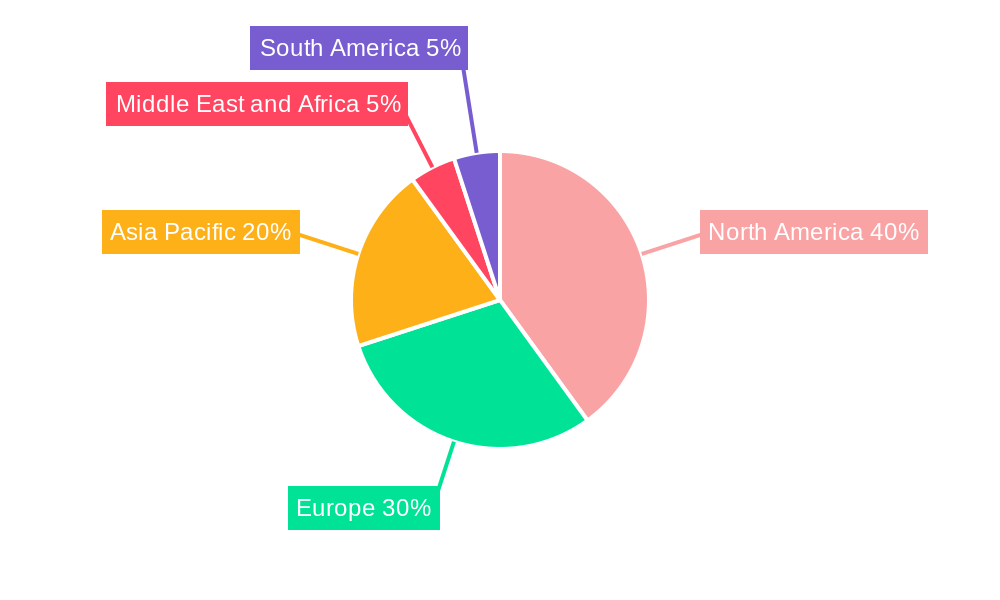
Dominant Region: North America currently holds the largest market share due to high healthcare expenditure, advanced healthcare infrastructure, and high adoption rates of electrotherapy devices. Europe follows closely, driven by similar factors. Asia-Pacific is expected to witness significant growth in the coming years, fueled by rising disposable incomes and increasing awareness of electrotherapy benefits.
Dominant Product Types: High-frequency devices are likely to dominate due to their efficacy in treating various conditions. However, the market for other product types (Med Frequency and Low Frequency) is also expanding rapidly, driven by the introduction of new, more advanced devices.
Dominant Applications: Pain relief is the largest application segment, followed by muscle injury treatment. The growing prevalence of chronic pain and musculoskeletal disorders is driving the demand for these applications.
Market Drivers:
- Increased prevalence of chronic pain conditions
- Technological advancements leading to improved device efficacy and portability
- Growing adoption in home healthcare settings
- Rising healthcare expenditure and insurance coverage
- Favorable regulatory landscape in key markets
Further detailed data-driven analysis is needed to provide precise figures on market shares of individual segments. However, North America's market dominance is largely attributed to higher healthcare expenditure and technological advancements.
Electrotherapy Industry Product Developments
Recent years have witnessed significant advancements in electrotherapy technology. The development of smaller, more portable, and user-friendly devices has broadened accessibility and convenience. Innovative features, such as integrated pain management programs and personalized treatment settings, are enhancing patient experience and treatment efficacy. The incorporation of digital technologies, including smartphone integration and remote monitoring capabilities, is improving patient adherence and treatment outcomes. These innovations have significantly improved the competitive landscape, leading to better treatment options for patients. The development of wireless and wearable devices has revolutionized patient experience and treatment modalities.
Challenges in the Electrotherapy Industry Market
The electrotherapy market faces several challenges. Stringent regulatory approvals for medical devices can delay product launches and increase costs. Supply chain disruptions can impact device availability and manufacturing costs. Intense competition among established players and emerging companies creates price pressure and necessitates continuous innovation. These factors potentially influence the overall market growth negatively, especially in times of global economic instability.
Forces Driving Electrotherapy Industry Growth
Key growth drivers include technological advancements leading to improved device efficacy and portability, the rising prevalence of chronic pain conditions, growing awareness and adoption of non-pharmacological pain management, rising healthcare expenditure, and favorable regulatory support in several regions. The aging global population, coupled with increased disposable incomes in developing countries, also contributes significantly.
Long-Term Growth Catalysts in the Electrotherapy Industry
Long-term growth will be fueled by continuous technological innovation, strategic partnerships and collaborations between device manufacturers and healthcare providers, expansion into emerging markets, and increased investment in research and development to address unmet clinical needs. Further, personalized medicine approaches, where treatment is tailored to individual patients, present a key avenue for future growth.
Emerging Opportunities in Electrotherapy Industry
Emerging opportunities include the development of smart electrotherapy devices with advanced features such as AI-driven treatment optimization, the expansion into new therapeutic areas beyond pain management (e.g., wound healing, rehabilitation), and the penetration into underserved markets through innovative distribution models. Growing interest in telehealth and remote patient monitoring also opens new possibilities.
Leading Players in the Electrotherapy Industry Sector
- HMS Medical system
- NeuroMetrix Inc
- BTL Corporate
- Dynatronics Corporation
- DJO Global Inc
- Medtronic PLC
- Astar
- Zynex Medical
- GymnaUniphy
- AliMed
- Eme srl
- Omron Healthcare
Key Milestones in Electrotherapy Industry Industry
March 2022: OMRON's Focus TENS Therapy for Knee (PM-710) device shows promising results in reducing pain associated with mild to moderate knee osteoarthritis, furthering the market's focus on TENS technology for specific conditions.
January 2022: TensCare's launch of the Mynd migraine relief device at Arab Health 2022 demonstrates the industry's increasing focus on wearable, targeted electrotherapy solutions for specific pain conditions like migraine. This highlights expansion into new therapeutic areas and improved device portability.
Strategic Outlook for Electrotherapy Industry Market
The electrotherapy market holds significant future potential driven by continuous technological advancements, growing adoption rates, and expansion into new therapeutic areas. Strategic opportunities include focusing on personalized treatment approaches, developing integrated digital health solutions, and forging strategic partnerships to enhance market penetration and access wider patient populations. Focusing on research and development will contribute to improved device design, efficacy, and patient experience, and is crucial for long-term market success.
Electrotherapy Industry Segmentation
-
1. Product Type
- 1.1. High Frequency
- 1.2. Med Frequency
- 1.3. Low Frequency
-
2. Application
- 2.1. Nervous Disease
- 2.2. Muscle Injury
- 2.3. Inflammation
- 2.4. Pain Relief
- 2.5. Others
Electrotherapy Industry Segmentation By Geography
-
1. North America
- 1.1. United States
- 1.2. Canada
- 1.3. Mexico
-
2. Europe
- 2.1. Germany
- 2.2. United Kingdom
- 2.3. France
- 2.4. Italy
- 2.5. Spain
- 2.6. Rest of Europe
-
3. Asia Pacific
- 3.1. China
- 3.2. Japan
- 3.3. India
- 3.4. Australia
- 3.5. South Korea
- 3.6. Rest of Asia Pacific
-
4. Middle East and Africa
- 4.1. GCC
- 4.2. South Africa
- 4.3. Rest of Middle East and Africa
-
5. South America
- 5.1. Brazil
- 5.2. Argentina
- 5.3. Rest of South America
Electrotherapy Industry REPORT HIGHLIGHTS
| Aspects | Details |
|---|---|
| Study Period | 2019-2033 |
| Base Year | 2024 |
| Estimated Year | 2025 |
| Forecast Period | 2025-2033 |
| Historical Period | 2019-2024 |
| Growth Rate | CAGR of 4.20% from 2019-2033 |
| Segmentation |
|
Table of Contents
- 1. Introduction
- 1.1. Research Scope
- 1.2. Market Segmentation
- 1.3. Research Methodology
- 1.4. Definitions and Assumptions
- 2. Executive Summary
- 2.1. Introduction
- 3. Market Dynamics
- 3.1. Introduction
- 3.2. Market Drivers
- 3.2.1. Increasing Spinal Injuries and Back Pain; Rising Sports Injuries
- 3.3. Market Restrains
- 3.3.1. Lack of Awareness of the Treatment
- 3.4. Market Trends
- 3.4.1. Nervous Disease Segment is Expected to Hold a Significant Market Share Over the Forecast Period
- 4. Market Factor Analysis
- 4.1. Porters Five Forces
- 4.2. Supply/Value Chain
- 4.3. PESTEL analysis
- 4.4. Market Entropy
- 4.5. Patent/Trademark Analysis
- 5. Global Electrotherapy Industry Analysis, Insights and Forecast, 2019-2031
- 5.1. Market Analysis, Insights and Forecast - by Product Type
- 5.1.1. High Frequency
- 5.1.2. Med Frequency
- 5.1.3. Low Frequency
- 5.2. Market Analysis, Insights and Forecast - by Application
- 5.2.1. Nervous Disease
- 5.2.2. Muscle Injury
- 5.2.3. Inflammation
- 5.2.4. Pain Relief
- 5.2.5. Others
- 5.3. Market Analysis, Insights and Forecast - by Region
- 5.3.1. North America
- 5.3.2. Europe
- 5.3.3. Asia Pacific
- 5.3.4. Middle East and Africa
- 5.3.5. South America
- 5.1. Market Analysis, Insights and Forecast - by Product Type
- 6. North America Electrotherapy Industry Analysis, Insights and Forecast, 2019-2031
- 6.1. Market Analysis, Insights and Forecast - by Product Type
- 6.1.1. High Frequency
- 6.1.2. Med Frequency
- 6.1.3. Low Frequency
- 6.2. Market Analysis, Insights and Forecast - by Application
- 6.2.1. Nervous Disease
- 6.2.2. Muscle Injury
- 6.2.3. Inflammation
- 6.2.4. Pain Relief
- 6.2.5. Others
- 6.1. Market Analysis, Insights and Forecast - by Product Type
- 7. Europe Electrotherapy Industry Analysis, Insights and Forecast, 2019-2031
- 7.1. Market Analysis, Insights and Forecast - by Product Type
- 7.1.1. High Frequency
- 7.1.2. Med Frequency
- 7.1.3. Low Frequency
- 7.2. Market Analysis, Insights and Forecast - by Application
- 7.2.1. Nervous Disease
- 7.2.2. Muscle Injury
- 7.2.3. Inflammation
- 7.2.4. Pain Relief
- 7.2.5. Others
- 7.1. Market Analysis, Insights and Forecast - by Product Type
- 8. Asia Pacific Electrotherapy Industry Analysis, Insights and Forecast, 2019-2031
- 8.1. Market Analysis, Insights and Forecast - by Product Type
- 8.1.1. High Frequency
- 8.1.2. Med Frequency
- 8.1.3. Low Frequency
- 8.2. Market Analysis, Insights and Forecast - by Application
- 8.2.1. Nervous Disease
- 8.2.2. Muscle Injury
- 8.2.3. Inflammation
- 8.2.4. Pain Relief
- 8.2.5. Others
- 8.1. Market Analysis, Insights and Forecast - by Product Type
- 9. Middle East and Africa Electrotherapy Industry Analysis, Insights and Forecast, 2019-2031
- 9.1. Market Analysis, Insights and Forecast - by Product Type
- 9.1.1. High Frequency
- 9.1.2. Med Frequency
- 9.1.3. Low Frequency
- 9.2. Market Analysis, Insights and Forecast - by Application
- 9.2.1. Nervous Disease
- 9.2.2. Muscle Injury
- 9.2.3. Inflammation
- 9.2.4. Pain Relief
- 9.2.5. Others
- 9.1. Market Analysis, Insights and Forecast - by Product Type
- 10. South America Electrotherapy Industry Analysis, Insights and Forecast, 2019-2031
- 10.1. Market Analysis, Insights and Forecast - by Product Type
- 10.1.1. High Frequency
- 10.1.2. Med Frequency
- 10.1.3. Low Frequency
- 10.2. Market Analysis, Insights and Forecast - by Application
- 10.2.1. Nervous Disease
- 10.2.2. Muscle Injury
- 10.2.3. Inflammation
- 10.2.4. Pain Relief
- 10.2.5. Others
- 10.1. Market Analysis, Insights and Forecast - by Product Type
- 11. North America Electrotherapy Industry Analysis, Insights and Forecast, 2019-2031
- 11.1. Market Analysis, Insights and Forecast - By Country/Sub-region
- 11.1.1 United States
- 11.1.2 Canada
- 11.1.3 Mexico
- 12. Europe Electrotherapy Industry Analysis, Insights and Forecast, 2019-2031
- 12.1. Market Analysis, Insights and Forecast - By Country/Sub-region
- 12.1.1 Germany
- 12.1.2 United Kingdom
- 12.1.3 France
- 12.1.4 Italy
- 12.1.5 Spain
- 12.1.6 Rest of Europe
- 13. Asia Pacific Electrotherapy Industry Analysis, Insights and Forecast, 2019-2031
- 13.1. Market Analysis, Insights and Forecast - By Country/Sub-region
- 13.1.1 China
- 13.1.2 Japan
- 13.1.3 India
- 13.1.4 Australia
- 13.1.5 South Korea
- 13.1.6 Rest of Asia Pacific
- 14. Middle East and Africa Electrotherapy Industry Analysis, Insights and Forecast, 2019-2031
- 14.1. Market Analysis, Insights and Forecast - By Country/Sub-region
- 14.1.1 GCC
- 14.1.2 South Africa
- 14.1.3 Rest of Middle East and Africa
- 15. South America Electrotherapy Industry Analysis, Insights and Forecast, 2019-2031
- 15.1. Market Analysis, Insights and Forecast - By Country/Sub-region
- 15.1.1 Brazil
- 15.1.2 Argentina
- 15.1.3 Rest of South America
- 16. Competitive Analysis
- 16.1. Global Market Share Analysis 2024
- 16.2. Company Profiles
- 16.2.1 HMS Medical system
- 16.2.1.1. Overview
- 16.2.1.2. Products
- 16.2.1.3. SWOT Analysis
- 16.2.1.4. Recent Developments
- 16.2.1.5. Financials (Based on Availability)
- 16.2.2 NeuroMetrix Inc
- 16.2.2.1. Overview
- 16.2.2.2. Products
- 16.2.2.3. SWOT Analysis
- 16.2.2.4. Recent Developments
- 16.2.2.5. Financials (Based on Availability)
- 16.2.3 BTL Corporate
- 16.2.3.1. Overview
- 16.2.3.2. Products
- 16.2.3.3. SWOT Analysis
- 16.2.3.4. Recent Developments
- 16.2.3.5. Financials (Based on Availability)
- 16.2.4 Dynatronics Corporation
- 16.2.4.1. Overview
- 16.2.4.2. Products
- 16.2.4.3. SWOT Analysis
- 16.2.4.4. Recent Developments
- 16.2.4.5. Financials (Based on Availability)
- 16.2.5 DJO Global Inc
- 16.2.5.1. Overview
- 16.2.5.2. Products
- 16.2.5.3. SWOT Analysis
- 16.2.5.4. Recent Developments
- 16.2.5.5. Financials (Based on Availability)
- 16.2.6 Medtronic PLC
- 16.2.6.1. Overview
- 16.2.6.2. Products
- 16.2.6.3. SWOT Analysis
- 16.2.6.4. Recent Developments
- 16.2.6.5. Financials (Based on Availability)
- 16.2.7 Astar
- 16.2.7.1. Overview
- 16.2.7.2. Products
- 16.2.7.3. SWOT Analysis
- 16.2.7.4. Recent Developments
- 16.2.7.5. Financials (Based on Availability)
- 16.2.8 Zynex Medical
- 16.2.8.1. Overview
- 16.2.8.2. Products
- 16.2.8.3. SWOT Analysis
- 16.2.8.4. Recent Developments
- 16.2.8.5. Financials (Based on Availability)
- 16.2.9 GymnaUniphy
- 16.2.9.1. Overview
- 16.2.9.2. Products
- 16.2.9.3. SWOT Analysis
- 16.2.9.4. Recent Developments
- 16.2.9.5. Financials (Based on Availability)
- 16.2.10 AliMed
- 16.2.10.1. Overview
- 16.2.10.2. Products
- 16.2.10.3. SWOT Analysis
- 16.2.10.4. Recent Developments
- 16.2.10.5. Financials (Based on Availability)
- 16.2.11 Eme srl
- 16.2.11.1. Overview
- 16.2.11.2. Products
- 16.2.11.3. SWOT Analysis
- 16.2.11.4. Recent Developments
- 16.2.11.5. Financials (Based on Availability)
- 16.2.12 Omron Healthcare
- 16.2.12.1. Overview
- 16.2.12.2. Products
- 16.2.12.3. SWOT Analysis
- 16.2.12.4. Recent Developments
- 16.2.12.5. Financials (Based on Availability)
- 16.2.1 HMS Medical system
List of Figures
- Figure 1: Global Electrotherapy Industry Revenue Breakdown (Million, %) by Region 2024 & 2032
- Figure 2: Global Electrotherapy Industry Volume Breakdown (K Unit, %) by Region 2024 & 2032
- Figure 3: North America Electrotherapy Industry Revenue (Million), by Country 2024 & 2032
- Figure 4: North America Electrotherapy Industry Volume (K Unit), by Country 2024 & 2032
- Figure 5: North America Electrotherapy Industry Revenue Share (%), by Country 2024 & 2032
- Figure 6: North America Electrotherapy Industry Volume Share (%), by Country 2024 & 2032
- Figure 7: Europe Electrotherapy Industry Revenue (Million), by Country 2024 & 2032
- Figure 8: Europe Electrotherapy Industry Volume (K Unit), by Country 2024 & 2032
- Figure 9: Europe Electrotherapy Industry Revenue Share (%), by Country 2024 & 2032
- Figure 10: Europe Electrotherapy Industry Volume Share (%), by Country 2024 & 2032
- Figure 11: Asia Pacific Electrotherapy Industry Revenue (Million), by Country 2024 & 2032
- Figure 12: Asia Pacific Electrotherapy Industry Volume (K Unit), by Country 2024 & 2032
- Figure 13: Asia Pacific Electrotherapy Industry Revenue Share (%), by Country 2024 & 2032
- Figure 14: Asia Pacific Electrotherapy Industry Volume Share (%), by Country 2024 & 2032
- Figure 15: Middle East and Africa Electrotherapy Industry Revenue (Million), by Country 2024 & 2032
- Figure 16: Middle East and Africa Electrotherapy Industry Volume (K Unit), by Country 2024 & 2032
- Figure 17: Middle East and Africa Electrotherapy Industry Revenue Share (%), by Country 2024 & 2032
- Figure 18: Middle East and Africa Electrotherapy Industry Volume Share (%), by Country 2024 & 2032
- Figure 19: South America Electrotherapy Industry Revenue (Million), by Country 2024 & 2032
- Figure 20: South America Electrotherapy Industry Volume (K Unit), by Country 2024 & 2032
- Figure 21: South America Electrotherapy Industry Revenue Share (%), by Country 2024 & 2032
- Figure 22: South America Electrotherapy Industry Volume Share (%), by Country 2024 & 2032
- Figure 23: North America Electrotherapy Industry Revenue (Million), by Product Type 2024 & 2032
- Figure 24: North America Electrotherapy Industry Volume (K Unit), by Product Type 2024 & 2032
- Figure 25: North America Electrotherapy Industry Revenue Share (%), by Product Type 2024 & 2032
- Figure 26: North America Electrotherapy Industry Volume Share (%), by Product Type 2024 & 2032
- Figure 27: North America Electrotherapy Industry Revenue (Million), by Application 2024 & 2032
- Figure 28: North America Electrotherapy Industry Volume (K Unit), by Application 2024 & 2032
- Figure 29: North America Electrotherapy Industry Revenue Share (%), by Application 2024 & 2032
- Figure 30: North America Electrotherapy Industry Volume Share (%), by Application 2024 & 2032
- Figure 31: North America Electrotherapy Industry Revenue (Million), by Country 2024 & 2032
- Figure 32: North America Electrotherapy Industry Volume (K Unit), by Country 2024 & 2032
- Figure 33: North America Electrotherapy Industry Revenue Share (%), by Country 2024 & 2032
- Figure 34: North America Electrotherapy Industry Volume Share (%), by Country 2024 & 2032
- Figure 35: Europe Electrotherapy Industry Revenue (Million), by Product Type 2024 & 2032
- Figure 36: Europe Electrotherapy Industry Volume (K Unit), by Product Type 2024 & 2032
- Figure 37: Europe Electrotherapy Industry Revenue Share (%), by Product Type 2024 & 2032
- Figure 38: Europe Electrotherapy Industry Volume Share (%), by Product Type 2024 & 2032
- Figure 39: Europe Electrotherapy Industry Revenue (Million), by Application 2024 & 2032
- Figure 40: Europe Electrotherapy Industry Volume (K Unit), by Application 2024 & 2032
- Figure 41: Europe Electrotherapy Industry Revenue Share (%), by Application 2024 & 2032
- Figure 42: Europe Electrotherapy Industry Volume Share (%), by Application 2024 & 2032
- Figure 43: Europe Electrotherapy Industry Revenue (Million), by Country 2024 & 2032
- Figure 44: Europe Electrotherapy Industry Volume (K Unit), by Country 2024 & 2032
- Figure 45: Europe Electrotherapy Industry Revenue Share (%), by Country 2024 & 2032
- Figure 46: Europe Electrotherapy Industry Volume Share (%), by Country 2024 & 2032
- Figure 47: Asia Pacific Electrotherapy Industry Revenue (Million), by Product Type 2024 & 2032
- Figure 48: Asia Pacific Electrotherapy Industry Volume (K Unit), by Product Type 2024 & 2032
- Figure 49: Asia Pacific Electrotherapy Industry Revenue Share (%), by Product Type 2024 & 2032
- Figure 50: Asia Pacific Electrotherapy Industry Volume Share (%), by Product Type 2024 & 2032
- Figure 51: Asia Pacific Electrotherapy Industry Revenue (Million), by Application 2024 & 2032
- Figure 52: Asia Pacific Electrotherapy Industry Volume (K Unit), by Application 2024 & 2032
- Figure 53: Asia Pacific Electrotherapy Industry Revenue Share (%), by Application 2024 & 2032
- Figure 54: Asia Pacific Electrotherapy Industry Volume Share (%), by Application 2024 & 2032
- Figure 55: Asia Pacific Electrotherapy Industry Revenue (Million), by Country 2024 & 2032
- Figure 56: Asia Pacific Electrotherapy Industry Volume (K Unit), by Country 2024 & 2032
- Figure 57: Asia Pacific Electrotherapy Industry Revenue Share (%), by Country 2024 & 2032
- Figure 58: Asia Pacific Electrotherapy Industry Volume Share (%), by Country 2024 & 2032
- Figure 59: Middle East and Africa Electrotherapy Industry Revenue (Million), by Product Type 2024 & 2032
- Figure 60: Middle East and Africa Electrotherapy Industry Volume (K Unit), by Product Type 2024 & 2032
- Figure 61: Middle East and Africa Electrotherapy Industry Revenue Share (%), by Product Type 2024 & 2032
- Figure 62: Middle East and Africa Electrotherapy Industry Volume Share (%), by Product Type 2024 & 2032
- Figure 63: Middle East and Africa Electrotherapy Industry Revenue (Million), by Application 2024 & 2032
- Figure 64: Middle East and Africa Electrotherapy Industry Volume (K Unit), by Application 2024 & 2032
- Figure 65: Middle East and Africa Electrotherapy Industry Revenue Share (%), by Application 2024 & 2032
- Figure 66: Middle East and Africa Electrotherapy Industry Volume Share (%), by Application 2024 & 2032
- Figure 67: Middle East and Africa Electrotherapy Industry Revenue (Million), by Country 2024 & 2032
- Figure 68: Middle East and Africa Electrotherapy Industry Volume (K Unit), by Country 2024 & 2032
- Figure 69: Middle East and Africa Electrotherapy Industry Revenue Share (%), by Country 2024 & 2032
- Figure 70: Middle East and Africa Electrotherapy Industry Volume Share (%), by Country 2024 & 2032
- Figure 71: South America Electrotherapy Industry Revenue (Million), by Product Type 2024 & 2032
- Figure 72: South America Electrotherapy Industry Volume (K Unit), by Product Type 2024 & 2032
- Figure 73: South America Electrotherapy Industry Revenue Share (%), by Product Type 2024 & 2032
- Figure 74: South America Electrotherapy Industry Volume Share (%), by Product Type 2024 & 2032
- Figure 75: South America Electrotherapy Industry Revenue (Million), by Application 2024 & 2032
- Figure 76: South America Electrotherapy Industry Volume (K Unit), by Application 2024 & 2032
- Figure 77: South America Electrotherapy Industry Revenue Share (%), by Application 2024 & 2032
- Figure 78: South America Electrotherapy Industry Volume Share (%), by Application 2024 & 2032
- Figure 79: South America Electrotherapy Industry Revenue (Million), by Country 2024 & 2032
- Figure 80: South America Electrotherapy Industry Volume (K Unit), by Country 2024 & 2032
- Figure 81: South America Electrotherapy Industry Revenue Share (%), by Country 2024 & 2032
- Figure 82: South America Electrotherapy Industry Volume Share (%), by Country 2024 & 2032
List of Tables
- Table 1: Global Electrotherapy Industry Revenue Million Forecast, by Region 2019 & 2032
- Table 2: Global Electrotherapy Industry Volume K Unit Forecast, by Region 2019 & 2032
- Table 3: Global Electrotherapy Industry Revenue Million Forecast, by Product Type 2019 & 2032
- Table 4: Global Electrotherapy Industry Volume K Unit Forecast, by Product Type 2019 & 2032
- Table 5: Global Electrotherapy Industry Revenue Million Forecast, by Application 2019 & 2032
- Table 6: Global Electrotherapy Industry Volume K Unit Forecast, by Application 2019 & 2032
- Table 7: Global Electrotherapy Industry Revenue Million Forecast, by Region 2019 & 2032
- Table 8: Global Electrotherapy Industry Volume K Unit Forecast, by Region 2019 & 2032
- Table 9: Global Electrotherapy Industry Revenue Million Forecast, by Country 2019 & 2032
- Table 10: Global Electrotherapy Industry Volume K Unit Forecast, by Country 2019 & 2032
- Table 11: United States Electrotherapy Industry Revenue (Million) Forecast, by Application 2019 & 2032
- Table 12: United States Electrotherapy Industry Volume (K Unit) Forecast, by Application 2019 & 2032
- Table 13: Canada Electrotherapy Industry Revenue (Million) Forecast, by Application 2019 & 2032
- Table 14: Canada Electrotherapy Industry Volume (K Unit) Forecast, by Application 2019 & 2032
- Table 15: Mexico Electrotherapy Industry Revenue (Million) Forecast, by Application 2019 & 2032
- Table 16: Mexico Electrotherapy Industry Volume (K Unit) Forecast, by Application 2019 & 2032
- Table 17: Global Electrotherapy Industry Revenue Million Forecast, by Country 2019 & 2032
- Table 18: Global Electrotherapy Industry Volume K Unit Forecast, by Country 2019 & 2032
- Table 19: Germany Electrotherapy Industry Revenue (Million) Forecast, by Application 2019 & 2032
- Table 20: Germany Electrotherapy Industry Volume (K Unit) Forecast, by Application 2019 & 2032
- Table 21: United Kingdom Electrotherapy Industry Revenue (Million) Forecast, by Application 2019 & 2032
- Table 22: United Kingdom Electrotherapy Industry Volume (K Unit) Forecast, by Application 2019 & 2032
- Table 23: France Electrotherapy Industry Revenue (Million) Forecast, by Application 2019 & 2032
- Table 24: France Electrotherapy Industry Volume (K Unit) Forecast, by Application 2019 & 2032
- Table 25: Italy Electrotherapy Industry Revenue (Million) Forecast, by Application 2019 & 2032
- Table 26: Italy Electrotherapy Industry Volume (K Unit) Forecast, by Application 2019 & 2032
- Table 27: Spain Electrotherapy Industry Revenue (Million) Forecast, by Application 2019 & 2032
- Table 28: Spain Electrotherapy Industry Volume (K Unit) Forecast, by Application 2019 & 2032
- Table 29: Rest of Europe Electrotherapy Industry Revenue (Million) Forecast, by Application 2019 & 2032
- Table 30: Rest of Europe Electrotherapy Industry Volume (K Unit) Forecast, by Application 2019 & 2032
- Table 31: Global Electrotherapy Industry Revenue Million Forecast, by Country 2019 & 2032
- Table 32: Global Electrotherapy Industry Volume K Unit Forecast, by Country 2019 & 2032
- Table 33: China Electrotherapy Industry Revenue (Million) Forecast, by Application 2019 & 2032
- Table 34: China Electrotherapy Industry Volume (K Unit) Forecast, by Application 2019 & 2032
- Table 35: Japan Electrotherapy Industry Revenue (Million) Forecast, by Application 2019 & 2032
- Table 36: Japan Electrotherapy Industry Volume (K Unit) Forecast, by Application 2019 & 2032
- Table 37: India Electrotherapy Industry Revenue (Million) Forecast, by Application 2019 & 2032
- Table 38: India Electrotherapy Industry Volume (K Unit) Forecast, by Application 2019 & 2032
- Table 39: Australia Electrotherapy Industry Revenue (Million) Forecast, by Application 2019 & 2032
- Table 40: Australia Electrotherapy Industry Volume (K Unit) Forecast, by Application 2019 & 2032
- Table 41: South Korea Electrotherapy Industry Revenue (Million) Forecast, by Application 2019 & 2032
- Table 42: South Korea Electrotherapy Industry Volume (K Unit) Forecast, by Application 2019 & 2032
- Table 43: Rest of Asia Pacific Electrotherapy Industry Revenue (Million) Forecast, by Application 2019 & 2032
- Table 44: Rest of Asia Pacific Electrotherapy Industry Volume (K Unit) Forecast, by Application 2019 & 2032
- Table 45: Global Electrotherapy Industry Revenue Million Forecast, by Country 2019 & 2032
- Table 46: Global Electrotherapy Industry Volume K Unit Forecast, by Country 2019 & 2032
- Table 47: GCC Electrotherapy Industry Revenue (Million) Forecast, by Application 2019 & 2032
- Table 48: GCC Electrotherapy Industry Volume (K Unit) Forecast, by Application 2019 & 2032
- Table 49: South Africa Electrotherapy Industry Revenue (Million) Forecast, by Application 2019 & 2032
- Table 50: South Africa Electrotherapy Industry Volume (K Unit) Forecast, by Application 2019 & 2032
- Table 51: Rest of Middle East and Africa Electrotherapy Industry Revenue (Million) Forecast, by Application 2019 & 2032
- Table 52: Rest of Middle East and Africa Electrotherapy Industry Volume (K Unit) Forecast, by Application 2019 & 2032
- Table 53: Global Electrotherapy Industry Revenue Million Forecast, by Country 2019 & 2032
- Table 54: Global Electrotherapy Industry Volume K Unit Forecast, by Country 2019 & 2032
- Table 55: Brazil Electrotherapy Industry Revenue (Million) Forecast, by Application 2019 & 2032
- Table 56: Brazil Electrotherapy Industry Volume (K Unit) Forecast, by Application 2019 & 2032
- Table 57: Argentina Electrotherapy Industry Revenue (Million) Forecast, by Application 2019 & 2032
- Table 58: Argentina Electrotherapy Industry Volume (K Unit) Forecast, by Application 2019 & 2032
- Table 59: Rest of South America Electrotherapy Industry Revenue (Million) Forecast, by Application 2019 & 2032
- Table 60: Rest of South America Electrotherapy Industry Volume (K Unit) Forecast, by Application 2019 & 2032
- Table 61: Global Electrotherapy Industry Revenue Million Forecast, by Product Type 2019 & 2032
- Table 62: Global Electrotherapy Industry Volume K Unit Forecast, by Product Type 2019 & 2032
- Table 63: Global Electrotherapy Industry Revenue Million Forecast, by Application 2019 & 2032
- Table 64: Global Electrotherapy Industry Volume K Unit Forecast, by Application 2019 & 2032
- Table 65: Global Electrotherapy Industry Revenue Million Forecast, by Country 2019 & 2032
- Table 66: Global Electrotherapy Industry Volume K Unit Forecast, by Country 2019 & 2032
- Table 67: United States Electrotherapy Industry Revenue (Million) Forecast, by Application 2019 & 2032
- Table 68: United States Electrotherapy Industry Volume (K Unit) Forecast, by Application 2019 & 2032
- Table 69: Canada Electrotherapy Industry Revenue (Million) Forecast, by Application 2019 & 2032
- Table 70: Canada Electrotherapy Industry Volume (K Unit) Forecast, by Application 2019 & 2032
- Table 71: Mexico Electrotherapy Industry Revenue (Million) Forecast, by Application 2019 & 2032
- Table 72: Mexico Electrotherapy Industry Volume (K Unit) Forecast, by Application 2019 & 2032
- Table 73: Global Electrotherapy Industry Revenue Million Forecast, by Product Type 2019 & 2032
- Table 74: Global Electrotherapy Industry Volume K Unit Forecast, by Product Type 2019 & 2032
- Table 75: Global Electrotherapy Industry Revenue Million Forecast, by Application 2019 & 2032
- Table 76: Global Electrotherapy Industry Volume K Unit Forecast, by Application 2019 & 2032
- Table 77: Global Electrotherapy Industry Revenue Million Forecast, by Country 2019 & 2032
- Table 78: Global Electrotherapy Industry Volume K Unit Forecast, by Country 2019 & 2032
- Table 79: Germany Electrotherapy Industry Revenue (Million) Forecast, by Application 2019 & 2032
- Table 80: Germany Electrotherapy Industry Volume (K Unit) Forecast, by Application 2019 & 2032
- Table 81: United Kingdom Electrotherapy Industry Revenue (Million) Forecast, by Application 2019 & 2032
- Table 82: United Kingdom Electrotherapy Industry Volume (K Unit) Forecast, by Application 2019 & 2032
- Table 83: France Electrotherapy Industry Revenue (Million) Forecast, by Application 2019 & 2032
- Table 84: France Electrotherapy Industry Volume (K Unit) Forecast, by Application 2019 & 2032
- Table 85: Italy Electrotherapy Industry Revenue (Million) Forecast, by Application 2019 & 2032
- Table 86: Italy Electrotherapy Industry Volume (K Unit) Forecast, by Application 2019 & 2032
- Table 87: Spain Electrotherapy Industry Revenue (Million) Forecast, by Application 2019 & 2032
- Table 88: Spain Electrotherapy Industry Volume (K Unit) Forecast, by Application 2019 & 2032
- Table 89: Rest of Europe Electrotherapy Industry Revenue (Million) Forecast, by Application 2019 & 2032
- Table 90: Rest of Europe Electrotherapy Industry Volume (K Unit) Forecast, by Application 2019 & 2032
- Table 91: Global Electrotherapy Industry Revenue Million Forecast, by Product Type 2019 & 2032
- Table 92: Global Electrotherapy Industry Volume K Unit Forecast, by Product Type 2019 & 2032
- Table 93: Global Electrotherapy Industry Revenue Million Forecast, by Application 2019 & 2032
- Table 94: Global Electrotherapy Industry Volume K Unit Forecast, by Application 2019 & 2032
- Table 95: Global Electrotherapy Industry Revenue Million Forecast, by Country 2019 & 2032
- Table 96: Global Electrotherapy Industry Volume K Unit Forecast, by Country 2019 & 2032
- Table 97: China Electrotherapy Industry Revenue (Million) Forecast, by Application 2019 & 2032
- Table 98: China Electrotherapy Industry Volume (K Unit) Forecast, by Application 2019 & 2032
- Table 99: Japan Electrotherapy Industry Revenue (Million) Forecast, by Application 2019 & 2032
- Table 100: Japan Electrotherapy Industry Volume (K Unit) Forecast, by Application 2019 & 2032
- Table 101: India Electrotherapy Industry Revenue (Million) Forecast, by Application 2019 & 2032
- Table 102: India Electrotherapy Industry Volume (K Unit) Forecast, by Application 2019 & 2032
- Table 103: Australia Electrotherapy Industry Revenue (Million) Forecast, by Application 2019 & 2032
- Table 104: Australia Electrotherapy Industry Volume (K Unit) Forecast, by Application 2019 & 2032
- Table 105: South Korea Electrotherapy Industry Revenue (Million) Forecast, by Application 2019 & 2032
- Table 106: South Korea Electrotherapy Industry Volume (K Unit) Forecast, by Application 2019 & 2032
- Table 107: Rest of Asia Pacific Electrotherapy Industry Revenue (Million) Forecast, by Application 2019 & 2032
- Table 108: Rest of Asia Pacific Electrotherapy Industry Volume (K Unit) Forecast, by Application 2019 & 2032
- Table 109: Global Electrotherapy Industry Revenue Million Forecast, by Product Type 2019 & 2032
- Table 110: Global Electrotherapy Industry Volume K Unit Forecast, by Product Type 2019 & 2032
- Table 111: Global Electrotherapy Industry Revenue Million Forecast, by Application 2019 & 2032
- Table 112: Global Electrotherapy Industry Volume K Unit Forecast, by Application 2019 & 2032
- Table 113: Global Electrotherapy Industry Revenue Million Forecast, by Country 2019 & 2032
- Table 114: Global Electrotherapy Industry Volume K Unit Forecast, by Country 2019 & 2032
- Table 115: GCC Electrotherapy Industry Revenue (Million) Forecast, by Application 2019 & 2032
- Table 116: GCC Electrotherapy Industry Volume (K Unit) Forecast, by Application 2019 & 2032
- Table 117: South Africa Electrotherapy Industry Revenue (Million) Forecast, by Application 2019 & 2032
- Table 118: South Africa Electrotherapy Industry Volume (K Unit) Forecast, by Application 2019 & 2032
- Table 119: Rest of Middle East and Africa Electrotherapy Industry Revenue (Million) Forecast, by Application 2019 & 2032
- Table 120: Rest of Middle East and Africa Electrotherapy Industry Volume (K Unit) Forecast, by Application 2019 & 2032
- Table 121: Global Electrotherapy Industry Revenue Million Forecast, by Product Type 2019 & 2032
- Table 122: Global Electrotherapy Industry Volume K Unit Forecast, by Product Type 2019 & 2032
- Table 123: Global Electrotherapy Industry Revenue Million Forecast, by Application 2019 & 2032
- Table 124: Global Electrotherapy Industry Volume K Unit Forecast, by Application 2019 & 2032
- Table 125: Global Electrotherapy Industry Revenue Million Forecast, by Country 2019 & 2032
- Table 126: Global Electrotherapy Industry Volume K Unit Forecast, by Country 2019 & 2032
- Table 127: Brazil Electrotherapy Industry Revenue (Million) Forecast, by Application 2019 & 2032
- Table 128: Brazil Electrotherapy Industry Volume (K Unit) Forecast, by Application 2019 & 2032
- Table 129: Argentina Electrotherapy Industry Revenue (Million) Forecast, by Application 2019 & 2032
- Table 130: Argentina Electrotherapy Industry Volume (K Unit) Forecast, by Application 2019 & 2032
- Table 131: Rest of South America Electrotherapy Industry Revenue (Million) Forecast, by Application 2019 & 2032
- Table 132: Rest of South America Electrotherapy Industry Volume (K Unit) Forecast, by Application 2019 & 2032
Frequently Asked Questions
1. What is the projected Compound Annual Growth Rate (CAGR) of the Electrotherapy Industry?
The projected CAGR is approximately 4.20%.
2. Which companies are prominent players in the Electrotherapy Industry?
Key companies in the market include HMS Medical system, NeuroMetrix Inc, BTL Corporate, Dynatronics Corporation, DJO Global Inc, Medtronic PLC, Astar, Zynex Medical, GymnaUniphy, AliMed, Eme srl, Omron Healthcare.
3. What are the main segments of the Electrotherapy Industry?
The market segments include Product Type, Application.
4. Can you provide details about the market size?
The market size is estimated to be USD XX Million as of 2022.
5. What are some drivers contributing to market growth?
Increasing Spinal Injuries and Back Pain; Rising Sports Injuries.
6. What are the notable trends driving market growth?
Nervous Disease Segment is Expected to Hold a Significant Market Share Over the Forecast Period.
7. Are there any restraints impacting market growth?
Lack of Awareness of the Treatment.
8. Can you provide examples of recent developments in the market?
March 2022: The OMRON is conducting studies for valuated for its favorable effectiveness in lowering pain for people with mild to moderate knee "wear and tear" with its Focus TENS (Transcutaneous Electrical Nerve Stimulation) Therapy for Knee (PM-710) device.
9. What pricing options are available for accessing the report?
Pricing options include single-user, multi-user, and enterprise licenses priced at USD 4750, USD 5250, and USD 8750 respectively.
10. Is the market size provided in terms of value or volume?
The market size is provided in terms of value, measured in Million and volume, measured in K Unit.
11. Are there any specific market keywords associated with the report?
Yes, the market keyword associated with the report is "Electrotherapy Industry," which aids in identifying and referencing the specific market segment covered.
12. How do I determine which pricing option suits my needs best?
The pricing options vary based on user requirements and access needs. Individual users may opt for single-user licenses, while businesses requiring broader access may choose multi-user or enterprise licenses for cost-effective access to the report.
13. Are there any additional resources or data provided in the Electrotherapy Industry report?
While the report offers comprehensive insights, it's advisable to review the specific contents or supplementary materials provided to ascertain if additional resources or data are available.
14. How can I stay updated on further developments or reports in the Electrotherapy Industry?
To stay informed about further developments, trends, and reports in the Electrotherapy Industry, consider subscribing to industry newsletters, following relevant companies and organizations, or regularly checking reputable industry news sources and publications.
Methodology
Step 1 - Identification of Relevant Samples Size from Population Database


Step 2 - Approaches for Defining Global Market Size (Value, Volume* & Price*)

Note*: In applicable scenarios
Step 3 - Data Sources
Primary Research
- Web Analytics
- Survey Reports
- Research Institute
- Latest Research Reports
- Opinion Leaders
Secondary Research
- Annual Reports
- White Paper
- Latest Press Release
- Industry Association
- Paid Database
- Investor Presentations

Step 4 - Data Triangulation
Involves using different sources of information in order to increase the validity of a study
These sources are likely to be stakeholders in a program - participants, other researchers, program staff, other community members, and so on.
Then we put all data in single framework & apply various statistical tools to find out the dynamic on the market.
During the analysis stage, feedback from the stakeholder groups would be compared to determine areas of agreement as well as areas of divergence
