

Key Insights
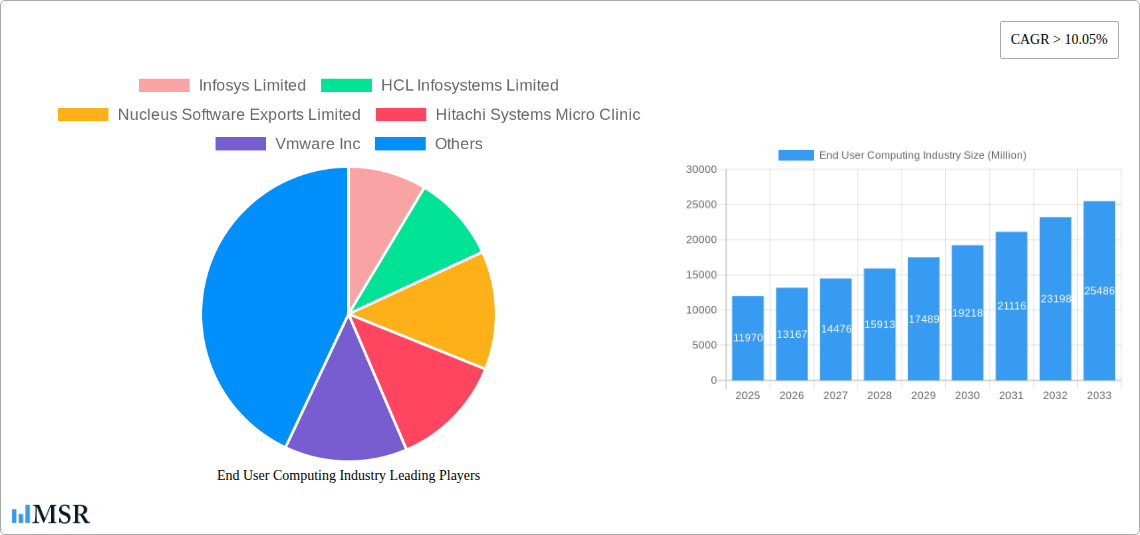
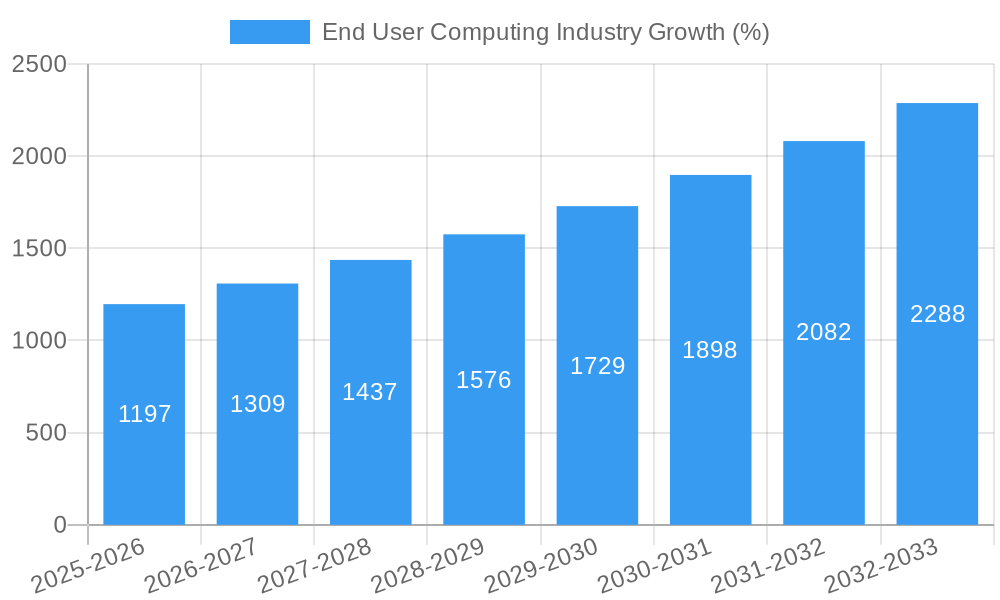
The End-User Computing (EUC) market, valued at $11.97 billion in 2025, is experiencing robust growth, projected to maintain a Compound Annual Growth Rate (CAGR) exceeding 10.05% from 2025 to 2033. This expansion is fueled by several key drivers. The increasing adoption of cloud-based solutions, driven by enhanced scalability, cost-effectiveness, and accessibility, significantly contributes to market growth. Furthermore, the burgeoning demand for improved workplace productivity and collaboration tools, particularly among large enterprises, is a major catalyst. The rise of remote work models, accelerated by recent global events, necessitates robust and secure EUC infrastructure, further stimulating market expansion. Segmentation reveals a strong preference for cloud deployment models over on-premise solutions, reflecting the industry's shift towards agility and flexibility. Significant market segments include IT and Telecom, Banking, Financial Services and Insurance (BFSI), and Healthcare, each exhibiting strong demand for advanced EUC solutions. The competitive landscape is dynamic, with established players like Infosys, HCL, and VMware competing alongside emerging technology providers and cloud giants like Amazon Web Services and Nutanix.
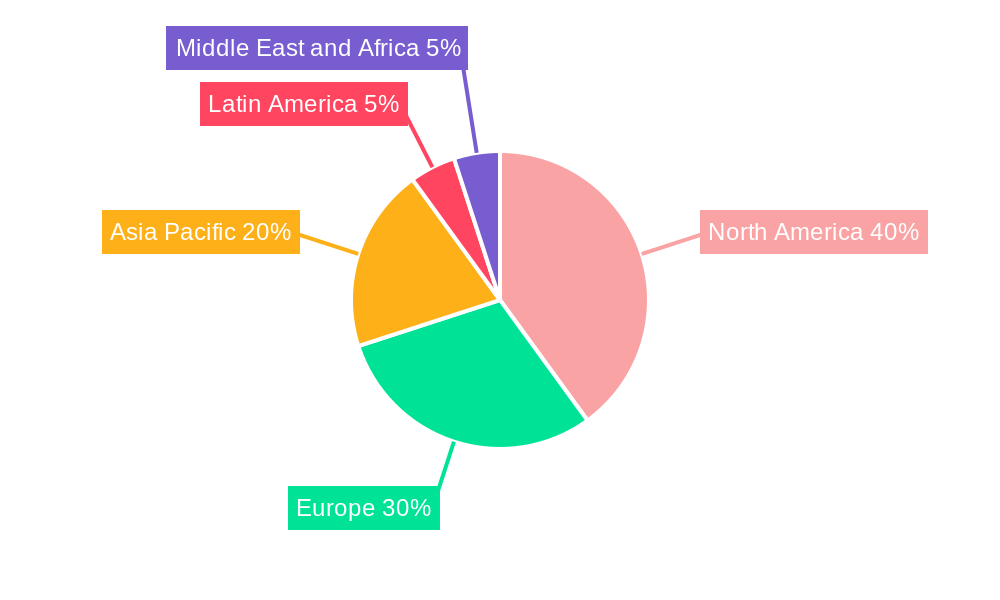
The projected growth trajectory suggests continued market expansion throughout the forecast period. While specific regional breakdowns are missing, it's reasonable to assume that North America and Europe will maintain significant market shares, given their established technological infrastructure and high adoption rates. However, the Asia-Pacific region is expected to witness substantial growth driven by increasing digitalization and economic development. The restraints on growth are likely to include challenges associated with data security and privacy concerns in cloud environments, as well as the complexities of integrating new EUC solutions with existing IT infrastructure within organizations. This necessitates a strategic approach by vendors focusing on robust security measures and seamless integration capabilities. The continuing evolution of technologies like artificial intelligence (AI) and machine learning (ML) will further shape the EUC landscape, leading to smarter, more efficient, and user-friendly solutions.
End User Computing (EUC) Industry Report: 2019-2033
This comprehensive report provides a detailed analysis of the End User Computing industry, encompassing market dynamics, key segments, leading players, and future growth opportunities. With a study period spanning 2019-2033, a base year of 2025, and an estimated year of 2025, this report offers invaluable insights for stakeholders across the EUC landscape. The forecast period covers 2025-2033, building upon the historical period of 2019-2024. The global market size is predicted to reach xx Million by 2033, exhibiting a CAGR of xx%.
End User Computing Industry Market Concentration & Dynamics
The End User Computing market exhibits a moderately concentrated landscape, with several major players vying for market share. Infosys Limited, HCL Infosystems Limited, VMware Inc, and Citrix Systems Inc are some of the prominent companies shaping the industry. Market share analysis reveals that the top 5 players hold approximately xx% of the global market, as of 2025.
Market Dynamics:
- Innovation Ecosystem: Continuous innovation drives market growth, with advancements in cloud computing, virtualization, and security playing crucial roles.
- Regulatory Frameworks: Data privacy regulations (e.g., GDPR, CCPA) significantly impact market dynamics, pushing for robust security solutions.
- Substitute Products: The emergence of alternative technologies like serverless computing and edge computing presents both challenges and opportunities for existing players.
- End-User Trends: The increasing adoption of remote work and BYOD (Bring Your Own Device) policies is transforming end-user computing needs and demands.
- M&A Activities: The EUC industry has witnessed xx M&A deals in the last 5 years, indicating a trend of consolidation and expansion within the sector. These deals predominantly focused on expanding service offerings and geographic reach.
End User Computing Industry Insights & Trends
The End User Computing market is experiencing robust growth, fueled by the increasing digital transformation initiatives across various industries. The global market size reached xx Million in 2024 and is projected to reach xx Million by 2033, exhibiting a CAGR of xx%. Key drivers include:
- Growing Demand for Cloud-Based Solutions: Cloud adoption is accelerating due to its scalability, cost-effectiveness, and enhanced flexibility.
- Rise of Mobile and Remote Work: The shift towards remote work and the proliferation of mobile devices are increasing demand for secure and accessible EUC solutions.
- Increased Focus on Cybersecurity: Growing cyber threats are driving investments in advanced security solutions, bolstering market growth.
- Adoption of AI and Machine Learning: Integration of AI/ML enhances efficiency and improves user experience, further driving market growth.
Key Markets & Segments Leading End User Computing Industry
The North American region currently dominates the End User Computing market, driven by robust technological advancements and high adoption rates among large enterprises. However, the Asia-Pacific region exhibits the highest growth potential, owing to the burgeoning IT sector and expanding digital economy.
Dominant Segments:
- Type: Solutions segment accounts for the largest revenue share, driven by increasing demand for sophisticated software and hardware solutions.
- Services: The services segment is experiencing significant growth, driven by a need for managed services and IT support.
- Organization Size: Large enterprises represent a significant portion of the market share, driven by their increased IT budgets and complex infrastructure needs. SMEs are also showing strong growth, driven by the need to improve business processes.
- Deployment Mode: Cloud deployment is rapidly gaining traction, driven by its scalability and cost-effectiveness, surpassing on-premise deployment in market share.
- End-user Industry: Banking, Financial Services, and Insurance (BFSI), IT and Telecom sectors dominate market share, followed by Healthcare and Retail, with robust growth expected in Other End-user Industries.
Growth Drivers (by Segment):
- BFSI: Stringent regulatory compliance and the need for secure data management are driving high adoption.
- IT & Telecom: High investments in infrastructure and the need to optimize IT operations are driving growth.
- Healthcare: Growing adoption of telehealth and electronic health records are key factors driving market growth.
- Retail: Growing adoption of omnichannel strategies is driving demand for seamless end-user computing solutions.
End User Computing Industry Product Developments
Recent advancements in EUC solutions include the integration of AI-powered features for enhanced security and efficiency, sophisticated cloud-based platforms, and improved user interfaces to enhance productivity. These innovations provide competitive advantages by improving user experience, enhancing security, and facilitating streamlined workflows. Fujitsu's recent CPU/GPU resource optimization technology addresses the global GPU shortage, demonstrating ongoing innovation in the sector.
Challenges in the End User Computing Industry Market
The End User Computing industry faces challenges such as increasing cybersecurity threats, the complexity of integrating diverse systems, and the shortage of skilled IT professionals. These factors impact market growth by increasing operational costs and hindering efficient implementation of EUC solutions. Supply chain disruptions also present challenges by affecting the timely delivery of hardware and software. The overall impact is estimated to slow down the market growth by approximately xx% in 2025.
Forces Driving End User Computing Industry Growth
Technological advancements such as cloud computing, AI, and automation are pivotal drivers of market growth. Increased digitalization across industries, coupled with the growing demand for seamless and secure access to data, fuels the demand for robust EUC solutions. Favorable government policies promoting digital transformation are also contributing to this growth.
Long-Term Growth Catalysts in the End User Computing Industry
Long-term growth will be propelled by continued innovation in areas like AI-driven automation, edge computing, and enhanced cybersecurity. Strategic partnerships, such as the IBM-VMware collaboration, and market expansion into emerging economies will further accelerate growth.
Emerging Opportunities in End User Computing Industry
The integration of Extended Reality (XR) technologies into EUC solutions presents a significant opportunity. The rising demand for secure access to enterprise applications from diverse devices and locations fuels opportunities in zero trust security. Growing adoption of hyperautomation and RPA across different industries expands the market for EUC solutions that integrate and manage these technologies.
Leading Players in the End User Computing Industry Sector
- Infosys Limited
- HCL Infosystems Limited
- Nucleus Software Exports Limited
- Hitachi Systems Micro Clinic
- Vmware Inc
- Fujitsu Ltd
- Genpact
- Nutanix Inc
- NetApp Inc
- IGEL Technology
- Mindtree Limited
- Tech Mahindra Limited
- Amazon Web Service
- Citrix Systems Inc
- Dell Technologies
Key Milestones in End User Computing Industry
- November 2023: Fujitsu Ltd. launched a new technology optimizing CPU/GPU resource allocation for AI and Deep Learning applications, addressing the global GPU shortage.
- August 2022: IBM and VMware partnered to deliver co-engineered hybrid cloud solutions for healthcare, financial services, and the public sector.
- February 2022: CRISIL and Apparity LLC partnered to offer comprehensive EUC and model-risk solutions for financial institutions.
Strategic Outlook for End User Computing Industry Market
The End User Computing market presents a significant growth opportunity, driven by the ongoing digital transformation and the increasing demand for secure, scalable, and user-friendly solutions. Strategic investments in R&D, strategic partnerships, and expansion into new markets will be crucial for success in this dynamic and competitive landscape. The focus on cloud-native solutions, AI-driven automation, and advanced security will determine future market leaders.
End User Computing Industry Segmentation
-
1. Type
-
1.1. Solution
- 1.1.1. Virtual Desktop Infrastructure
- 1.1.2. Device Management
- 1.1.3. Other So
- 1.2. Services
-
1.1. Solution
-
2. Organization Size
- 2.1. Large Enterprises
- 2.2. Small & Medium Enterprises
-
3. Deployment Mode
- 3.1. On Premise
- 3.2. Cloud
-
4. End user Industry
- 4.1. IT and Telecom
- 4.2. Banking, Financial Services, and Insurance
- 4.3. Healthcare
- 4.4. Retail
- 4.5. Other E
End User Computing Industry Segmentation By Geography
- 1. North America
- 2. Europe
- 3. Asia Pacific
- 4. Latin America
- 5. Middle East and Africa
End User Computing Industry REPORT HIGHLIGHTS
| Aspects | Details |
|---|---|
| Study Period | 2019-2033 |
| Base Year | 2024 |
| Estimated Year | 2025 |
| Forecast Period | 2025-2033 |
| Historical Period | 2019-2024 |
| Growth Rate | CAGR of > 10.05% from 2019-2033 |
| Segmentation |
|
Table of Contents
- 1. Introduction
- 1.1. Research Scope
- 1.2. Market Segmentation
- 1.3. Research Methodology
- 1.4. Definitions and Assumptions
- 2. Executive Summary
- 2.1. Introduction
- 3. Market Dynamics
- 3.1. Introduction
- 3.2. Market Drivers
- 3.2.1. Drive to Increase the Productivity of Employees with Technology; Increasing Use of Cloud
- 3.3. Market Restrains
- 3.3.1. Issues Associated with Transformation and Integration of Processes By Organizations
- 3.4. Market Trends
- 3.4.1. Increasing Use of Cloud is Expected to Drive the End User Computing Market Growth
- 4. Market Factor Analysis
- 4.1. Porters Five Forces
- 4.2. Supply/Value Chain
- 4.3. PESTEL analysis
- 4.4. Market Entropy
- 4.5. Patent/Trademark Analysis
- 5. Global End User Computing Industry Analysis, Insights and Forecast, 2019-2031
- 5.1. Market Analysis, Insights and Forecast - by Type
- 5.1.1. Solution
- 5.1.1.1. Virtual Desktop Infrastructure
- 5.1.1.2. Device Management
- 5.1.1.3. Other So
- 5.1.2. Services
- 5.1.1. Solution
- 5.2. Market Analysis, Insights and Forecast - by Organization Size
- 5.2.1. Large Enterprises
- 5.2.2. Small & Medium Enterprises
- 5.3. Market Analysis, Insights and Forecast - by Deployment Mode
- 5.3.1. On Premise
- 5.3.2. Cloud
- 5.4. Market Analysis, Insights and Forecast - by End user Industry
- 5.4.1. IT and Telecom
- 5.4.2. Banking, Financial Services, and Insurance
- 5.4.3. Healthcare
- 5.4.4. Retail
- 5.4.5. Other E
- 5.5. Market Analysis, Insights and Forecast - by Region
- 5.5.1. North America
- 5.5.2. Europe
- 5.5.3. Asia Pacific
- 5.5.4. Latin America
- 5.5.5. Middle East and Africa
- 5.1. Market Analysis, Insights and Forecast - by Type
- 6. North America End User Computing Industry Analysis, Insights and Forecast, 2019-2031
- 6.1. Market Analysis, Insights and Forecast - by Type
- 6.1.1. Solution
- 6.1.1.1. Virtual Desktop Infrastructure
- 6.1.1.2. Device Management
- 6.1.1.3. Other So
- 6.1.2. Services
- 6.1.1. Solution
- 6.2. Market Analysis, Insights and Forecast - by Organization Size
- 6.2.1. Large Enterprises
- 6.2.2. Small & Medium Enterprises
- 6.3. Market Analysis, Insights and Forecast - by Deployment Mode
- 6.3.1. On Premise
- 6.3.2. Cloud
- 6.4. Market Analysis, Insights and Forecast - by End user Industry
- 6.4.1. IT and Telecom
- 6.4.2. Banking, Financial Services, and Insurance
- 6.4.3. Healthcare
- 6.4.4. Retail
- 6.4.5. Other E
- 6.1. Market Analysis, Insights and Forecast - by Type
- 7. Europe End User Computing Industry Analysis, Insights and Forecast, 2019-2031
- 7.1. Market Analysis, Insights and Forecast - by Type
- 7.1.1. Solution
- 7.1.1.1. Virtual Desktop Infrastructure
- 7.1.1.2. Device Management
- 7.1.1.3. Other So
- 7.1.2. Services
- 7.1.1. Solution
- 7.2. Market Analysis, Insights and Forecast - by Organization Size
- 7.2.1. Large Enterprises
- 7.2.2. Small & Medium Enterprises
- 7.3. Market Analysis, Insights and Forecast - by Deployment Mode
- 7.3.1. On Premise
- 7.3.2. Cloud
- 7.4. Market Analysis, Insights and Forecast - by End user Industry
- 7.4.1. IT and Telecom
- 7.4.2. Banking, Financial Services, and Insurance
- 7.4.3. Healthcare
- 7.4.4. Retail
- 7.4.5. Other E
- 7.1. Market Analysis, Insights and Forecast - by Type
- 8. Asia Pacific End User Computing Industry Analysis, Insights and Forecast, 2019-2031
- 8.1. Market Analysis, Insights and Forecast - by Type
- 8.1.1. Solution
- 8.1.1.1. Virtual Desktop Infrastructure
- 8.1.1.2. Device Management
- 8.1.1.3. Other So
- 8.1.2. Services
- 8.1.1. Solution
- 8.2. Market Analysis, Insights and Forecast - by Organization Size
- 8.2.1. Large Enterprises
- 8.2.2. Small & Medium Enterprises
- 8.3. Market Analysis, Insights and Forecast - by Deployment Mode
- 8.3.1. On Premise
- 8.3.2. Cloud
- 8.4. Market Analysis, Insights and Forecast - by End user Industry
- 8.4.1. IT and Telecom
- 8.4.2. Banking, Financial Services, and Insurance
- 8.4.3. Healthcare
- 8.4.4. Retail
- 8.4.5. Other E
- 8.1. Market Analysis, Insights and Forecast - by Type
- 9. Latin America End User Computing Industry Analysis, Insights and Forecast, 2019-2031
- 9.1. Market Analysis, Insights and Forecast - by Type
- 9.1.1. Solution
- 9.1.1.1. Virtual Desktop Infrastructure
- 9.1.1.2. Device Management
- 9.1.1.3. Other So
- 9.1.2. Services
- 9.1.1. Solution
- 9.2. Market Analysis, Insights and Forecast - by Organization Size
- 9.2.1. Large Enterprises
- 9.2.2. Small & Medium Enterprises
- 9.3. Market Analysis, Insights and Forecast - by Deployment Mode
- 9.3.1. On Premise
- 9.3.2. Cloud
- 9.4. Market Analysis, Insights and Forecast - by End user Industry
- 9.4.1. IT and Telecom
- 9.4.2. Banking, Financial Services, and Insurance
- 9.4.3. Healthcare
- 9.4.4. Retail
- 9.4.5. Other E
- 9.1. Market Analysis, Insights and Forecast - by Type
- 10. Middle East and Africa End User Computing Industry Analysis, Insights and Forecast, 2019-2031
- 10.1. Market Analysis, Insights and Forecast - by Type
- 10.1.1. Solution
- 10.1.1.1. Virtual Desktop Infrastructure
- 10.1.1.2. Device Management
- 10.1.1.3. Other So
- 10.1.2. Services
- 10.1.1. Solution
- 10.2. Market Analysis, Insights and Forecast - by Organization Size
- 10.2.1. Large Enterprises
- 10.2.2. Small & Medium Enterprises
- 10.3. Market Analysis, Insights and Forecast - by Deployment Mode
- 10.3.1. On Premise
- 10.3.2. Cloud
- 10.4. Market Analysis, Insights and Forecast - by End user Industry
- 10.4.1. IT and Telecom
- 10.4.2. Banking, Financial Services, and Insurance
- 10.4.3. Healthcare
- 10.4.4. Retail
- 10.4.5. Other E
- 10.1. Market Analysis, Insights and Forecast - by Type
- 11. North America End User Computing Industry Analysis, Insights and Forecast, 2019-2031
- 11.1. Market Analysis, Insights and Forecast - By Country/Sub-region
- 11.1.1.
- 12. Europe End User Computing Industry Analysis, Insights and Forecast, 2019-2031
- 12.1. Market Analysis, Insights and Forecast - By Country/Sub-region
- 12.1.1.
- 13. Asia Pacific End User Computing Industry Analysis, Insights and Forecast, 2019-2031
- 13.1. Market Analysis, Insights and Forecast - By Country/Sub-region
- 13.1.1.
- 14. Latin America End User Computing Industry Analysis, Insights and Forecast, 2019-2031
- 14.1. Market Analysis, Insights and Forecast - By Country/Sub-region
- 14.1.1.
- 15. Middle East and Africa End User Computing Industry Analysis, Insights and Forecast, 2019-2031
- 15.1. Market Analysis, Insights and Forecast - By Country/Sub-region
- 15.1.1.
- 16. Competitive Analysis
- 16.1. Global Market Share Analysis 2024
- 16.2. Company Profiles
- 16.2.1 Infosys Limited
- 16.2.1.1. Overview
- 16.2.1.2. Products
- 16.2.1.3. SWOT Analysis
- 16.2.1.4. Recent Developments
- 16.2.1.5. Financials (Based on Availability)
- 16.2.2 HCL Infosystems Limited
- 16.2.2.1. Overview
- 16.2.2.2. Products
- 16.2.2.3. SWOT Analysis
- 16.2.2.4. Recent Developments
- 16.2.2.5. Financials (Based on Availability)
- 16.2.3 Nucleus Software Exports Limited
- 16.2.3.1. Overview
- 16.2.3.2. Products
- 16.2.3.3. SWOT Analysis
- 16.2.3.4. Recent Developments
- 16.2.3.5. Financials (Based on Availability)
- 16.2.4 Hitachi Systems Micro Clinic
- 16.2.4.1. Overview
- 16.2.4.2. Products
- 16.2.4.3. SWOT Analysis
- 16.2.4.4. Recent Developments
- 16.2.4.5. Financials (Based on Availability)
- 16.2.5 Vmware Inc
- 16.2.5.1. Overview
- 16.2.5.2. Products
- 16.2.5.3. SWOT Analysis
- 16.2.5.4. Recent Developments
- 16.2.5.5. Financials (Based on Availability)
- 16.2.6 Fujitsu Ltd
- 16.2.6.1. Overview
- 16.2.6.2. Products
- 16.2.6.3. SWOT Analysis
- 16.2.6.4. Recent Developments
- 16.2.6.5. Financials (Based on Availability)
- 16.2.7 Genpact
- 16.2.7.1. Overview
- 16.2.7.2. Products
- 16.2.7.3. SWOT Analysis
- 16.2.7.4. Recent Developments
- 16.2.7.5. Financials (Based on Availability)
- 16.2.8 Nutanix Inc
- 16.2.8.1. Overview
- 16.2.8.2. Products
- 16.2.8.3. SWOT Analysis
- 16.2.8.4. Recent Developments
- 16.2.8.5. Financials (Based on Availability)
- 16.2.9 NetApp Inc
- 16.2.9.1. Overview
- 16.2.9.2. Products
- 16.2.9.3. SWOT Analysis
- 16.2.9.4. Recent Developments
- 16.2.9.5. Financials (Based on Availability)
- 16.2.10 IGEL Technology
- 16.2.10.1. Overview
- 16.2.10.2. Products
- 16.2.10.3. SWOT Analysis
- 16.2.10.4. Recent Developments
- 16.2.10.5. Financials (Based on Availability)
- 16.2.11 Mindtree Limited
- 16.2.11.1. Overview
- 16.2.11.2. Products
- 16.2.11.3. SWOT Analysis
- 16.2.11.4. Recent Developments
- 16.2.11.5. Financials (Based on Availability)
- 16.2.12 Tech Mahindra Limited
- 16.2.12.1. Overview
- 16.2.12.2. Products
- 16.2.12.3. SWOT Analysis
- 16.2.12.4. Recent Developments
- 16.2.12.5. Financials (Based on Availability)
- 16.2.13 Amazon Web Service
- 16.2.13.1. Overview
- 16.2.13.2. Products
- 16.2.13.3. SWOT Analysis
- 16.2.13.4. Recent Developments
- 16.2.13.5. Financials (Based on Availability)
- 16.2.14 Citrix Systems Inc
- 16.2.14.1. Overview
- 16.2.14.2. Products
- 16.2.14.3. SWOT Analysis
- 16.2.14.4. Recent Developments
- 16.2.14.5. Financials (Based on Availability)
- 16.2.15 Dell Technologies
- 16.2.15.1. Overview
- 16.2.15.2. Products
- 16.2.15.3. SWOT Analysis
- 16.2.15.4. Recent Developments
- 16.2.15.5. Financials (Based on Availability)
- 16.2.1 Infosys Limited
List of Figures
- Figure 1: Global End User Computing Industry Revenue Breakdown (Million, %) by Region 2024 & 2032
- Figure 2: North America End User Computing Industry Revenue (Million), by Country 2024 & 2032
- Figure 3: North America End User Computing Industry Revenue Share (%), by Country 2024 & 2032
- Figure 4: Europe End User Computing Industry Revenue (Million), by Country 2024 & 2032
- Figure 5: Europe End User Computing Industry Revenue Share (%), by Country 2024 & 2032
- Figure 6: Asia Pacific End User Computing Industry Revenue (Million), by Country 2024 & 2032
- Figure 7: Asia Pacific End User Computing Industry Revenue Share (%), by Country 2024 & 2032
- Figure 8: Latin America End User Computing Industry Revenue (Million), by Country 2024 & 2032
- Figure 9: Latin America End User Computing Industry Revenue Share (%), by Country 2024 & 2032
- Figure 10: Middle East and Africa End User Computing Industry Revenue (Million), by Country 2024 & 2032
- Figure 11: Middle East and Africa End User Computing Industry Revenue Share (%), by Country 2024 & 2032
- Figure 12: North America End User Computing Industry Revenue (Million), by Type 2024 & 2032
- Figure 13: North America End User Computing Industry Revenue Share (%), by Type 2024 & 2032
- Figure 14: North America End User Computing Industry Revenue (Million), by Organization Size 2024 & 2032
- Figure 15: North America End User Computing Industry Revenue Share (%), by Organization Size 2024 & 2032
- Figure 16: North America End User Computing Industry Revenue (Million), by Deployment Mode 2024 & 2032
- Figure 17: North America End User Computing Industry Revenue Share (%), by Deployment Mode 2024 & 2032
- Figure 18: North America End User Computing Industry Revenue (Million), by End user Industry 2024 & 2032
- Figure 19: North America End User Computing Industry Revenue Share (%), by End user Industry 2024 & 2032
- Figure 20: North America End User Computing Industry Revenue (Million), by Country 2024 & 2032
- Figure 21: North America End User Computing Industry Revenue Share (%), by Country 2024 & 2032
- Figure 22: Europe End User Computing Industry Revenue (Million), by Type 2024 & 2032
- Figure 23: Europe End User Computing Industry Revenue Share (%), by Type 2024 & 2032
- Figure 24: Europe End User Computing Industry Revenue (Million), by Organization Size 2024 & 2032
- Figure 25: Europe End User Computing Industry Revenue Share (%), by Organization Size 2024 & 2032
- Figure 26: Europe End User Computing Industry Revenue (Million), by Deployment Mode 2024 & 2032
- Figure 27: Europe End User Computing Industry Revenue Share (%), by Deployment Mode 2024 & 2032
- Figure 28: Europe End User Computing Industry Revenue (Million), by End user Industry 2024 & 2032
- Figure 29: Europe End User Computing Industry Revenue Share (%), by End user Industry 2024 & 2032
- Figure 30: Europe End User Computing Industry Revenue (Million), by Country 2024 & 2032
- Figure 31: Europe End User Computing Industry Revenue Share (%), by Country 2024 & 2032
- Figure 32: Asia Pacific End User Computing Industry Revenue (Million), by Type 2024 & 2032
- Figure 33: Asia Pacific End User Computing Industry Revenue Share (%), by Type 2024 & 2032
- Figure 34: Asia Pacific End User Computing Industry Revenue (Million), by Organization Size 2024 & 2032
- Figure 35: Asia Pacific End User Computing Industry Revenue Share (%), by Organization Size 2024 & 2032
- Figure 36: Asia Pacific End User Computing Industry Revenue (Million), by Deployment Mode 2024 & 2032
- Figure 37: Asia Pacific End User Computing Industry Revenue Share (%), by Deployment Mode 2024 & 2032
- Figure 38: Asia Pacific End User Computing Industry Revenue (Million), by End user Industry 2024 & 2032
- Figure 39: Asia Pacific End User Computing Industry Revenue Share (%), by End user Industry 2024 & 2032
- Figure 40: Asia Pacific End User Computing Industry Revenue (Million), by Country 2024 & 2032
- Figure 41: Asia Pacific End User Computing Industry Revenue Share (%), by Country 2024 & 2032
- Figure 42: Latin America End User Computing Industry Revenue (Million), by Type 2024 & 2032
- Figure 43: Latin America End User Computing Industry Revenue Share (%), by Type 2024 & 2032
- Figure 44: Latin America End User Computing Industry Revenue (Million), by Organization Size 2024 & 2032
- Figure 45: Latin America End User Computing Industry Revenue Share (%), by Organization Size 2024 & 2032
- Figure 46: Latin America End User Computing Industry Revenue (Million), by Deployment Mode 2024 & 2032
- Figure 47: Latin America End User Computing Industry Revenue Share (%), by Deployment Mode 2024 & 2032
- Figure 48: Latin America End User Computing Industry Revenue (Million), by End user Industry 2024 & 2032
- Figure 49: Latin America End User Computing Industry Revenue Share (%), by End user Industry 2024 & 2032
- Figure 50: Latin America End User Computing Industry Revenue (Million), by Country 2024 & 2032
- Figure 51: Latin America End User Computing Industry Revenue Share (%), by Country 2024 & 2032
- Figure 52: Middle East and Africa End User Computing Industry Revenue (Million), by Type 2024 & 2032
- Figure 53: Middle East and Africa End User Computing Industry Revenue Share (%), by Type 2024 & 2032
- Figure 54: Middle East and Africa End User Computing Industry Revenue (Million), by Organization Size 2024 & 2032
- Figure 55: Middle East and Africa End User Computing Industry Revenue Share (%), by Organization Size 2024 & 2032
- Figure 56: Middle East and Africa End User Computing Industry Revenue (Million), by Deployment Mode 2024 & 2032
- Figure 57: Middle East and Africa End User Computing Industry Revenue Share (%), by Deployment Mode 2024 & 2032
- Figure 58: Middle East and Africa End User Computing Industry Revenue (Million), by End user Industry 2024 & 2032
- Figure 59: Middle East and Africa End User Computing Industry Revenue Share (%), by End user Industry 2024 & 2032
- Figure 60: Middle East and Africa End User Computing Industry Revenue (Million), by Country 2024 & 2032
- Figure 61: Middle East and Africa End User Computing Industry Revenue Share (%), by Country 2024 & 2032
List of Tables
- Table 1: Global End User Computing Industry Revenue Million Forecast, by Region 2019 & 2032
- Table 2: Global End User Computing Industry Revenue Million Forecast, by Type 2019 & 2032
- Table 3: Global End User Computing Industry Revenue Million Forecast, by Organization Size 2019 & 2032
- Table 4: Global End User Computing Industry Revenue Million Forecast, by Deployment Mode 2019 & 2032
- Table 5: Global End User Computing Industry Revenue Million Forecast, by End user Industry 2019 & 2032
- Table 6: Global End User Computing Industry Revenue Million Forecast, by Region 2019 & 2032
- Table 7: Global End User Computing Industry Revenue Million Forecast, by Country 2019 & 2032
- Table 8: End User Computing Industry Revenue (Million) Forecast, by Application 2019 & 2032
- Table 9: Global End User Computing Industry Revenue Million Forecast, by Country 2019 & 2032
- Table 10: End User Computing Industry Revenue (Million) Forecast, by Application 2019 & 2032
- Table 11: Global End User Computing Industry Revenue Million Forecast, by Country 2019 & 2032
- Table 12: End User Computing Industry Revenue (Million) Forecast, by Application 2019 & 2032
- Table 13: Global End User Computing Industry Revenue Million Forecast, by Country 2019 & 2032
- Table 14: End User Computing Industry Revenue (Million) Forecast, by Application 2019 & 2032
- Table 15: Global End User Computing Industry Revenue Million Forecast, by Country 2019 & 2032
- Table 16: End User Computing Industry Revenue (Million) Forecast, by Application 2019 & 2032
- Table 17: Global End User Computing Industry Revenue Million Forecast, by Type 2019 & 2032
- Table 18: Global End User Computing Industry Revenue Million Forecast, by Organization Size 2019 & 2032
- Table 19: Global End User Computing Industry Revenue Million Forecast, by Deployment Mode 2019 & 2032
- Table 20: Global End User Computing Industry Revenue Million Forecast, by End user Industry 2019 & 2032
- Table 21: Global End User Computing Industry Revenue Million Forecast, by Country 2019 & 2032
- Table 22: Global End User Computing Industry Revenue Million Forecast, by Type 2019 & 2032
- Table 23: Global End User Computing Industry Revenue Million Forecast, by Organization Size 2019 & 2032
- Table 24: Global End User Computing Industry Revenue Million Forecast, by Deployment Mode 2019 & 2032
- Table 25: Global End User Computing Industry Revenue Million Forecast, by End user Industry 2019 & 2032
- Table 26: Global End User Computing Industry Revenue Million Forecast, by Country 2019 & 2032
- Table 27: Global End User Computing Industry Revenue Million Forecast, by Type 2019 & 2032
- Table 28: Global End User Computing Industry Revenue Million Forecast, by Organization Size 2019 & 2032
- Table 29: Global End User Computing Industry Revenue Million Forecast, by Deployment Mode 2019 & 2032
- Table 30: Global End User Computing Industry Revenue Million Forecast, by End user Industry 2019 & 2032
- Table 31: Global End User Computing Industry Revenue Million Forecast, by Country 2019 & 2032
- Table 32: Global End User Computing Industry Revenue Million Forecast, by Type 2019 & 2032
- Table 33: Global End User Computing Industry Revenue Million Forecast, by Organization Size 2019 & 2032
- Table 34: Global End User Computing Industry Revenue Million Forecast, by Deployment Mode 2019 & 2032
- Table 35: Global End User Computing Industry Revenue Million Forecast, by End user Industry 2019 & 2032
- Table 36: Global End User Computing Industry Revenue Million Forecast, by Country 2019 & 2032
- Table 37: Global End User Computing Industry Revenue Million Forecast, by Type 2019 & 2032
- Table 38: Global End User Computing Industry Revenue Million Forecast, by Organization Size 2019 & 2032
- Table 39: Global End User Computing Industry Revenue Million Forecast, by Deployment Mode 2019 & 2032
- Table 40: Global End User Computing Industry Revenue Million Forecast, by End user Industry 2019 & 2032
- Table 41: Global End User Computing Industry Revenue Million Forecast, by Country 2019 & 2032
Frequently Asked Questions
1. What is the projected Compound Annual Growth Rate (CAGR) of the End User Computing Industry?
The projected CAGR is approximately > 10.05%.
2. Which companies are prominent players in the End User Computing Industry?
Key companies in the market include Infosys Limited, HCL Infosystems Limited, Nucleus Software Exports Limited, Hitachi Systems Micro Clinic, Vmware Inc, Fujitsu Ltd, Genpact, Nutanix Inc, NetApp Inc, IGEL Technology, Mindtree Limited, Tech Mahindra Limited, Amazon Web Service, Citrix Systems Inc, Dell Technologies.
3. What are the main segments of the End User Computing Industry?
The market segments include Type, Organization Size, Deployment Mode, End user Industry.
4. Can you provide details about the market size?
The market size is estimated to be USD 11.97 Million as of 2022.
5. What are some drivers contributing to market growth?
Drive to Increase the Productivity of Employees with Technology; Increasing Use of Cloud.
6. What are the notable trends driving market growth?
Increasing Use of Cloud is Expected to Drive the End User Computing Market Growth.
7. Are there any restraints impacting market growth?
Issues Associated with Transformation and Integration of Processes By Organizations.
8. Can you provide examples of recent developments in the market?
November 2023 - Fujitsu Ltd Technology for the optimization of the use of CPUs and GPUs by allocating resources on a real-time basis to prioritize processes with high performance prioritise processes with high performance, even when running programs using GPUs. For the worldwide shortage of GPUs, which has been triggered by a growing demand for intelligent Artificial Intelligence, Deep Learning, and more applications, Fujitsu developed a new technology that optimizes user computing resources.
9. What pricing options are available for accessing the report?
Pricing options include single-user, multi-user, and enterprise licenses priced at USD 4750, USD 5250, and USD 8750 respectively.
10. Is the market size provided in terms of value or volume?
The market size is provided in terms of value, measured in Million.
11. Are there any specific market keywords associated with the report?
Yes, the market keyword associated with the report is "End User Computing Industry," which aids in identifying and referencing the specific market segment covered.
12. How do I determine which pricing option suits my needs best?
The pricing options vary based on user requirements and access needs. Individual users may opt for single-user licenses, while businesses requiring broader access may choose multi-user or enterprise licenses for cost-effective access to the report.
13. Are there any additional resources or data provided in the End User Computing Industry report?
While the report offers comprehensive insights, it's advisable to review the specific contents or supplementary materials provided to ascertain if additional resources or data are available.
14. How can I stay updated on further developments or reports in the End User Computing Industry?
To stay informed about further developments, trends, and reports in the End User Computing Industry, consider subscribing to industry newsletters, following relevant companies and organizations, or regularly checking reputable industry news sources and publications.
Methodology
Step 1 - Identification of Relevant Samples Size from Population Database


Step 2 - Approaches for Defining Global Market Size (Value, Volume* & Price*)

Note*: In applicable scenarios
Step 3 - Data Sources
Primary Research
- Web Analytics
- Survey Reports
- Research Institute
- Latest Research Reports
- Opinion Leaders
Secondary Research
- Annual Reports
- White Paper
- Latest Press Release
- Industry Association
- Paid Database
- Investor Presentations

Step 4 - Data Triangulation
Involves using different sources of information in order to increase the validity of a study
These sources are likely to be stakeholders in a program - participants, other researchers, program staff, other community members, and so on.
Then we put all data in single framework & apply various statistical tools to find out the dynamic on the market.
During the analysis stage, feedback from the stakeholder groups would be compared to determine areas of agreement as well as areas of divergence
