

Key Insights
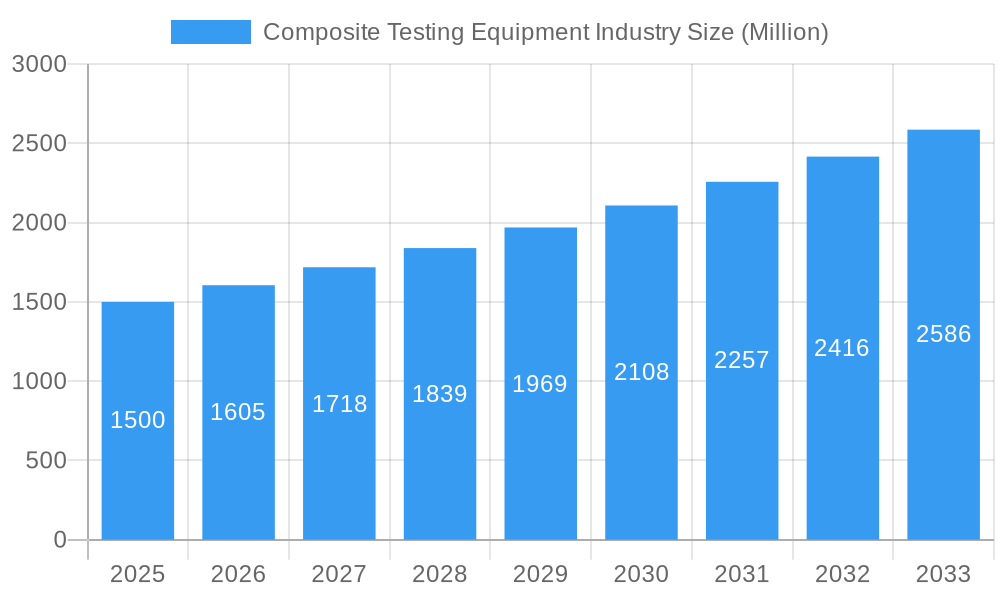
The global composite testing equipment market is projected for substantial growth, driven by increasing composite material adoption across key industries. Expect a compound annual growth rate (CAGR) of 7.16% from a market size of $2.58 billion in the base year 2025. This expansion is primarily fueled by the demand for high-strength, lightweight materials in aerospace & defense, automotive, and building & construction sectors. Key drivers include the automotive industry's pursuit of fuel efficiency and aerospace's focus on lighter aircraft designs. Advances in composite materials, enabling more complex structures, necessitate sophisticated testing solutions, further propelling market growth. The market is segmented by product type (ceramic, continuous fiber, discontinuous fiber, polymer matrix composites, etc.), testing method (destructive, non-destructive), and application (aerospace, automotive, building & construction, electricals & electronics, etc.). Destructive testing methods and aerospace applications are expected to maintain dominant positions. The competitive landscape features established players like Henkel AG & Co KGaA, Intertek Group PLC, and Element Materials Technology, alongside specialized testing laboratories, all focused on innovation for enhanced accuracy and efficiency in testing capabilities.
Composite Testing Equipment Industry Market Size (In Billion)
While market expansion is evident, challenges such as high initial investment costs for advanced equipment and the requirement for skilled personnel may present restraints. Nevertheless, ongoing technological advancements in testing methodologies and increased accessibility to sophisticated equipment are expected to mitigate these concerns. Regional growth will vary, with North America and Europe holding significant market shares due to established industries and strong R&D. However, the Asia-Pacific region is anticipated to experience the fastest growth, driven by rapid industrialization and infrastructure development. Future market expansion will be contingent on continued innovation in composite materials, the adoption of advanced manufacturing techniques, and the growing demand for reliable quality control in composite manufacturing.
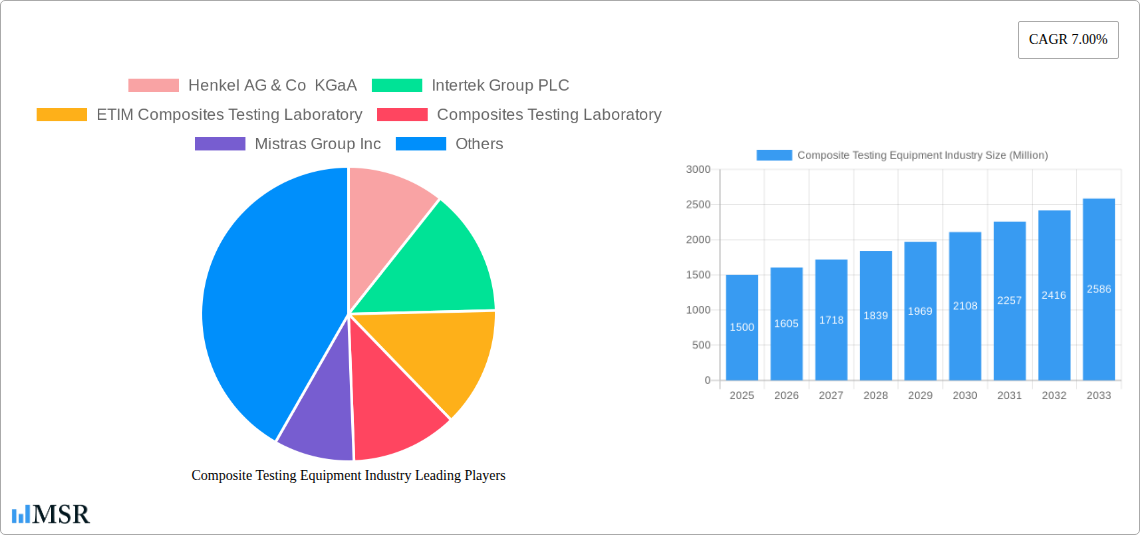
Composite Testing Equipment Industry Company Market Share
Composite Testing Equipment Industry Market Report: 2019-2033
This comprehensive report provides a detailed analysis of the global Composite Testing Equipment industry, offering invaluable insights for stakeholders, investors, and industry professionals. With a study period spanning 2019-2033, a base year of 2025, and a forecast period of 2025-2033, this report presents a robust understanding of current market dynamics and future growth trajectories. The market size in 2025 is estimated at $XX Million, with a projected Compound Annual Growth Rate (CAGR) of XX% during the forecast period.
Composite Testing Equipment Industry Market Concentration & Dynamics
The global composite testing equipment market exhibits a moderately concentrated landscape, with key players like Henkel AG & Co KGaA, Intertek Group PLC, Element Materials Technology, Instron Corporation (Illinois Tool Works Inc), and Mistras Group Inc holding significant market share. The market share of the top 5 players is estimated at XX%. Innovation within the industry is driven by advancements in materials science and testing methodologies, particularly in non-destructive testing techniques. Stringent regulatory frameworks, especially within aerospace and automotive sectors, influence the adoption of advanced testing equipment. Substitute products, such as alternative material characterization methods, present competitive pressures. End-user trends show increasing demand for lightweight, high-strength composites across various applications. M&A activity in the sector has been moderate, with approximately XX deals recorded between 2019 and 2024.
- Market Concentration: Moderately concentrated, with top 5 players holding XX% market share.
- Innovation: Driven by advancements in materials science and non-destructive testing.
- Regulatory Framework: Stringent regulations in aerospace and automotive drive adoption of advanced equipment.
- Substitute Products: Alternative material characterization methods pose competitive pressure.
- End-User Trends: Growing demand for lightweight, high-strength composites.
- M&A Activity: Approximately XX deals between 2019 and 2024.
Composite Testing Equipment Industry Industry Insights & Trends
The global composite testing equipment market is experiencing robust growth, fueled by the rising adoption of composite materials across diverse sectors. The market's expansion is primarily driven by the increasing demand for lightweight yet high-strength materials in aerospace and automotive industries, coupled with the burgeoning construction and renewable energy sectors. Technological disruptions, particularly the integration of AI and automation in testing processes, are enhancing efficiency and accuracy. Consumer behavior is increasingly emphasizing sustainability and durability, leading to greater demand for reliable composite material testing to ensure product quality and longevity. The market size is estimated at $XX Million in 2025, projected to reach $XX Million by 2033.
Key Markets & Segments Leading Composite Testing Equipment Industry
The aerospace and defense sector dominates the composite testing equipment market, driven by stringent quality and safety requirements. The Polymer Matrix Composites segment holds the largest market share by product type, followed by Continuous Fiber Composites. Destructive testing methods remain prevalent, albeit with a growing adoption of non-destructive techniques for cost-effectiveness and efficiency. Geographically, North America and Europe are currently the leading regions, fueled by robust aerospace and automotive industries.
- Dominant Region: North America and Europe
- Dominant Segment (Product Type): Polymer Matrix Composites
- Dominant Segment (Testing Method): Destructive Testing
- Dominant Segment (Application): Aerospace and Defense
Drivers:
- Aerospace & Defense: Stringent quality & safety requirements.
- Automotive: Lightweighting initiatives & fuel efficiency targets.
- Building & Construction: Growing adoption of composite materials in infrastructure projects.
- Electricals & Electronics: Demand for high-performance, lightweight components.
- Economic Growth: Increased investments in infrastructure and manufacturing.
Composite Testing Equipment Industry Product Developments
Recent product developments focus on enhancing testing accuracy, speed, and automation. Innovations include advanced non-destructive testing techniques like ultrasonic testing and thermal imaging, combined with sophisticated data analysis software. These advancements provide enhanced material characterization, improved process control, and reduced testing time, offering significant competitive advantages to manufacturers.
Challenges in the Composite Testing Equipment Industry Market
The composite testing equipment market faces challenges including high initial investment costs for advanced equipment, the complexity of testing certain composite materials, and the need for skilled personnel to operate and interpret test results. Supply chain disruptions can also impact availability and pricing of components. Intense competition among established players and new entrants further complicates the market dynamics. These factors can collectively impact market growth by approximately XX%.
Forces Driving Composite Testing Equipment Industry Growth
Key growth drivers include increasing demand for lightweight materials in various industries, technological advancements in testing methodologies, and stringent regulatory requirements. Government initiatives promoting the adoption of composite materials in infrastructure projects, coupled with growing investments in research and development, further accelerate market growth. The rising focus on sustainability and the need for reliable quality control measures also contribute significantly.
Challenges in the Composite Testing Equipment Industry Market
Long-term growth will be driven by continued innovation in testing technologies, strategic partnerships between equipment manufacturers and material suppliers, and expansion into emerging markets like Asia-Pacific. The development of standardized testing protocols and increased investment in training and education to address the skill gap will be crucial for sustained market expansion.
Emerging Opportunities in Composite Testing Equipment Industry
Emerging opportunities lie in the development of advanced non-destructive testing techniques, integration of AI and machine learning for data analysis, and the growth of the renewable energy sector. Expansion into emerging markets with growing infrastructure development and the increasing adoption of composites in various applications present significant growth potential. The focus on environmentally friendly materials and testing methods also creates new market niches.
Leading Players in the Composite Testing Equipment Industry Sector
- Henkel AG & Co KGaA
- Intertek Group PLC
- ETIM Composites Testing Laboratory
- Composites Testing Laboratory
- Mistras Group Inc
- Westmoreland Mechanical Testing & Research Inc
- Element Materials Technology
- Matrix Composites Inc (ITT Inc)
- Instron Corporation (Illinois Tool Works Inc)
Key Milestones in Composite Testing Equipment Industry Industry
- 2020: Introduction of automated ultrasonic testing systems by a major player.
- 2022: Merger between two leading companies expands market reach.
- 2023: Launch of a new non-destructive testing technology reduces testing time by XX%.
- 2024: Significant increase in government funding for composite materials research.
Strategic Outlook for Composite Testing Equipment Industry Market
The composite testing equipment market presents significant growth potential, driven by technological advancements and increasing demand across multiple sectors. Strategic opportunities include focusing on developing innovative testing solutions, expanding into emerging markets, and forming strategic alliances with material suppliers and end-users. Investing in research and development to improve testing accuracy and efficiency will be crucial for maintaining a competitive edge in this dynamic market.
Composite Testing Equipment Industry Segmentation
-
1. Product Type
- 1.1. Ceramic Matrix Composites
- 1.2. Continuous Fiber Composites
- 1.3. Discontinuous Fiber Composites
- 1.4. Polymer Matrix Composites
- 1.5. Other Composites
-
2. Testing Method
- 2.1. Destructive
- 2.2. Non-destructive
-
3. Application
- 3.1. Aerospace and Defense
- 3.2. Automotive
- 3.3. Building & Construction
- 3.4. Electricals & Electronics
- 3.5. Others (Sporting Goods, Wind Energy, etc. )
Composite Testing Equipment Industry Segmentation By Geography
- 1. North America
- 2. Europe
- 3. Asia Pacific
- 4. Latin America
- 5. Middle East
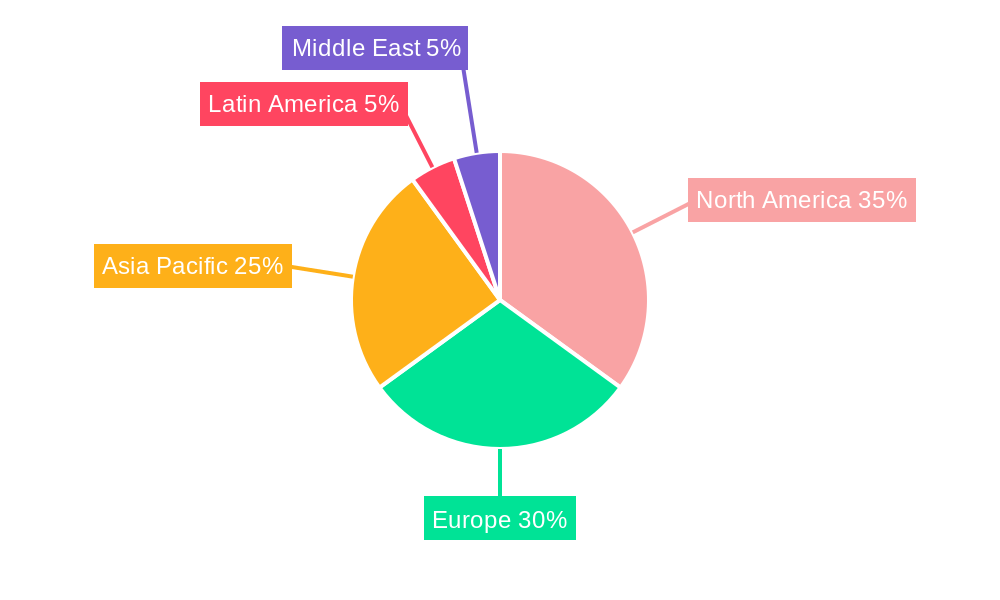
Composite Testing Equipment Industry Regional Market Share
Geographic Coverage of Composite Testing Equipment Industry
Composite Testing Equipment Industry REPORT HIGHLIGHTS
| Aspects | Details |
|---|---|
| Study Period | 2020-2034 |
| Base Year | 2025 |
| Estimated Year | 2026 |
| Forecast Period | 2026-2034 |
| Historical Period | 2020-2025 |
| Growth Rate | CAGR of 7.16% from 2020-2034 |
| Segmentation |
|
Table of Contents
- 1. Introduction
- 1.1. Research Scope
- 1.2. Market Segmentation
- 1.3. Research Objective
- 1.4. Definitions and Assumptions
- 2. Executive Summary
- 2.1. Market Snapshot
- 3. Market Dynamics
- 3.1. Market Drivers
- 3.2. Market Restrains
- 3.3. Market Trends
- 3.4. Market Opportunities
- 4. Market Factor Analysis
- 4.1. Porters Five Forces
- 4.1.1. Bargaining Power of Suppliers
- 4.1.2. Bargaining Power of Buyers
- 4.1.3. Threat of New Entrants
- 4.1.4. Threat of Substitutes
- 4.1.5. Competitive Rivalry
- 4.2. PESTEL analysis
- 4.3. BCG Analysis
- 4.3.1. Stars (High Growth, High Market Share)
- 4.3.2. Cash Cows (Low Growth, High Market Share)
- 4.3.3. Question Mark (High Growth, Low Market Share)
- 4.3.4. Dogs (Low Growth, Low Market Share)
- 4.4. Ansoff Matrix Analysis
- 4.5. Supply Chain Analysis
- 4.6. Regulatory Landscape
- 4.7. Current Market Potential and Opportunity Assessment (TAM–SAM–SOM Framework)
- 4.8. MSR Analyst Note
- 4.1. Porters Five Forces
- 5. Market Analysis, Insights and Forecast 2021-2033
- 5.1. Market Analysis, Insights and Forecast - by Product Type
- 5.1.1. Ceramic Matrix Composites
- 5.1.2. Continuous Fiber Composites
- 5.1.3. Discontinuous Fiber Composites
- 5.1.4. Polymer Matrix Composites
- 5.1.5. Other Composites
- 5.2. Market Analysis, Insights and Forecast - by Testing Method
- 5.2.1. Destructive
- 5.2.2. Non-destructive
- 5.3. Market Analysis, Insights and Forecast - by Application
- 5.3.1. Aerospace and Defense
- 5.3.2. Automotive
- 5.3.3. Building & Construction
- 5.3.4. Electricals & Electronics
- 5.3.5. Others (Sporting Goods, Wind Energy, etc. )
- 5.4. Market Analysis, Insights and Forecast - by Region
- 5.4.1. North America
- 5.4.2. Europe
- 5.4.3. Asia Pacific
- 5.4.4. Latin America
- 5.4.5. Middle East
- 5.1. Market Analysis, Insights and Forecast - by Product Type
- 6. Global Composite Testing Equipment Industry Analysis, Insights and Forecast, 2021-2033
- 6.1. Market Analysis, Insights and Forecast - by Product Type
- 6.1.1. Ceramic Matrix Composites
- 6.1.2. Continuous Fiber Composites
- 6.1.3. Discontinuous Fiber Composites
- 6.1.4. Polymer Matrix Composites
- 6.1.5. Other Composites
- 6.2. Market Analysis, Insights and Forecast - by Testing Method
- 6.2.1. Destructive
- 6.2.2. Non-destructive
- 6.3. Market Analysis, Insights and Forecast - by Application
- 6.3.1. Aerospace and Defense
- 6.3.2. Automotive
- 6.3.3. Building & Construction
- 6.3.4. Electricals & Electronics
- 6.3.5. Others (Sporting Goods, Wind Energy, etc. )
- 6.1. Market Analysis, Insights and Forecast - by Product Type
- 7. North America Composite Testing Equipment Industry Analysis, Insights and Forecast, 2020-2032
- 7.1. Market Analysis, Insights and Forecast - by Product Type
- 7.1.1. Ceramic Matrix Composites
- 7.1.2. Continuous Fiber Composites
- 7.1.3. Discontinuous Fiber Composites
- 7.1.4. Polymer Matrix Composites
- 7.1.5. Other Composites
- 7.2. Market Analysis, Insights and Forecast - by Testing Method
- 7.2.1. Destructive
- 7.2.2. Non-destructive
- 7.3. Market Analysis, Insights and Forecast - by Application
- 7.3.1. Aerospace and Defense
- 7.3.2. Automotive
- 7.3.3. Building & Construction
- 7.3.4. Electricals & Electronics
- 7.3.5. Others (Sporting Goods, Wind Energy, etc. )
- 7.1. Market Analysis, Insights and Forecast - by Product Type
- 8. Europe Composite Testing Equipment Industry Analysis, Insights and Forecast, 2020-2032
- 8.1. Market Analysis, Insights and Forecast - by Product Type
- 8.1.1. Ceramic Matrix Composites
- 8.1.2. Continuous Fiber Composites
- 8.1.3. Discontinuous Fiber Composites
- 8.1.4. Polymer Matrix Composites
- 8.1.5. Other Composites
- 8.2. Market Analysis, Insights and Forecast - by Testing Method
- 8.2.1. Destructive
- 8.2.2. Non-destructive
- 8.3. Market Analysis, Insights and Forecast - by Application
- 8.3.1. Aerospace and Defense
- 8.3.2. Automotive
- 8.3.3. Building & Construction
- 8.3.4. Electricals & Electronics
- 8.3.5. Others (Sporting Goods, Wind Energy, etc. )
- 8.1. Market Analysis, Insights and Forecast - by Product Type
- 9. Asia Pacific Composite Testing Equipment Industry Analysis, Insights and Forecast, 2020-2032
- 9.1. Market Analysis, Insights and Forecast - by Product Type
- 9.1.1. Ceramic Matrix Composites
- 9.1.2. Continuous Fiber Composites
- 9.1.3. Discontinuous Fiber Composites
- 9.1.4. Polymer Matrix Composites
- 9.1.5. Other Composites
- 9.2. Market Analysis, Insights and Forecast - by Testing Method
- 9.2.1. Destructive
- 9.2.2. Non-destructive
- 9.3. Market Analysis, Insights and Forecast - by Application
- 9.3.1. Aerospace and Defense
- 9.3.2. Automotive
- 9.3.3. Building & Construction
- 9.3.4. Electricals & Electronics
- 9.3.5. Others (Sporting Goods, Wind Energy, etc. )
- 9.1. Market Analysis, Insights and Forecast - by Product Type
- 10. Latin America Composite Testing Equipment Industry Analysis, Insights and Forecast, 2020-2032
- 10.1. Market Analysis, Insights and Forecast - by Product Type
- 10.1.1. Ceramic Matrix Composites
- 10.1.2. Continuous Fiber Composites
- 10.1.3. Discontinuous Fiber Composites
- 10.1.4. Polymer Matrix Composites
- 10.1.5. Other Composites
- 10.2. Market Analysis, Insights and Forecast - by Testing Method
- 10.2.1. Destructive
- 10.2.2. Non-destructive
- 10.3. Market Analysis, Insights and Forecast - by Application
- 10.3.1. Aerospace and Defense
- 10.3.2. Automotive
- 10.3.3. Building & Construction
- 10.3.4. Electricals & Electronics
- 10.3.5. Others (Sporting Goods, Wind Energy, etc. )
- 10.1. Market Analysis, Insights and Forecast - by Product Type
- 11. Middle East Composite Testing Equipment Industry Analysis, Insights and Forecast, 2020-2032
- 11.1. Market Analysis, Insights and Forecast - by Product Type
- 11.1.1. Ceramic Matrix Composites
- 11.1.2. Continuous Fiber Composites
- 11.1.3. Discontinuous Fiber Composites
- 11.1.4. Polymer Matrix Composites
- 11.1.5. Other Composites
- 11.2. Market Analysis, Insights and Forecast - by Testing Method
- 11.2.1. Destructive
- 11.2.2. Non-destructive
- 11.3. Market Analysis, Insights and Forecast - by Application
- 11.3.1. Aerospace and Defense
- 11.3.2. Automotive
- 11.3.3. Building & Construction
- 11.3.4. Electricals & Electronics
- 11.3.5. Others (Sporting Goods, Wind Energy, etc. )
- 11.1. Market Analysis, Insights and Forecast - by Product Type
- 12. Competitive Analysis
- 12.1. Company Profiles
- 12.1.1 Henkel AG & Co KGaA
- 12.1.1.1. Company Overview
- 12.1.1.2. Products
- 12.1.1.3. Company Financials
- 12.1.1.4. SWOT Analysis
- 12.1.2 Intertek Group PLC
- 12.1.2.1. Company Overview
- 12.1.2.2. Products
- 12.1.2.3. Company Financials
- 12.1.2.4. SWOT Analysis
- 12.1.3 ETIM Composites Testing Laboratory
- 12.1.3.1. Company Overview
- 12.1.3.2. Products
- 12.1.3.3. Company Financials
- 12.1.3.4. SWOT Analysis
- 12.1.4 Composites Testing Laboratory
- 12.1.4.1. Company Overview
- 12.1.4.2. Products
- 12.1.4.3. Company Financials
- 12.1.4.4. SWOT Analysis
- 12.1.5 Mistras Group Inc
- 12.1.5.1. Company Overview
- 12.1.5.2. Products
- 12.1.5.3. Company Financials
- 12.1.5.4. SWOT Analysis
- 12.1.6 Westmoreland Mechanical Testing & Research Inc
- 12.1.6.1. Company Overview
- 12.1.6.2. Products
- 12.1.6.3. Company Financials
- 12.1.6.4. SWOT Analysis
- 12.1.7 Element Materials Technology
- 12.1.7.1. Company Overview
- 12.1.7.2. Products
- 12.1.7.3. Company Financials
- 12.1.7.4. SWOT Analysis
- 12.1.8 Matrix Composites Inc (ITT Inc )
- 12.1.8.1. Company Overview
- 12.1.8.2. Products
- 12.1.8.3. Company Financials
- 12.1.8.4. SWOT Analysis
- 12.1.9 Instron Corporation (Illinois Tool Works Inc )
- 12.1.9.1. Company Overview
- 12.1.9.2. Products
- 12.1.9.3. Company Financials
- 12.1.9.4. SWOT Analysis
- 12.1.1 Henkel AG & Co KGaA
- 12.2. Market Entropy
- 12.2.1 Company's Key Areas Served
- 12.2.2 Recent Developments
- 12.3. Company Market Share Analysis 2025
- 12.3.1 Top 5 Companies Market Share Analysis
- 12.3.2 Top 3 Companies Market Share Analysis
- 12.4. List of Potential Customers
- 13. Research Methodology
List of Figures
- Figure 1: Global Composite Testing Equipment Industry Revenue Breakdown (billion, %) by Region 2025 & 2033
- Figure 2: Global Composite Testing Equipment Industry Volume Breakdown (K Unit, %) by Region 2025 & 2033
- Figure 3: North America Composite Testing Equipment Industry Revenue (billion), by Product Type 2025 & 2033
- Figure 4: North America Composite Testing Equipment Industry Volume (K Unit), by Product Type 2025 & 2033
- Figure 5: North America Composite Testing Equipment Industry Revenue Share (%), by Product Type 2025 & 2033
- Figure 6: North America Composite Testing Equipment Industry Volume Share (%), by Product Type 2025 & 2033
- Figure 7: North America Composite Testing Equipment Industry Revenue (billion), by Testing Method 2025 & 2033
- Figure 8: North America Composite Testing Equipment Industry Volume (K Unit), by Testing Method 2025 & 2033
- Figure 9: North America Composite Testing Equipment Industry Revenue Share (%), by Testing Method 2025 & 2033
- Figure 10: North America Composite Testing Equipment Industry Volume Share (%), by Testing Method 2025 & 2033
- Figure 11: North America Composite Testing Equipment Industry Revenue (billion), by Application 2025 & 2033
- Figure 12: North America Composite Testing Equipment Industry Volume (K Unit), by Application 2025 & 2033
- Figure 13: North America Composite Testing Equipment Industry Revenue Share (%), by Application 2025 & 2033
- Figure 14: North America Composite Testing Equipment Industry Volume Share (%), by Application 2025 & 2033
- Figure 15: North America Composite Testing Equipment Industry Revenue (billion), by Country 2025 & 2033
- Figure 16: North America Composite Testing Equipment Industry Volume (K Unit), by Country 2025 & 2033
- Figure 17: North America Composite Testing Equipment Industry Revenue Share (%), by Country 2025 & 2033
- Figure 18: North America Composite Testing Equipment Industry Volume Share (%), by Country 2025 & 2033
- Figure 19: Europe Composite Testing Equipment Industry Revenue (billion), by Product Type 2025 & 2033
- Figure 20: Europe Composite Testing Equipment Industry Volume (K Unit), by Product Type 2025 & 2033
- Figure 21: Europe Composite Testing Equipment Industry Revenue Share (%), by Product Type 2025 & 2033
- Figure 22: Europe Composite Testing Equipment Industry Volume Share (%), by Product Type 2025 & 2033
- Figure 23: Europe Composite Testing Equipment Industry Revenue (billion), by Testing Method 2025 & 2033
- Figure 24: Europe Composite Testing Equipment Industry Volume (K Unit), by Testing Method 2025 & 2033
- Figure 25: Europe Composite Testing Equipment Industry Revenue Share (%), by Testing Method 2025 & 2033
- Figure 26: Europe Composite Testing Equipment Industry Volume Share (%), by Testing Method 2025 & 2033
- Figure 27: Europe Composite Testing Equipment Industry Revenue (billion), by Application 2025 & 2033
- Figure 28: Europe Composite Testing Equipment Industry Volume (K Unit), by Application 2025 & 2033
- Figure 29: Europe Composite Testing Equipment Industry Revenue Share (%), by Application 2025 & 2033
- Figure 30: Europe Composite Testing Equipment Industry Volume Share (%), by Application 2025 & 2033
- Figure 31: Europe Composite Testing Equipment Industry Revenue (billion), by Country 2025 & 2033
- Figure 32: Europe Composite Testing Equipment Industry Volume (K Unit), by Country 2025 & 2033
- Figure 33: Europe Composite Testing Equipment Industry Revenue Share (%), by Country 2025 & 2033
- Figure 34: Europe Composite Testing Equipment Industry Volume Share (%), by Country 2025 & 2033
- Figure 35: Asia Pacific Composite Testing Equipment Industry Revenue (billion), by Product Type 2025 & 2033
- Figure 36: Asia Pacific Composite Testing Equipment Industry Volume (K Unit), by Product Type 2025 & 2033
- Figure 37: Asia Pacific Composite Testing Equipment Industry Revenue Share (%), by Product Type 2025 & 2033
- Figure 38: Asia Pacific Composite Testing Equipment Industry Volume Share (%), by Product Type 2025 & 2033
- Figure 39: Asia Pacific Composite Testing Equipment Industry Revenue (billion), by Testing Method 2025 & 2033
- Figure 40: Asia Pacific Composite Testing Equipment Industry Volume (K Unit), by Testing Method 2025 & 2033
- Figure 41: Asia Pacific Composite Testing Equipment Industry Revenue Share (%), by Testing Method 2025 & 2033
- Figure 42: Asia Pacific Composite Testing Equipment Industry Volume Share (%), by Testing Method 2025 & 2033
- Figure 43: Asia Pacific Composite Testing Equipment Industry Revenue (billion), by Application 2025 & 2033
- Figure 44: Asia Pacific Composite Testing Equipment Industry Volume (K Unit), by Application 2025 & 2033
- Figure 45: Asia Pacific Composite Testing Equipment Industry Revenue Share (%), by Application 2025 & 2033
- Figure 46: Asia Pacific Composite Testing Equipment Industry Volume Share (%), by Application 2025 & 2033
- Figure 47: Asia Pacific Composite Testing Equipment Industry Revenue (billion), by Country 2025 & 2033
- Figure 48: Asia Pacific Composite Testing Equipment Industry Volume (K Unit), by Country 2025 & 2033
- Figure 49: Asia Pacific Composite Testing Equipment Industry Revenue Share (%), by Country 2025 & 2033
- Figure 50: Asia Pacific Composite Testing Equipment Industry Volume Share (%), by Country 2025 & 2033
- Figure 51: Latin America Composite Testing Equipment Industry Revenue (billion), by Product Type 2025 & 2033
- Figure 52: Latin America Composite Testing Equipment Industry Volume (K Unit), by Product Type 2025 & 2033
- Figure 53: Latin America Composite Testing Equipment Industry Revenue Share (%), by Product Type 2025 & 2033
- Figure 54: Latin America Composite Testing Equipment Industry Volume Share (%), by Product Type 2025 & 2033
- Figure 55: Latin America Composite Testing Equipment Industry Revenue (billion), by Testing Method 2025 & 2033
- Figure 56: Latin America Composite Testing Equipment Industry Volume (K Unit), by Testing Method 2025 & 2033
- Figure 57: Latin America Composite Testing Equipment Industry Revenue Share (%), by Testing Method 2025 & 2033
- Figure 58: Latin America Composite Testing Equipment Industry Volume Share (%), by Testing Method 2025 & 2033
- Figure 59: Latin America Composite Testing Equipment Industry Revenue (billion), by Application 2025 & 2033
- Figure 60: Latin America Composite Testing Equipment Industry Volume (K Unit), by Application 2025 & 2033
- Figure 61: Latin America Composite Testing Equipment Industry Revenue Share (%), by Application 2025 & 2033
- Figure 62: Latin America Composite Testing Equipment Industry Volume Share (%), by Application 2025 & 2033
- Figure 63: Latin America Composite Testing Equipment Industry Revenue (billion), by Country 2025 & 2033
- Figure 64: Latin America Composite Testing Equipment Industry Volume (K Unit), by Country 2025 & 2033
- Figure 65: Latin America Composite Testing Equipment Industry Revenue Share (%), by Country 2025 & 2033
- Figure 66: Latin America Composite Testing Equipment Industry Volume Share (%), by Country 2025 & 2033
- Figure 67: Middle East Composite Testing Equipment Industry Revenue (billion), by Product Type 2025 & 2033
- Figure 68: Middle East Composite Testing Equipment Industry Volume (K Unit), by Product Type 2025 & 2033
- Figure 69: Middle East Composite Testing Equipment Industry Revenue Share (%), by Product Type 2025 & 2033
- Figure 70: Middle East Composite Testing Equipment Industry Volume Share (%), by Product Type 2025 & 2033
- Figure 71: Middle East Composite Testing Equipment Industry Revenue (billion), by Testing Method 2025 & 2033
- Figure 72: Middle East Composite Testing Equipment Industry Volume (K Unit), by Testing Method 2025 & 2033
- Figure 73: Middle East Composite Testing Equipment Industry Revenue Share (%), by Testing Method 2025 & 2033
- Figure 74: Middle East Composite Testing Equipment Industry Volume Share (%), by Testing Method 2025 & 2033
- Figure 75: Middle East Composite Testing Equipment Industry Revenue (billion), by Application 2025 & 2033
- Figure 76: Middle East Composite Testing Equipment Industry Volume (K Unit), by Application 2025 & 2033
- Figure 77: Middle East Composite Testing Equipment Industry Revenue Share (%), by Application 2025 & 2033
- Figure 78: Middle East Composite Testing Equipment Industry Volume Share (%), by Application 2025 & 2033
- Figure 79: Middle East Composite Testing Equipment Industry Revenue (billion), by Country 2025 & 2033
- Figure 80: Middle East Composite Testing Equipment Industry Volume (K Unit), by Country 2025 & 2033
- Figure 81: Middle East Composite Testing Equipment Industry Revenue Share (%), by Country 2025 & 2033
- Figure 82: Middle East Composite Testing Equipment Industry Volume Share (%), by Country 2025 & 2033
List of Tables
- Table 1: Global Composite Testing Equipment Industry Revenue billion Forecast, by Product Type 2020 & 2033
- Table 2: Global Composite Testing Equipment Industry Volume K Unit Forecast, by Product Type 2020 & 2033
- Table 3: Global Composite Testing Equipment Industry Revenue billion Forecast, by Testing Method 2020 & 2033
- Table 4: Global Composite Testing Equipment Industry Volume K Unit Forecast, by Testing Method 2020 & 2033
- Table 5: Global Composite Testing Equipment Industry Revenue billion Forecast, by Application 2020 & 2033
- Table 6: Global Composite Testing Equipment Industry Volume K Unit Forecast, by Application 2020 & 2033
- Table 7: Global Composite Testing Equipment Industry Revenue billion Forecast, by Region 2020 & 2033
- Table 8: Global Composite Testing Equipment Industry Volume K Unit Forecast, by Region 2020 & 2033
- Table 9: Global Composite Testing Equipment Industry Revenue billion Forecast, by Product Type 2020 & 2033
- Table 10: Global Composite Testing Equipment Industry Volume K Unit Forecast, by Product Type 2020 & 2033
- Table 11: Global Composite Testing Equipment Industry Revenue billion Forecast, by Testing Method 2020 & 2033
- Table 12: Global Composite Testing Equipment Industry Volume K Unit Forecast, by Testing Method 2020 & 2033
- Table 13: Global Composite Testing Equipment Industry Revenue billion Forecast, by Application 2020 & 2033
- Table 14: Global Composite Testing Equipment Industry Volume K Unit Forecast, by Application 2020 & 2033
- Table 15: Global Composite Testing Equipment Industry Revenue billion Forecast, by Country 2020 & 2033
- Table 16: Global Composite Testing Equipment Industry Volume K Unit Forecast, by Country 2020 & 2033
- Table 17: Global Composite Testing Equipment Industry Revenue billion Forecast, by Product Type 2020 & 2033
- Table 18: Global Composite Testing Equipment Industry Volume K Unit Forecast, by Product Type 2020 & 2033
- Table 19: Global Composite Testing Equipment Industry Revenue billion Forecast, by Testing Method 2020 & 2033
- Table 20: Global Composite Testing Equipment Industry Volume K Unit Forecast, by Testing Method 2020 & 2033
- Table 21: Global Composite Testing Equipment Industry Revenue billion Forecast, by Application 2020 & 2033
- Table 22: Global Composite Testing Equipment Industry Volume K Unit Forecast, by Application 2020 & 2033
- Table 23: Global Composite Testing Equipment Industry Revenue billion Forecast, by Country 2020 & 2033
- Table 24: Global Composite Testing Equipment Industry Volume K Unit Forecast, by Country 2020 & 2033
- Table 25: Global Composite Testing Equipment Industry Revenue billion Forecast, by Product Type 2020 & 2033
- Table 26: Global Composite Testing Equipment Industry Volume K Unit Forecast, by Product Type 2020 & 2033
- Table 27: Global Composite Testing Equipment Industry Revenue billion Forecast, by Testing Method 2020 & 2033
- Table 28: Global Composite Testing Equipment Industry Volume K Unit Forecast, by Testing Method 2020 & 2033
- Table 29: Global Composite Testing Equipment Industry Revenue billion Forecast, by Application 2020 & 2033
- Table 30: Global Composite Testing Equipment Industry Volume K Unit Forecast, by Application 2020 & 2033
- Table 31: Global Composite Testing Equipment Industry Revenue billion Forecast, by Country 2020 & 2033
- Table 32: Global Composite Testing Equipment Industry Volume K Unit Forecast, by Country 2020 & 2033
- Table 33: Global Composite Testing Equipment Industry Revenue billion Forecast, by Product Type 2020 & 2033
- Table 34: Global Composite Testing Equipment Industry Volume K Unit Forecast, by Product Type 2020 & 2033
- Table 35: Global Composite Testing Equipment Industry Revenue billion Forecast, by Testing Method 2020 & 2033
- Table 36: Global Composite Testing Equipment Industry Volume K Unit Forecast, by Testing Method 2020 & 2033
- Table 37: Global Composite Testing Equipment Industry Revenue billion Forecast, by Application 2020 & 2033
- Table 38: Global Composite Testing Equipment Industry Volume K Unit Forecast, by Application 2020 & 2033
- Table 39: Global Composite Testing Equipment Industry Revenue billion Forecast, by Country 2020 & 2033
- Table 40: Global Composite Testing Equipment Industry Volume K Unit Forecast, by Country 2020 & 2033
- Table 41: Global Composite Testing Equipment Industry Revenue billion Forecast, by Product Type 2020 & 2033
- Table 42: Global Composite Testing Equipment Industry Volume K Unit Forecast, by Product Type 2020 & 2033
- Table 43: Global Composite Testing Equipment Industry Revenue billion Forecast, by Testing Method 2020 & 2033
- Table 44: Global Composite Testing Equipment Industry Volume K Unit Forecast, by Testing Method 2020 & 2033
- Table 45: Global Composite Testing Equipment Industry Revenue billion Forecast, by Application 2020 & 2033
- Table 46: Global Composite Testing Equipment Industry Volume K Unit Forecast, by Application 2020 & 2033
- Table 47: Global Composite Testing Equipment Industry Revenue billion Forecast, by Country 2020 & 2033
- Table 48: Global Composite Testing Equipment Industry Volume K Unit Forecast, by Country 2020 & 2033
Frequently Asked Questions
1. What is the projected Compound Annual Growth Rate (CAGR) of the Composite Testing Equipment Industry?
The projected CAGR is approximately 7.16%.
2. Which companies are prominent players in the Composite Testing Equipment Industry?
Key companies in the market include Henkel AG & Co KGaA, Intertek Group PLC, ETIM Composites Testing Laboratory, Composites Testing Laboratory, Mistras Group Inc, Westmoreland Mechanical Testing & Research Inc , Element Materials Technology, Matrix Composites Inc (ITT Inc ), Instron Corporation (Illinois Tool Works Inc ).
3. What are the main segments of the Composite Testing Equipment Industry?
The market segments include Product Type, Testing Method, Application.
4. Can you provide details about the market size?
The market size is estimated to be USD 2.58 billion as of 2022.
5. What are some drivers contributing to market growth?
; Large Investments on Composites Testing Facilities in Asia-Pacific; Increasing Demand for Composite Testing From Automotive and Aerospace & Defense; Growing Demand for Testing of Hydraulic Frames in Aerospace & Defense Application.
6. What are the notable trends driving market growth?
Building and Construction Segment Expected to Show Significant Growth in Application.
7. Are there any restraints impacting market growth?
; Lack of Trained Operators and Expertise in Developing Regions; Issues Related to Recyclability of Composites.
8. Can you provide examples of recent developments in the market?
N/A
9. What pricing options are available for accessing the report?
Pricing options include single-user, multi-user, and enterprise licenses priced at USD 4750, USD 5250, and USD 8750 respectively.
10. Is the market size provided in terms of value or volume?
The market size is provided in terms of value, measured in billion and volume, measured in K Unit.
11. Are there any specific market keywords associated with the report?
Yes, the market keyword associated with the report is "Composite Testing Equipment Industry," which aids in identifying and referencing the specific market segment covered.
12. How do I determine which pricing option suits my needs best?
The pricing options vary based on user requirements and access needs. Individual users may opt for single-user licenses, while businesses requiring broader access may choose multi-user or enterprise licenses for cost-effective access to the report.
13. Are there any additional resources or data provided in the Composite Testing Equipment Industry report?
While the report offers comprehensive insights, it's advisable to review the specific contents or supplementary materials provided to ascertain if additional resources or data are available.
14. How can I stay updated on further developments or reports in the Composite Testing Equipment Industry?
To stay informed about further developments, trends, and reports in the Composite Testing Equipment Industry, consider subscribing to industry newsletters, following relevant companies and organizations, or regularly checking reputable industry news sources and publications.
Methodology
Step 1 - Identification of Relevant Samples Size from Population Database


Step 2 - Approaches for Defining Global Market Size (Value, Volume* & Price*)

Note*: In applicable scenarios
Step 3 - Data Sources
Primary Research
- Web Analytics
- Survey Reports
- Research Institute
- Latest Research Reports
- Opinion Leaders
Secondary Research
- Annual Reports
- White Paper
- Latest Press Release
- Industry Association
- Paid Database
- Investor Presentations

Step 4 - Data Triangulation
Involves using different sources of information in order to increase the validity of a study
These sources are likely to be stakeholders in a program - participants, other researchers, program staff, other community members, and so on.
Then we put all data in single framework & apply various statistical tools to find out the dynamic on the market.
During the analysis stage, feedback from the stakeholder groups would be compared to determine areas of agreement as well as areas of divergence