

Key Insights
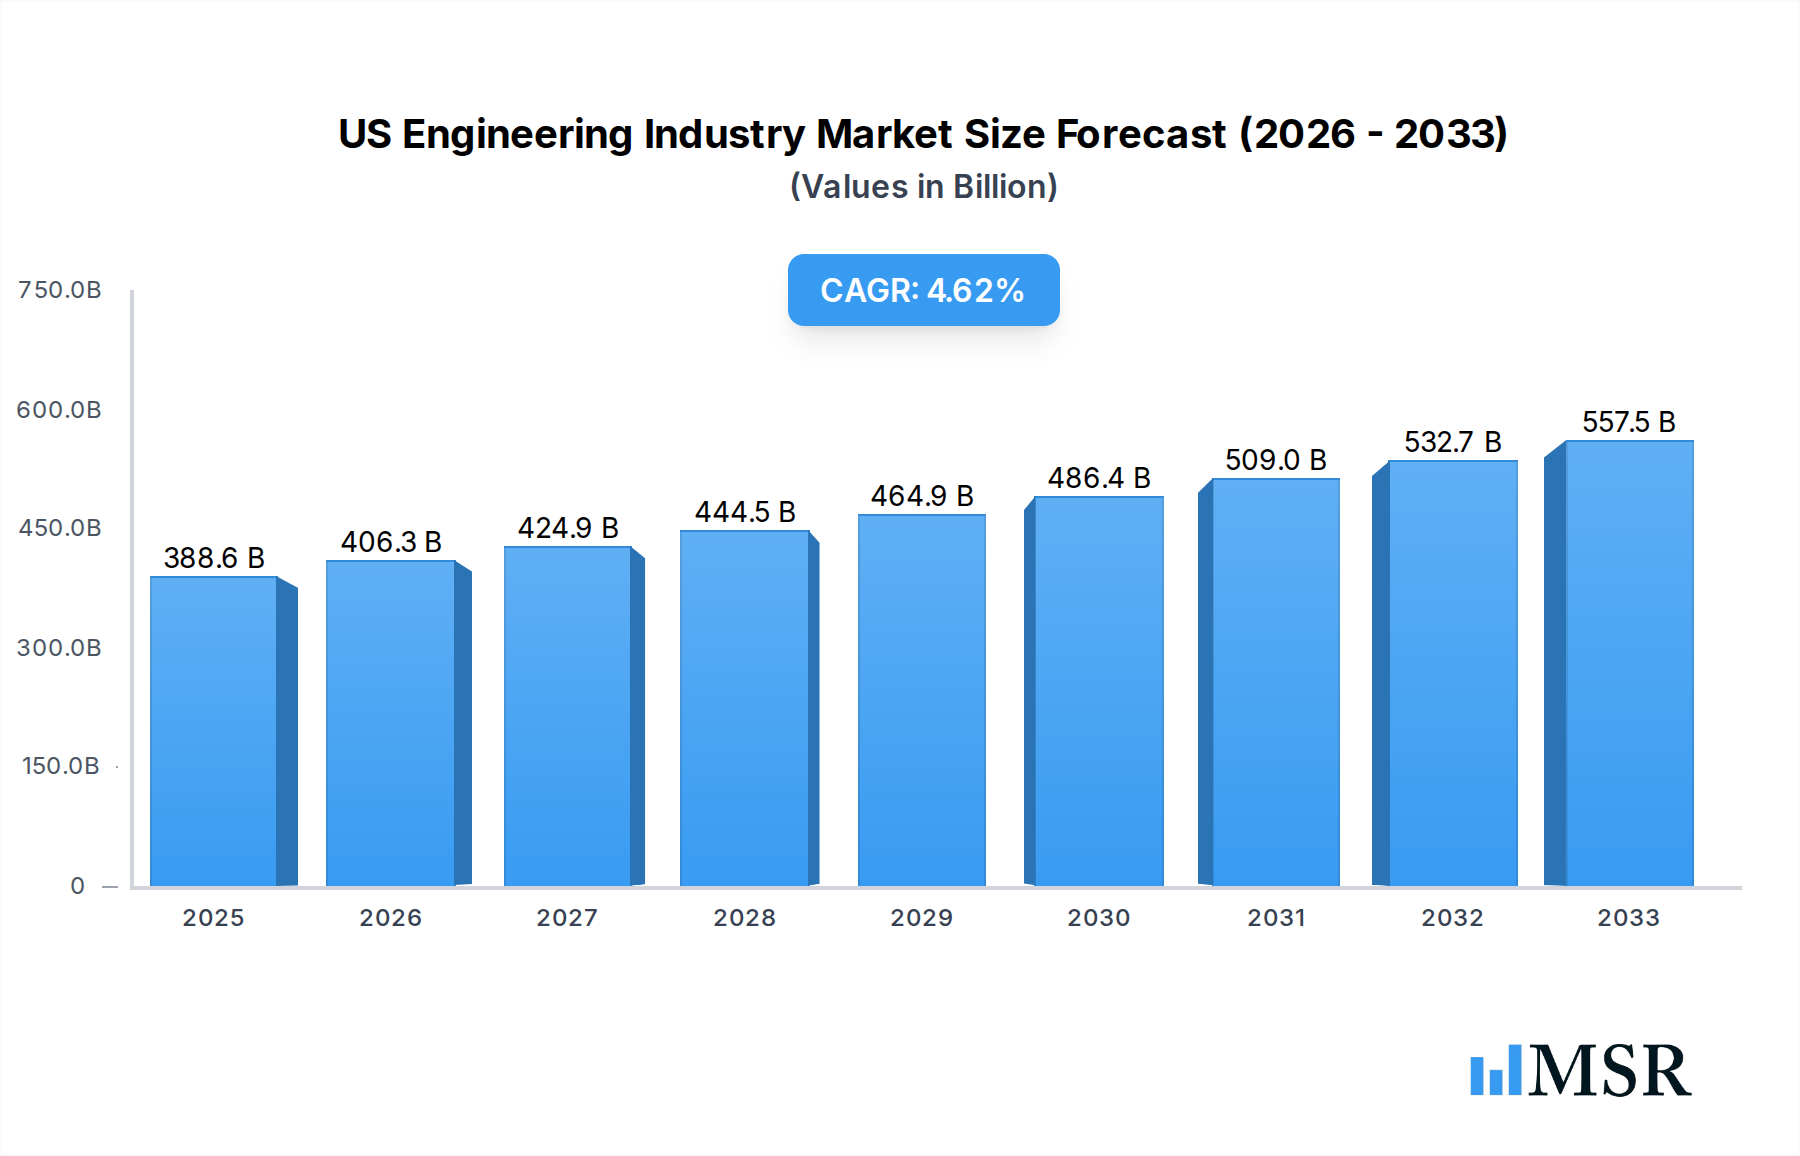
The US engineering industry is poised for significant growth, projected to reach a market size of $388.56 billion by 2025, with a robust Compound Annual Growth Rate (CAGR) of 4.5% anticipated throughout the forecast period (2025-2033). This expansion is fueled by critical infrastructure development and modernization initiatives across various sectors. Key drivers include the escalating demand for sustainable and resilient infrastructure, particularly in civil engineering disciplines like transportation and utilities, to address climate change and aging systems. The ongoing digital transformation, encompassing smart city projects and the integration of AI and IoT in manufacturing and oil & gas, is also a major impetus. Furthermore, government investments in renewable energy and advanced manufacturing are creating substantial opportunities for electrical, mechanical, and environmental engineering services. The industry's ability to adapt to evolving technological landscapes and increasingly stringent environmental regulations will be paramount to sustaining this growth trajectory.

US Engineering Industry Market Size (In Billion)
The US engineering market is characterized by a diverse range of end-user industries, with construction, utilities, and transportation sectors leading the charge in leveraging engineering expertise. While these sectors represent significant current demand, emerging trends in specialized engineering services for the oil & gas and manufacturing industries, driven by automation and efficiency improvements, are also notable. Restraints such as a shortage of skilled labor and the high cost of advanced technology adoption could temper the pace of growth, but strategic investments in workforce development and innovation are expected to mitigate these challenges. The competitive landscape features established players like Bechtel Corporation, Jacobs Engineering Group, and AECOM, who are continuously innovating and expanding their service portfolios to capture market share across different engineering disciplines and geographic regions within North America.
US Engineering Industry Company Market Share
Dive into the comprehensive US Engineering Industry report, a definitive guide for stakeholders seeking deep insights into this critical sector. This report provides an in-depth analysis of the market from 2019 to 2033, with a base year of 2025 and a robust forecast period of 2025–2033. Covering the historical period of 2019–2024, this research offers a panoramic view of market dynamics, engineering disciplines including Civil, Mechanical, Electrical, and Environmental, and key end-user industries such as Construction, Oil & Gas, Manufacturing, Utilities, and Transportation. Uncover market concentration, innovation, regulatory frameworks, and M&A activities driven by leading firms like Terracon, Bechtel Corporation, Jacobs Engineering Group, KBR Inc, HDR Inc, Fluor Corporation, Jensen Hughes, AECOM, Black & Veatch Holding Company, and ECS Group of Companies. With an estimated market size of hundreds of billions, this report is essential for strategic planning and investment.
US Engineering Industry Market Concentration & Dynamics
The US Engineering Industry exhibits a moderately concentrated market structure, characterized by a mix of large, established engineering, procurement, and construction (EPC) giants and a significant number of specialized firms. Innovation ecosystems thrive through collaborations between industry leaders and academic institutions, focusing on sustainable design, digital transformation, and advanced materials. Regulatory frameworks, including environmental protection laws and building codes, significantly shape project execution and demand for specialized engineering services. Substitute products, such as off-site construction methods and advanced software solutions, are increasingly influencing traditional engineering disciplines. End-user trends are heavily influenced by infrastructure investment, renewable energy expansion, and the Oil & Gas sector's evolving needs. M&A activities, with an estimated xx deal counts annually, aim to consolidate expertise, expand service portfolios, and gain market share. Market share distribution varies across segments, with larger players like Bechtel Corporation and AECOM holding significant portions in large-scale infrastructure and defense projects, while specialized firms dominate niche markets.
US Engineering Industry Industry Insights & Trends
The US Engineering Industry is poised for substantial growth, driven by massive infrastructure revitalization initiatives and the accelerating transition to renewable energy sources. The market size is projected to reach hundreds of billions by the end of the forecast period, with a Compound Annual Growth Rate (CAGR) of approximately xx%. Technological disruptions, including the widespread adoption of Artificial Intelligence (AI), Building Information Modeling (BIM), and the Internet of Things (IoT), are revolutionizing project design, execution, and maintenance. These technologies enhance efficiency, reduce costs, and improve project outcomes across all engineering disciplines. Evolving consumer behaviors, particularly the increasing demand for sustainable and resilient infrastructure, are pushing engineering firms to prioritize green building practices and climate change adaptation solutions. The Construction sector, a primary end-user, is experiencing a surge in demand for modern residential and commercial spaces, while the Utilities sector is investing heavily in grid modernization and the integration of distributed energy resources. The Oil & Gas industry, though facing long-term transition pressures, continues to require advanced engineering solutions for complex extraction and processing projects. The Transportation sector is undergoing a transformation with a focus on high-speed rail, smart highways, and electric vehicle infrastructure, all demanding sophisticated engineering expertise.
Key Markets & Segments Leading US Engineering Industry
The US Engineering Industry is predominantly driven by North America, with the United States serving as the largest and most dynamic market globally. Within the engineering disciplines, Civil Engineering remains a cornerstone, fueled by extensive public and private investments in infrastructure development, including bridges, roads, and water systems. Environmental Engineering is experiencing significant growth, driven by stringent regulations and a growing emphasis on sustainability, climate change mitigation, and remediation projects. The Construction end-user industry is the largest segment, encompassing residential, commercial, and industrial building projects that require comprehensive engineering design and execution. The Utilities sector is also a major contributor, with substantial investments in modernizing power grids, expanding renewable energy capacity, and upgrading water and wastewater treatment facilities.
- Drivers in Civil Engineering:
- Government infrastructure spending and stimulus packages.
- Urbanization and the need for expanded transportation networks.
- Aging infrastructure requiring rehabilitation and replacement.
- Drivers in Environmental Engineering:
- Increasingly stringent environmental regulations and compliance requirements.
- Demand for renewable energy infrastructure development.
- Climate change adaptation and resilience planning.
- Dominance Analysis - Construction: The Construction sector's dominance stems from its direct correlation with economic growth and population expansion. Large-scale projects, from skyscrapers to public facilities, consistently require a broad spectrum of engineering services, including structural, mechanical, and electrical design.
- Dominance Analysis - Utilities: The Utilities sector's importance is amplified by the ongoing energy transition and the critical need for reliable and sustainable energy and water supply. The integration of renewable sources and the modernization of aging grids necessitate significant engineering innovation and investment.
US Engineering Industry Product Developments
Recent product developments in the US Engineering Industry are centered on enhancing efficiency, sustainability, and digital integration. Innovations in advanced materials, such as self-healing concrete and high-performance composites, are improving structural integrity and longevity. The proliferation of AI-powered design software and predictive analytics tools is transforming project planning and risk management. Digital twins are enabling real-time monitoring and optimization of infrastructure, from power grids to transportation networks. Furthermore, advancements in modular construction techniques and prefabrication are streamlining project timelines and reducing on-site labor requirements, offering a competitive edge.
Challenges in the US Engineering Industry Market
The US Engineering Industry faces several persistent challenges that impact its growth trajectory. Regulatory hurdles, including complex permitting processes and evolving environmental standards, can lead to project delays and increased costs. Supply chain disruptions, exacerbated by global events, continue to affect the availability and pricing of critical materials and components, impacting project timelines and budgets. Intense competitive pressures, both domestically and internationally, drive down profit margins for standard engineering services. The skilled labor shortage remains a critical restraint, with a growing demand for experienced engineers and technicians outpacing supply.
Forces Driving US Engineering Industry Growth
Several powerful forces are propelling the US Engineering Industry forward. The Biden administration's commitment to significant infrastructure investment, including the Bipartisan Infrastructure Law, is a primary catalyst. The accelerating global push towards decarbonization and renewable energy solutions is creating immense opportunities for Environmental Engineering and the design of clean energy infrastructure. Technological advancements, such as AI, machine learning, and advanced robotics, are not only improving project execution but also enabling the development of entirely new engineering solutions. Furthermore, the increasing demand for resilient infrastructure to withstand climate change impacts is driving innovation in specialized engineering disciplines.
Challenges in the US Engineering Industry Market
Long-term growth catalysts for the US Engineering Industry lie in its capacity for continuous innovation and strategic adaptation. The ongoing digital transformation, encompassing the adoption of Industry 4.0 technologies, presents a significant avenue for enhancing efficiency and developing smart infrastructure. Strategic partnerships between engineering firms, technology providers, and government agencies are crucial for tackling complex challenges and driving large-scale projects. Market expansions into emerging areas, such as smart cities and advanced manufacturing facilities, will be critical for sustained growth. The industry's ability to attract and retain a diverse and skilled workforce will be paramount in capitalizing on these future opportunities.
Emerging Opportunities in US Engineering Industry
Emerging opportunities in the US Engineering Industry are abundant, particularly in the realm of smart city development and the retrofitting of existing urban infrastructure. The growing demand for sustainable and circular economy solutions presents significant potential for Environmental Engineering firms specializing in waste-to-energy projects and advanced recycling infrastructure. The continued expansion of the Oil & Gas sector's role in global energy security, coupled with investments in new technologies like carbon capture and storage, will necessitate ongoing engineering expertise. Furthermore, the increasing focus on resilient infrastructure to combat extreme weather events opens avenues for specialized engineering services in disaster preparedness and climate adaptation.
Leading Players in the US Engineering Industry Sector
- Terracon
- Bechtel Corporation
- Jacobs Engineering Group
- KBR Inc
- HDR Inc
- Fluor Corporation
- Jensen Hughes
- AECOM
- Black & Veatch Holding Company
- ECS Group of Companies
Key Milestones in US Engineering Industry Industry
- May 2022: The Naval Facilities Engineering Systems Command (NAVFAC) Atlantic awarded AECOM's Resolution Consultants joint venture with EnSafe a solitary, indefinite-delivery, indefinite-quantity (IDIQ) contract valued at USD 400 million. This contract focuses on delivering architecture and engineering services for the Comprehensive Long-Term Environmental Action Navy (CLEAN) program, involving environmental research, investigations, and designs to address major environmental concerns. This significantly bolsters AECOM's presence in the environmental remediation sector.
- November 2021: The US Navy selected Bechtel, a prominent engineering and construction firm, as one of five teams to compete for work on a multi-year initiative to build new dry docks and shipyard infrastructure at Pearl Harbor and Puget Sound. This critical project, valued in the billions, will support current and future nuclear submarines and aircraft carriers, highlighting Bechtel's crucial role in national defense infrastructure development.
Strategic Outlook for US Engineering Industry Market
The strategic outlook for the US Engineering Industry is exceptionally positive, fueled by sustained government investment in infrastructure, a robust demand for renewable energy solutions, and the relentless pace of technological advancement. The industry is well-positioned to capitalize on the transition to a low-carbon economy, the modernization of critical infrastructure, and the development of smart and resilient urban environments. Strategic growth will be driven by a focus on innovation in digital engineering, sustainable design practices, and the expansion of services into emerging sectors. Collaboration, talent development, and a commitment to environmental stewardship will be paramount for long-term success in this dynamic and essential industry.
US Engineering Industry Segmentation
-
1. Engineering Disciplines
- 1.1. Civil
- 1.2. Mechanical
- 1.3. Electrical
- 1.4. Environmental
-
2. End-user Industry
- 2.1. Construction
- 2.2. Oil & Gas
- 2.3. Manufacturing
- 2.4. Utilities
- 2.5. Transportation
- 2.6. Other End-user Industries
US Engineering Industry Segmentation By Geography
-
1. North America
- 1.1. United States
- 1.2. Canada
- 1.3. Mexico
-
2. South America
- 2.1. Brazil
- 2.2. Argentina
- 2.3. Rest of South America
-
3. Europe
- 3.1. United Kingdom
- 3.2. Germany
- 3.3. France
- 3.4. Italy
- 3.5. Spain
- 3.6. Russia
- 3.7. Benelux
- 3.8. Nordics
- 3.9. Rest of Europe
-
4. Middle East & Africa
- 4.1. Turkey
- 4.2. Israel
- 4.3. GCC
- 4.4. North Africa
- 4.5. South Africa
- 4.6. Rest of Middle East & Africa
-
5. Asia Pacific
- 5.1. China
- 5.2. India
- 5.3. Japan
- 5.4. South Korea
- 5.5. ASEAN
- 5.6. Oceania
- 5.7. Rest of Asia Pacific
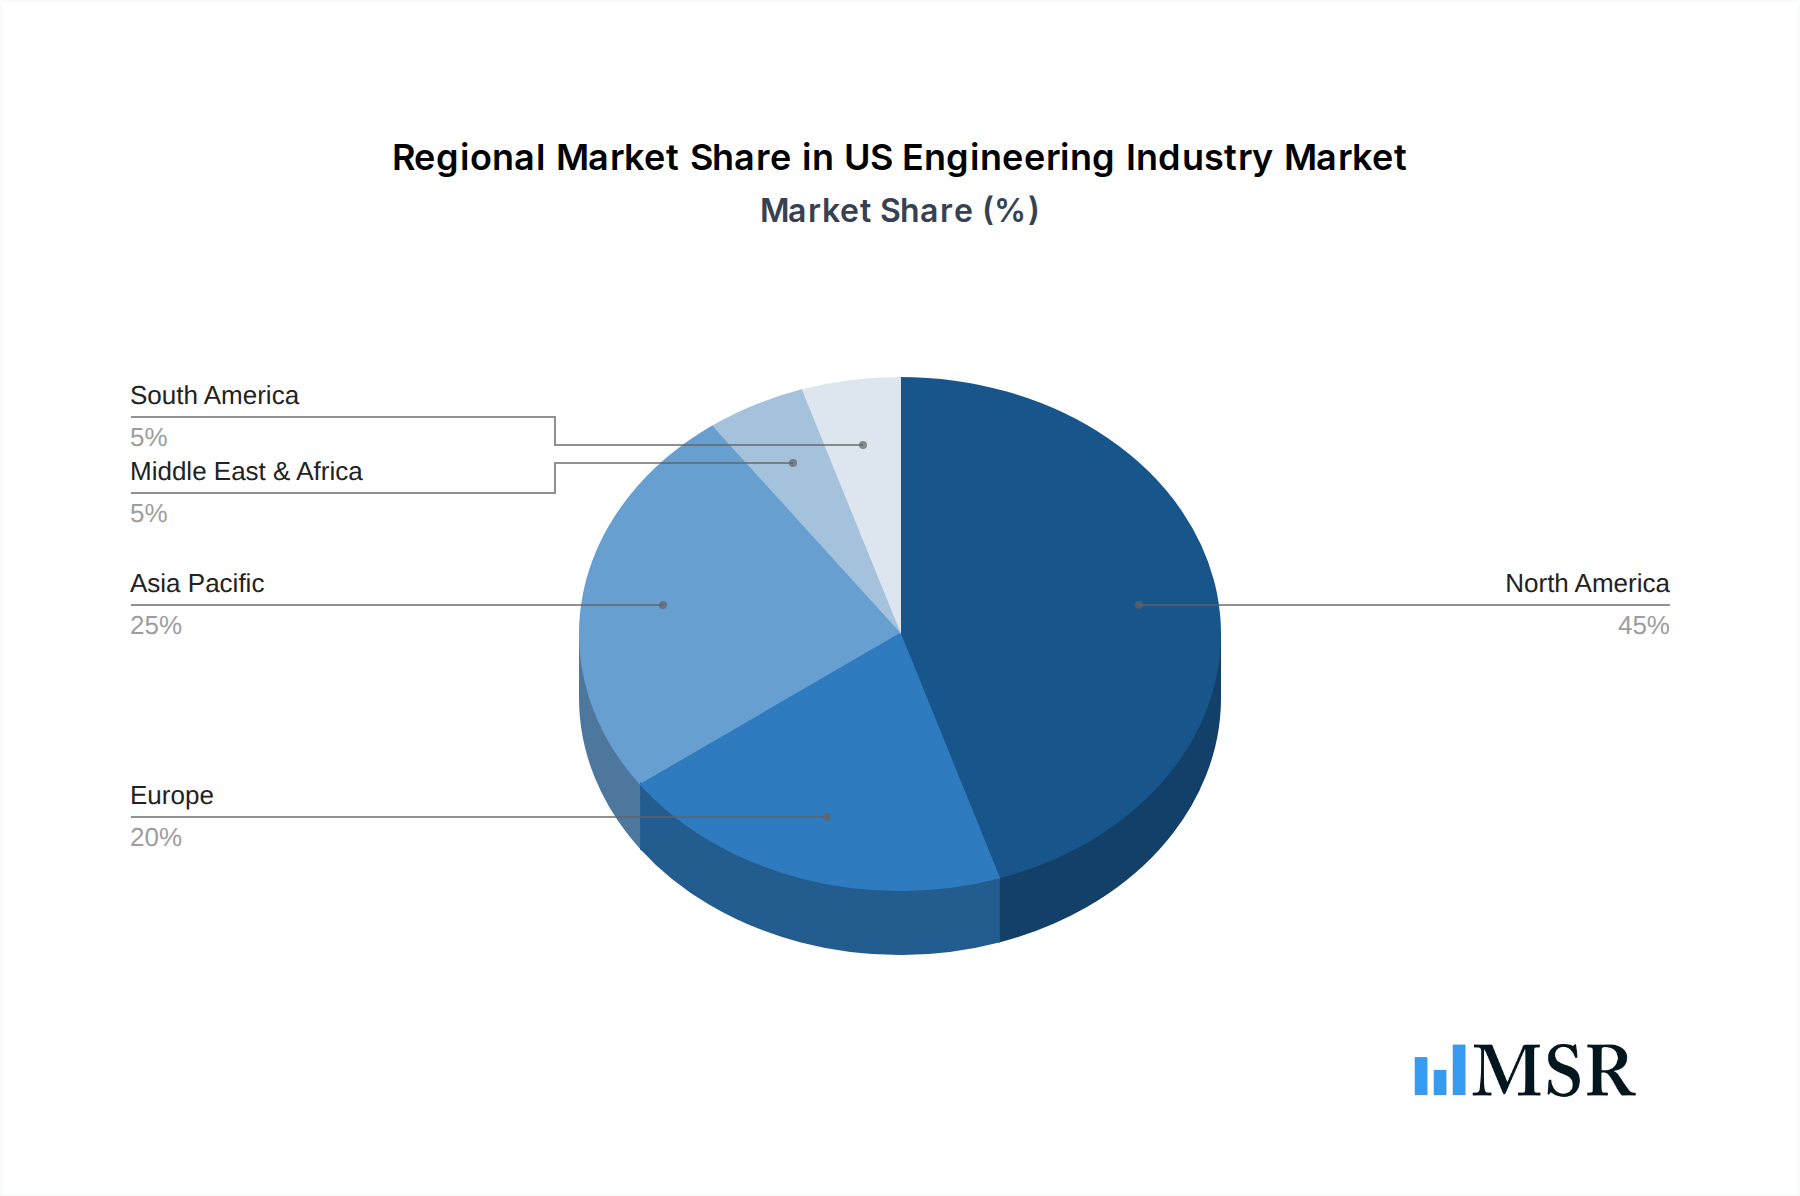
US Engineering Industry Regional Market Share
Geographic Coverage of US Engineering Industry
US Engineering Industry REPORT HIGHLIGHTS
| Aspects | Details |
|---|---|
| Study Period | 2020-2034 |
| Base Year | 2025 |
| Estimated Year | 2026 |
| Forecast Period | 2026-2034 |
| Historical Period | 2020-2025 |
| Growth Rate | CAGR of 4.5% from 2020-2034 |
| Segmentation |
|
Table of Contents
- 1. Introduction
- 1.1. Research Scope
- 1.2. Market Segmentation
- 1.3. Research Objective
- 1.4. Definitions and Assumptions
- 2. Executive Summary
- 2.1. Market Snapshot
- 3. Market Dynamics
- 3.1. Market Drivers
- 3.2. Market Restrains
- 3.3. Market Trends
- 3.4. Market Opportunities
- 4. Market Factor Analysis
- 4.1. Porters Five Forces
- 4.1.1. Bargaining Power of Suppliers
- 4.1.2. Bargaining Power of Buyers
- 4.1.3. Threat of New Entrants
- 4.1.4. Threat of Substitutes
- 4.1.5. Competitive Rivalry
- 4.2. PESTEL analysis
- 4.3. BCG Analysis
- 4.3.1. Stars (High Growth, High Market Share)
- 4.3.2. Cash Cows (Low Growth, High Market Share)
- 4.3.3. Question Mark (High Growth, Low Market Share)
- 4.3.4. Dogs (Low Growth, Low Market Share)
- 4.4. Ansoff Matrix Analysis
- 4.5. Supply Chain Analysis
- 4.6. Regulatory Landscape
- 4.7. Current Market Potential and Opportunity Assessment (TAM–SAM–SOM Framework)
- 4.8. MSR Analyst Note
- 4.1. Porters Five Forces
- 5. Market Analysis, Insights and Forecast 2021-2033
- 5.1. Market Analysis, Insights and Forecast - by Engineering Disciplines
- 5.1.1. Civil
- 5.1.2. Mechanical
- 5.1.3. Electrical
- 5.1.4. Environmental
- 5.2. Market Analysis, Insights and Forecast - by End-user Industry
- 5.2.1. Construction
- 5.2.2. Oil & Gas
- 5.2.3. Manufacturing
- 5.2.4. Utilities
- 5.2.5. Transportation
- 5.2.6. Other End-user Industries
- 5.3. Market Analysis, Insights and Forecast - by Region
- 5.3.1. North America
- 5.3.2. South America
- 5.3.3. Europe
- 5.3.4. Middle East & Africa
- 5.3.5. Asia Pacific
- 5.1. Market Analysis, Insights and Forecast - by Engineering Disciplines
- 6. Global US Engineering Industry Analysis, Insights and Forecast, 2021-2033
- 6.1. Market Analysis, Insights and Forecast - by Engineering Disciplines
- 6.1.1. Civil
- 6.1.2. Mechanical
- 6.1.3. Electrical
- 6.1.4. Environmental
- 6.2. Market Analysis, Insights and Forecast - by End-user Industry
- 6.2.1. Construction
- 6.2.2. Oil & Gas
- 6.2.3. Manufacturing
- 6.2.4. Utilities
- 6.2.5. Transportation
- 6.2.6. Other End-user Industries
- 6.1. Market Analysis, Insights and Forecast - by Engineering Disciplines
- 7. North America US Engineering Industry Analysis, Insights and Forecast, 2020-2032
- 7.1. Market Analysis, Insights and Forecast - by Engineering Disciplines
- 7.1.1. Civil
- 7.1.2. Mechanical
- 7.1.3. Electrical
- 7.1.4. Environmental
- 7.2. Market Analysis, Insights and Forecast - by End-user Industry
- 7.2.1. Construction
- 7.2.2. Oil & Gas
- 7.2.3. Manufacturing
- 7.2.4. Utilities
- 7.2.5. Transportation
- 7.2.6. Other End-user Industries
- 7.1. Market Analysis, Insights and Forecast - by Engineering Disciplines
- 8. South America US Engineering Industry Analysis, Insights and Forecast, 2020-2032
- 8.1. Market Analysis, Insights and Forecast - by Engineering Disciplines
- 8.1.1. Civil
- 8.1.2. Mechanical
- 8.1.3. Electrical
- 8.1.4. Environmental
- 8.2. Market Analysis, Insights and Forecast - by End-user Industry
- 8.2.1. Construction
- 8.2.2. Oil & Gas
- 8.2.3. Manufacturing
- 8.2.4. Utilities
- 8.2.5. Transportation
- 8.2.6. Other End-user Industries
- 8.1. Market Analysis, Insights and Forecast - by Engineering Disciplines
- 9. Europe US Engineering Industry Analysis, Insights and Forecast, 2020-2032
- 9.1. Market Analysis, Insights and Forecast - by Engineering Disciplines
- 9.1.1. Civil
- 9.1.2. Mechanical
- 9.1.3. Electrical
- 9.1.4. Environmental
- 9.2. Market Analysis, Insights and Forecast - by End-user Industry
- 9.2.1. Construction
- 9.2.2. Oil & Gas
- 9.2.3. Manufacturing
- 9.2.4. Utilities
- 9.2.5. Transportation
- 9.2.6. Other End-user Industries
- 9.1. Market Analysis, Insights and Forecast - by Engineering Disciplines
- 10. Middle East & Africa US Engineering Industry Analysis, Insights and Forecast, 2020-2032
- 10.1. Market Analysis, Insights and Forecast - by Engineering Disciplines
- 10.1.1. Civil
- 10.1.2. Mechanical
- 10.1.3. Electrical
- 10.1.4. Environmental
- 10.2. Market Analysis, Insights and Forecast - by End-user Industry
- 10.2.1. Construction
- 10.2.2. Oil & Gas
- 10.2.3. Manufacturing
- 10.2.4. Utilities
- 10.2.5. Transportation
- 10.2.6. Other End-user Industries
- 10.1. Market Analysis, Insights and Forecast - by Engineering Disciplines
- 11. Asia Pacific US Engineering Industry Analysis, Insights and Forecast, 2020-2032
- 11.1. Market Analysis, Insights and Forecast - by Engineering Disciplines
- 11.1.1. Civil
- 11.1.2. Mechanical
- 11.1.3. Electrical
- 11.1.4. Environmental
- 11.2. Market Analysis, Insights and Forecast - by End-user Industry
- 11.2.1. Construction
- 11.2.2. Oil & Gas
- 11.2.3. Manufacturing
- 11.2.4. Utilities
- 11.2.5. Transportation
- 11.2.6. Other End-user Industries
- 11.1. Market Analysis, Insights and Forecast - by Engineering Disciplines
- 12. Competitive Analysis
- 12.1. Company Profiles
- 12.1.1 Terracon
- 12.1.1.1. Company Overview
- 12.1.1.2. Products
- 12.1.1.3. Company Financials
- 12.1.1.4. SWOT Analysis
- 12.1.2 Bechtel Corporation
- 12.1.2.1. Company Overview
- 12.1.2.2. Products
- 12.1.2.3. Company Financials
- 12.1.2.4. SWOT Analysis
- 12.1.3 Jacobs Engineering Group
- 12.1.3.1. Company Overview
- 12.1.3.2. Products
- 12.1.3.3. Company Financials
- 12.1.3.4. SWOT Analysis
- 12.1.4 KBR Inc
- 12.1.4.1. Company Overview
- 12.1.4.2. Products
- 12.1.4.3. Company Financials
- 12.1.4.4. SWOT Analysis
- 12.1.5 HDR Inc
- 12.1.5.1. Company Overview
- 12.1.5.2. Products
- 12.1.5.3. Company Financials
- 12.1.5.4. SWOT Analysis
- 12.1.6 Fluor Corporation
- 12.1.6.1. Company Overview
- 12.1.6.2. Products
- 12.1.6.3. Company Financials
- 12.1.6.4. SWOT Analysis
- 12.1.7 Jensen Hughes
- 12.1.7.1. Company Overview
- 12.1.7.2. Products
- 12.1.7.3. Company Financials
- 12.1.7.4. SWOT Analysis
- 12.1.8 AECOM
- 12.1.8.1. Company Overview
- 12.1.8.2. Products
- 12.1.8.3. Company Financials
- 12.1.8.4. SWOT Analysis
- 12.1.9 Black & Veatch Holding Company
- 12.1.9.1. Company Overview
- 12.1.9.2. Products
- 12.1.9.3. Company Financials
- 12.1.9.4. SWOT Analysis
- 12.1.10 ECS Group of Companies
- 12.1.10.1. Company Overview
- 12.1.10.2. Products
- 12.1.10.3. Company Financials
- 12.1.10.4. SWOT Analysis
- 12.1.1 Terracon
- 12.2. Market Entropy
- 12.2.1 Company's Key Areas Served
- 12.2.2 Recent Developments
- 12.3. Company Market Share Analysis 2025
- 12.3.1 Top 5 Companies Market Share Analysis
- 12.3.2 Top 3 Companies Market Share Analysis
- 12.4. List of Potential Customers
- 13. Research Methodology
List of Figures
- Figure 1: Global US Engineering Industry Revenue Breakdown (billion, %) by Region 2025 & 2033
- Figure 2: Global US Engineering Industry Volume Breakdown (K Unit, %) by Region 2025 & 2033
- Figure 3: North America US Engineering Industry Revenue (billion), by Engineering Disciplines 2025 & 2033
- Figure 4: North America US Engineering Industry Volume (K Unit), by Engineering Disciplines 2025 & 2033
- Figure 5: North America US Engineering Industry Revenue Share (%), by Engineering Disciplines 2025 & 2033
- Figure 6: North America US Engineering Industry Volume Share (%), by Engineering Disciplines 2025 & 2033
- Figure 7: North America US Engineering Industry Revenue (billion), by End-user Industry 2025 & 2033
- Figure 8: North America US Engineering Industry Volume (K Unit), by End-user Industry 2025 & 2033
- Figure 9: North America US Engineering Industry Revenue Share (%), by End-user Industry 2025 & 2033
- Figure 10: North America US Engineering Industry Volume Share (%), by End-user Industry 2025 & 2033
- Figure 11: North America US Engineering Industry Revenue (billion), by Country 2025 & 2033
- Figure 12: North America US Engineering Industry Volume (K Unit), by Country 2025 & 2033
- Figure 13: North America US Engineering Industry Revenue Share (%), by Country 2025 & 2033
- Figure 14: North America US Engineering Industry Volume Share (%), by Country 2025 & 2033
- Figure 15: South America US Engineering Industry Revenue (billion), by Engineering Disciplines 2025 & 2033
- Figure 16: South America US Engineering Industry Volume (K Unit), by Engineering Disciplines 2025 & 2033
- Figure 17: South America US Engineering Industry Revenue Share (%), by Engineering Disciplines 2025 & 2033
- Figure 18: South America US Engineering Industry Volume Share (%), by Engineering Disciplines 2025 & 2033
- Figure 19: South America US Engineering Industry Revenue (billion), by End-user Industry 2025 & 2033
- Figure 20: South America US Engineering Industry Volume (K Unit), by End-user Industry 2025 & 2033
- Figure 21: South America US Engineering Industry Revenue Share (%), by End-user Industry 2025 & 2033
- Figure 22: South America US Engineering Industry Volume Share (%), by End-user Industry 2025 & 2033
- Figure 23: South America US Engineering Industry Revenue (billion), by Country 2025 & 2033
- Figure 24: South America US Engineering Industry Volume (K Unit), by Country 2025 & 2033
- Figure 25: South America US Engineering Industry Revenue Share (%), by Country 2025 & 2033
- Figure 26: South America US Engineering Industry Volume Share (%), by Country 2025 & 2033
- Figure 27: Europe US Engineering Industry Revenue (billion), by Engineering Disciplines 2025 & 2033
- Figure 28: Europe US Engineering Industry Volume (K Unit), by Engineering Disciplines 2025 & 2033
- Figure 29: Europe US Engineering Industry Revenue Share (%), by Engineering Disciplines 2025 & 2033
- Figure 30: Europe US Engineering Industry Volume Share (%), by Engineering Disciplines 2025 & 2033
- Figure 31: Europe US Engineering Industry Revenue (billion), by End-user Industry 2025 & 2033
- Figure 32: Europe US Engineering Industry Volume (K Unit), by End-user Industry 2025 & 2033
- Figure 33: Europe US Engineering Industry Revenue Share (%), by End-user Industry 2025 & 2033
- Figure 34: Europe US Engineering Industry Volume Share (%), by End-user Industry 2025 & 2033
- Figure 35: Europe US Engineering Industry Revenue (billion), by Country 2025 & 2033
- Figure 36: Europe US Engineering Industry Volume (K Unit), by Country 2025 & 2033
- Figure 37: Europe US Engineering Industry Revenue Share (%), by Country 2025 & 2033
- Figure 38: Europe US Engineering Industry Volume Share (%), by Country 2025 & 2033
- Figure 39: Middle East & Africa US Engineering Industry Revenue (billion), by Engineering Disciplines 2025 & 2033
- Figure 40: Middle East & Africa US Engineering Industry Volume (K Unit), by Engineering Disciplines 2025 & 2033
- Figure 41: Middle East & Africa US Engineering Industry Revenue Share (%), by Engineering Disciplines 2025 & 2033
- Figure 42: Middle East & Africa US Engineering Industry Volume Share (%), by Engineering Disciplines 2025 & 2033
- Figure 43: Middle East & Africa US Engineering Industry Revenue (billion), by End-user Industry 2025 & 2033
- Figure 44: Middle East & Africa US Engineering Industry Volume (K Unit), by End-user Industry 2025 & 2033
- Figure 45: Middle East & Africa US Engineering Industry Revenue Share (%), by End-user Industry 2025 & 2033
- Figure 46: Middle East & Africa US Engineering Industry Volume Share (%), by End-user Industry 2025 & 2033
- Figure 47: Middle East & Africa US Engineering Industry Revenue (billion), by Country 2025 & 2033
- Figure 48: Middle East & Africa US Engineering Industry Volume (K Unit), by Country 2025 & 2033
- Figure 49: Middle East & Africa US Engineering Industry Revenue Share (%), by Country 2025 & 2033
- Figure 50: Middle East & Africa US Engineering Industry Volume Share (%), by Country 2025 & 2033
- Figure 51: Asia Pacific US Engineering Industry Revenue (billion), by Engineering Disciplines 2025 & 2033
- Figure 52: Asia Pacific US Engineering Industry Volume (K Unit), by Engineering Disciplines 2025 & 2033
- Figure 53: Asia Pacific US Engineering Industry Revenue Share (%), by Engineering Disciplines 2025 & 2033
- Figure 54: Asia Pacific US Engineering Industry Volume Share (%), by Engineering Disciplines 2025 & 2033
- Figure 55: Asia Pacific US Engineering Industry Revenue (billion), by End-user Industry 2025 & 2033
- Figure 56: Asia Pacific US Engineering Industry Volume (K Unit), by End-user Industry 2025 & 2033
- Figure 57: Asia Pacific US Engineering Industry Revenue Share (%), by End-user Industry 2025 & 2033
- Figure 58: Asia Pacific US Engineering Industry Volume Share (%), by End-user Industry 2025 & 2033
- Figure 59: Asia Pacific US Engineering Industry Revenue (billion), by Country 2025 & 2033
- Figure 60: Asia Pacific US Engineering Industry Volume (K Unit), by Country 2025 & 2033
- Figure 61: Asia Pacific US Engineering Industry Revenue Share (%), by Country 2025 & 2033
- Figure 62: Asia Pacific US Engineering Industry Volume Share (%), by Country 2025 & 2033
List of Tables
- Table 1: Global US Engineering Industry Revenue billion Forecast, by Engineering Disciplines 2020 & 2033
- Table 2: Global US Engineering Industry Volume K Unit Forecast, by Engineering Disciplines 2020 & 2033
- Table 3: Global US Engineering Industry Revenue billion Forecast, by End-user Industry 2020 & 2033
- Table 4: Global US Engineering Industry Volume K Unit Forecast, by End-user Industry 2020 & 2033
- Table 5: Global US Engineering Industry Revenue billion Forecast, by Region 2020 & 2033
- Table 6: Global US Engineering Industry Volume K Unit Forecast, by Region 2020 & 2033
- Table 7: Global US Engineering Industry Revenue billion Forecast, by Engineering Disciplines 2020 & 2033
- Table 8: Global US Engineering Industry Volume K Unit Forecast, by Engineering Disciplines 2020 & 2033
- Table 9: Global US Engineering Industry Revenue billion Forecast, by End-user Industry 2020 & 2033
- Table 10: Global US Engineering Industry Volume K Unit Forecast, by End-user Industry 2020 & 2033
- Table 11: Global US Engineering Industry Revenue billion Forecast, by Country 2020 & 2033
- Table 12: Global US Engineering Industry Volume K Unit Forecast, by Country 2020 & 2033
- Table 13: United States US Engineering Industry Revenue (billion) Forecast, by Application 2020 & 2033
- Table 14: United States US Engineering Industry Volume (K Unit) Forecast, by Application 2020 & 2033
- Table 15: Canada US Engineering Industry Revenue (billion) Forecast, by Application 2020 & 2033
- Table 16: Canada US Engineering Industry Volume (K Unit) Forecast, by Application 2020 & 2033
- Table 17: Mexico US Engineering Industry Revenue (billion) Forecast, by Application 2020 & 2033
- Table 18: Mexico US Engineering Industry Volume (K Unit) Forecast, by Application 2020 & 2033
- Table 19: Global US Engineering Industry Revenue billion Forecast, by Engineering Disciplines 2020 & 2033
- Table 20: Global US Engineering Industry Volume K Unit Forecast, by Engineering Disciplines 2020 & 2033
- Table 21: Global US Engineering Industry Revenue billion Forecast, by End-user Industry 2020 & 2033
- Table 22: Global US Engineering Industry Volume K Unit Forecast, by End-user Industry 2020 & 2033
- Table 23: Global US Engineering Industry Revenue billion Forecast, by Country 2020 & 2033
- Table 24: Global US Engineering Industry Volume K Unit Forecast, by Country 2020 & 2033
- Table 25: Brazil US Engineering Industry Revenue (billion) Forecast, by Application 2020 & 2033
- Table 26: Brazil US Engineering Industry Volume (K Unit) Forecast, by Application 2020 & 2033
- Table 27: Argentina US Engineering Industry Revenue (billion) Forecast, by Application 2020 & 2033
- Table 28: Argentina US Engineering Industry Volume (K Unit) Forecast, by Application 2020 & 2033
- Table 29: Rest of South America US Engineering Industry Revenue (billion) Forecast, by Application 2020 & 2033
- Table 30: Rest of South America US Engineering Industry Volume (K Unit) Forecast, by Application 2020 & 2033
- Table 31: Global US Engineering Industry Revenue billion Forecast, by Engineering Disciplines 2020 & 2033
- Table 32: Global US Engineering Industry Volume K Unit Forecast, by Engineering Disciplines 2020 & 2033
- Table 33: Global US Engineering Industry Revenue billion Forecast, by End-user Industry 2020 & 2033
- Table 34: Global US Engineering Industry Volume K Unit Forecast, by End-user Industry 2020 & 2033
- Table 35: Global US Engineering Industry Revenue billion Forecast, by Country 2020 & 2033
- Table 36: Global US Engineering Industry Volume K Unit Forecast, by Country 2020 & 2033
- Table 37: United Kingdom US Engineering Industry Revenue (billion) Forecast, by Application 2020 & 2033
- Table 38: United Kingdom US Engineering Industry Volume (K Unit) Forecast, by Application 2020 & 2033
- Table 39: Germany US Engineering Industry Revenue (billion) Forecast, by Application 2020 & 2033
- Table 40: Germany US Engineering Industry Volume (K Unit) Forecast, by Application 2020 & 2033
- Table 41: France US Engineering Industry Revenue (billion) Forecast, by Application 2020 & 2033
- Table 42: France US Engineering Industry Volume (K Unit) Forecast, by Application 2020 & 2033
- Table 43: Italy US Engineering Industry Revenue (billion) Forecast, by Application 2020 & 2033
- Table 44: Italy US Engineering Industry Volume (K Unit) Forecast, by Application 2020 & 2033
- Table 45: Spain US Engineering Industry Revenue (billion) Forecast, by Application 2020 & 2033
- Table 46: Spain US Engineering Industry Volume (K Unit) Forecast, by Application 2020 & 2033
- Table 47: Russia US Engineering Industry Revenue (billion) Forecast, by Application 2020 & 2033
- Table 48: Russia US Engineering Industry Volume (K Unit) Forecast, by Application 2020 & 2033
- Table 49: Benelux US Engineering Industry Revenue (billion) Forecast, by Application 2020 & 2033
- Table 50: Benelux US Engineering Industry Volume (K Unit) Forecast, by Application 2020 & 2033
- Table 51: Nordics US Engineering Industry Revenue (billion) Forecast, by Application 2020 & 2033
- Table 52: Nordics US Engineering Industry Volume (K Unit) Forecast, by Application 2020 & 2033
- Table 53: Rest of Europe US Engineering Industry Revenue (billion) Forecast, by Application 2020 & 2033
- Table 54: Rest of Europe US Engineering Industry Volume (K Unit) Forecast, by Application 2020 & 2033
- Table 55: Global US Engineering Industry Revenue billion Forecast, by Engineering Disciplines 2020 & 2033
- Table 56: Global US Engineering Industry Volume K Unit Forecast, by Engineering Disciplines 2020 & 2033
- Table 57: Global US Engineering Industry Revenue billion Forecast, by End-user Industry 2020 & 2033
- Table 58: Global US Engineering Industry Volume K Unit Forecast, by End-user Industry 2020 & 2033
- Table 59: Global US Engineering Industry Revenue billion Forecast, by Country 2020 & 2033
- Table 60: Global US Engineering Industry Volume K Unit Forecast, by Country 2020 & 2033
- Table 61: Turkey US Engineering Industry Revenue (billion) Forecast, by Application 2020 & 2033
- Table 62: Turkey US Engineering Industry Volume (K Unit) Forecast, by Application 2020 & 2033
- Table 63: Israel US Engineering Industry Revenue (billion) Forecast, by Application 2020 & 2033
- Table 64: Israel US Engineering Industry Volume (K Unit) Forecast, by Application 2020 & 2033
- Table 65: GCC US Engineering Industry Revenue (billion) Forecast, by Application 2020 & 2033
- Table 66: GCC US Engineering Industry Volume (K Unit) Forecast, by Application 2020 & 2033
- Table 67: North Africa US Engineering Industry Revenue (billion) Forecast, by Application 2020 & 2033
- Table 68: North Africa US Engineering Industry Volume (K Unit) Forecast, by Application 2020 & 2033
- Table 69: South Africa US Engineering Industry Revenue (billion) Forecast, by Application 2020 & 2033
- Table 70: South Africa US Engineering Industry Volume (K Unit) Forecast, by Application 2020 & 2033
- Table 71: Rest of Middle East & Africa US Engineering Industry Revenue (billion) Forecast, by Application 2020 & 2033
- Table 72: Rest of Middle East & Africa US Engineering Industry Volume (K Unit) Forecast, by Application 2020 & 2033
- Table 73: Global US Engineering Industry Revenue billion Forecast, by Engineering Disciplines 2020 & 2033
- Table 74: Global US Engineering Industry Volume K Unit Forecast, by Engineering Disciplines 2020 & 2033
- Table 75: Global US Engineering Industry Revenue billion Forecast, by End-user Industry 2020 & 2033
- Table 76: Global US Engineering Industry Volume K Unit Forecast, by End-user Industry 2020 & 2033
- Table 77: Global US Engineering Industry Revenue billion Forecast, by Country 2020 & 2033
- Table 78: Global US Engineering Industry Volume K Unit Forecast, by Country 2020 & 2033
- Table 79: China US Engineering Industry Revenue (billion) Forecast, by Application 2020 & 2033
- Table 80: China US Engineering Industry Volume (K Unit) Forecast, by Application 2020 & 2033
- Table 81: India US Engineering Industry Revenue (billion) Forecast, by Application 2020 & 2033
- Table 82: India US Engineering Industry Volume (K Unit) Forecast, by Application 2020 & 2033
- Table 83: Japan US Engineering Industry Revenue (billion) Forecast, by Application 2020 & 2033
- Table 84: Japan US Engineering Industry Volume (K Unit) Forecast, by Application 2020 & 2033
- Table 85: South Korea US Engineering Industry Revenue (billion) Forecast, by Application 2020 & 2033
- Table 86: South Korea US Engineering Industry Volume (K Unit) Forecast, by Application 2020 & 2033
- Table 87: ASEAN US Engineering Industry Revenue (billion) Forecast, by Application 2020 & 2033
- Table 88: ASEAN US Engineering Industry Volume (K Unit) Forecast, by Application 2020 & 2033
- Table 89: Oceania US Engineering Industry Revenue (billion) Forecast, by Application 2020 & 2033
- Table 90: Oceania US Engineering Industry Volume (K Unit) Forecast, by Application 2020 & 2033
- Table 91: Rest of Asia Pacific US Engineering Industry Revenue (billion) Forecast, by Application 2020 & 2033
- Table 92: Rest of Asia Pacific US Engineering Industry Volume (K Unit) Forecast, by Application 2020 & 2033
Frequently Asked Questions
1. What is the projected Compound Annual Growth Rate (CAGR) of the US Engineering Industry?
The projected CAGR is approximately 4.5%.
2. Which companies are prominent players in the US Engineering Industry?
Key companies in the market include Terracon, Bechtel Corporation, Jacobs Engineering Group, KBR Inc, HDR Inc, Fluor Corporation, Jensen Hughes, AECOM, Black & Veatch Holding Company, ECS Group of Companies.
3. What are the main segments of the US Engineering Industry?
The market segments include Engineering Disciplines, End-user Industry.
4. Can you provide details about the market size?
The market size is estimated to be USD 388.56 billion as of 2022.
5. What are some drivers contributing to market growth?
Increasing demand due to a growing private investment in large-scale projects and recovery in natural gas and oil prices likely to propel demand from industrial customers; Technological advancements have aided in reducing lead time and resource overheads.
6. What are the notable trends driving market growth?
Civil Engineering Services is Expected to Register a Significant Growth.
7. Are there any restraints impacting market growth?
Market susceptibility to changes in macro-environment as well as regulatory landscape.
8. Can you provide examples of recent developments in the market?
May 2022 - The Naval Facilities Engineering Systems Command (NAVFAC) Atlantic has awarded AECOM's Resolution Consultants joint venture with EnSafe a solitary, indefinite-delivery, indefinite-quantity (IDIQ) contract to deliver architecture and engineering services for the Comprehensive Long-Term Environmental Action Navy (CLEAN) program. The joint venture will conduct environmental research, investigations, and designs that solve major environmental concerns under the contract, which has a USD 400 million budget.
9. What pricing options are available for accessing the report?
Pricing options include single-user, multi-user, and enterprise licenses priced at USD 3800, USD 4500, and USD 5800 respectively.
10. Is the market size provided in terms of value or volume?
The market size is provided in terms of value, measured in billion and volume, measured in K Unit.
11. Are there any specific market keywords associated with the report?
Yes, the market keyword associated with the report is "US Engineering Industry," which aids in identifying and referencing the specific market segment covered.
12. How do I determine which pricing option suits my needs best?
The pricing options vary based on user requirements and access needs. Individual users may opt for single-user licenses, while businesses requiring broader access may choose multi-user or enterprise licenses for cost-effective access to the report.
13. Are there any additional resources or data provided in the US Engineering Industry report?
While the report offers comprehensive insights, it's advisable to review the specific contents or supplementary materials provided to ascertain if additional resources or data are available.
14. How can I stay updated on further developments or reports in the US Engineering Industry?
To stay informed about further developments, trends, and reports in the US Engineering Industry, consider subscribing to industry newsletters, following relevant companies and organizations, or regularly checking reputable industry news sources and publications.
Methodology
Step 1 - Identification of Relevant Samples Size from Population Database


Step 2 - Approaches for Defining Global Market Size (Value, Volume* & Price*)

Note*: In applicable scenarios
Step 3 - Data Sources
Primary Research
- Web Analytics
- Survey Reports
- Research Institute
- Latest Research Reports
- Opinion Leaders
Secondary Research
- Annual Reports
- White Paper
- Latest Press Release
- Industry Association
- Paid Database
- Investor Presentations

Step 4 - Data Triangulation
Involves using different sources of information in order to increase the validity of a study
These sources are likely to be stakeholders in a program - participants, other researchers, program staff, other community members, and so on.
Then we put all data in single framework & apply various statistical tools to find out the dynamic on the market.
During the analysis stage, feedback from the stakeholder groups would be compared to determine areas of agreement as well as areas of divergence